The case of the missing mussel: recovering a lost sample and mapping the mussel methylome
Why we’re looking at mussels
Bay mussels (Mytilus trossulus) spend their whole lives filtering seawater in one spot, so they end up as living records of whatever is in the water around them. That makes them excellent sentinels for coastal pollution. In this project we’re studying mussels from Puget Sound that grew at six different locations — three relatively clean sites and three with high levels of PAHs (polycyclic aromatic hydrocarbons, a family of pollutants that come from oil, soot, and combustion). Twenty-four mussels in all, four from each site.
The question behind the whole project is: does pollution leave a readable mark on a mussel’s DNA? Not by changing the DNA letters themselves, but through DNA methylation — small chemical tags that sit on top of the DNA and can turn the volume of genes up or down. If polluted-site mussels carry a consistent, distinctive methylation pattern, that pattern could become a biomarker: a cheap, fast test for exposure that doesn’t require expensive chemistry on the water itself.
This post is about a piece of housekeeping that turned into a small detective story, plus the first big-picture look at what mussel DNA methylation actually looks like.
A quick word on the data
To read methylation across the whole genome we use whole-genome bisulfite sequencing (WGBS). The practical upshot: for each mussel we get a giant table listing millions of individual CpG sites (specific spots in the DNA where methylation happens) and, for each one, what fraction of DNA copies carried the methyl tag. One mussel’s table is about 750 megabytes. There are 24 of them.
The mystery: one mussel had no data
While setting up the analysis, one sample — mussel 93M, from the Smith Cove industrial site — was missing its data file. At first glance the project notes suggested 93M had been dropped earlier as a “low-quality outlier,” so a missing file seemed plausible.
But something didn’t add up. The raw sequencing reads for 93M were sitting on our server, and they were a completely normal size — just as big as every other mussel’s. A genuinely low-quality sample would have fewer reads, not a full set. So why was there no finished data?
Digging into the records revealed the answer: 93M had never actually been processed. What existed was a tiny 10,000-read test run — the kind of quick check you do to make sure a pipeline works before turning it loose on the real thing. That test had quietly been mistaken for the finished product. The “outlier” was never an outlier; it was simply unfinished.
The recovery
Fixing it meant running 93M through the exact same assembly line as the other 23 mussels, from raw reads to finished methylation table:
- Line up ~41 million pairs of DNA reads against the mussel reference genome (the slow step — about a day of computing).
- Remove duplicate reads left over from sample prep.
- Read off the methylation at every covered CpG site.
- Merge the two DNA strands into one tidy per-site table.
The result: a complete, standard-sized file for 93M with 17.2 million CpG sites and an overall methylation level of 11.65% — right in line with the other mussels. A sample that had been written off was now a full, usable member of the group. (There were a few potholes along the way — a blocked download here, an incompatible software setting there — but nothing that a second pass couldn’t fix.)
What does a mussel methylome look like?
With all 24 mussels finally in hand, we could draw the first complete picture of the M. trossulus methylation “landscape.” Four features stand out, and reassuringly, they all match what’s known from other shellfish.
1. Most of the genome is un-methylated
Averaged across the mussels, only about 11–12% of CpG sites carry a methyl tag. Human DNA, by comparison, is methylated at most of its CpG sites. Low, sparse methylation is the normal state for invertebrates like mussels and oysters.
2. It’s an on-or-off, “mosaic” pattern
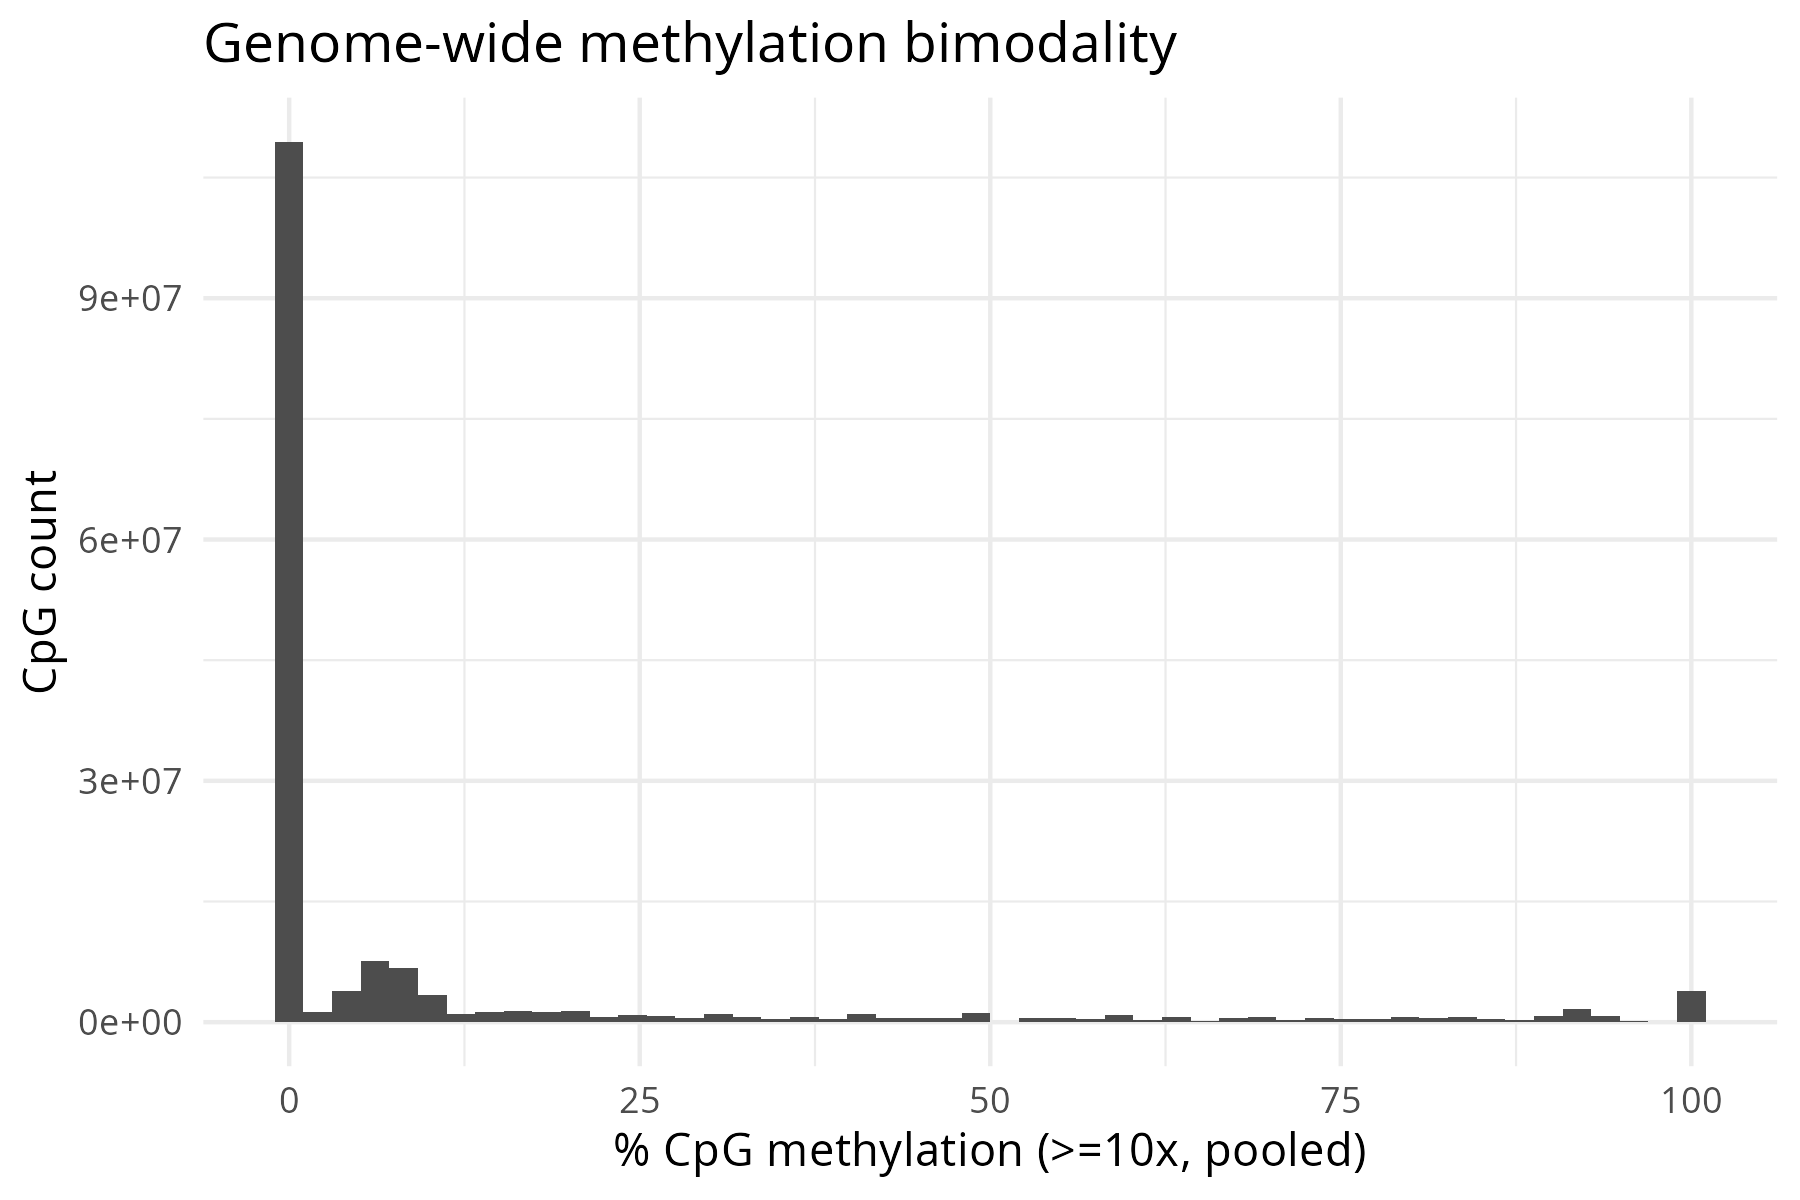
Methylation in mussels isn’t a smooth dial — it’s more like a light switch. Sites tend to be either almost fully off or almost fully on, with relatively few in between:
| Methylation state | Share of sites |
|---|---|
| Off (unmethylated) | 80% |
| In-between | 10% |
| On (methylated) | 10% |
3. Methylation lives inside genes, not around them
Where the methyl tags do land is highly non-random. They’re concentrated in the bodies of genes and largely absent from the switch-like regions (promoters) and the empty stretches between genes:
| Part of the genome | Average methylation |
|---|---|
| Gene bodies (genes, exons, introns) | ~20% |
| Promoters (gene “on-switches”) | 7% |
| Between genes (intergenic) | 5% |
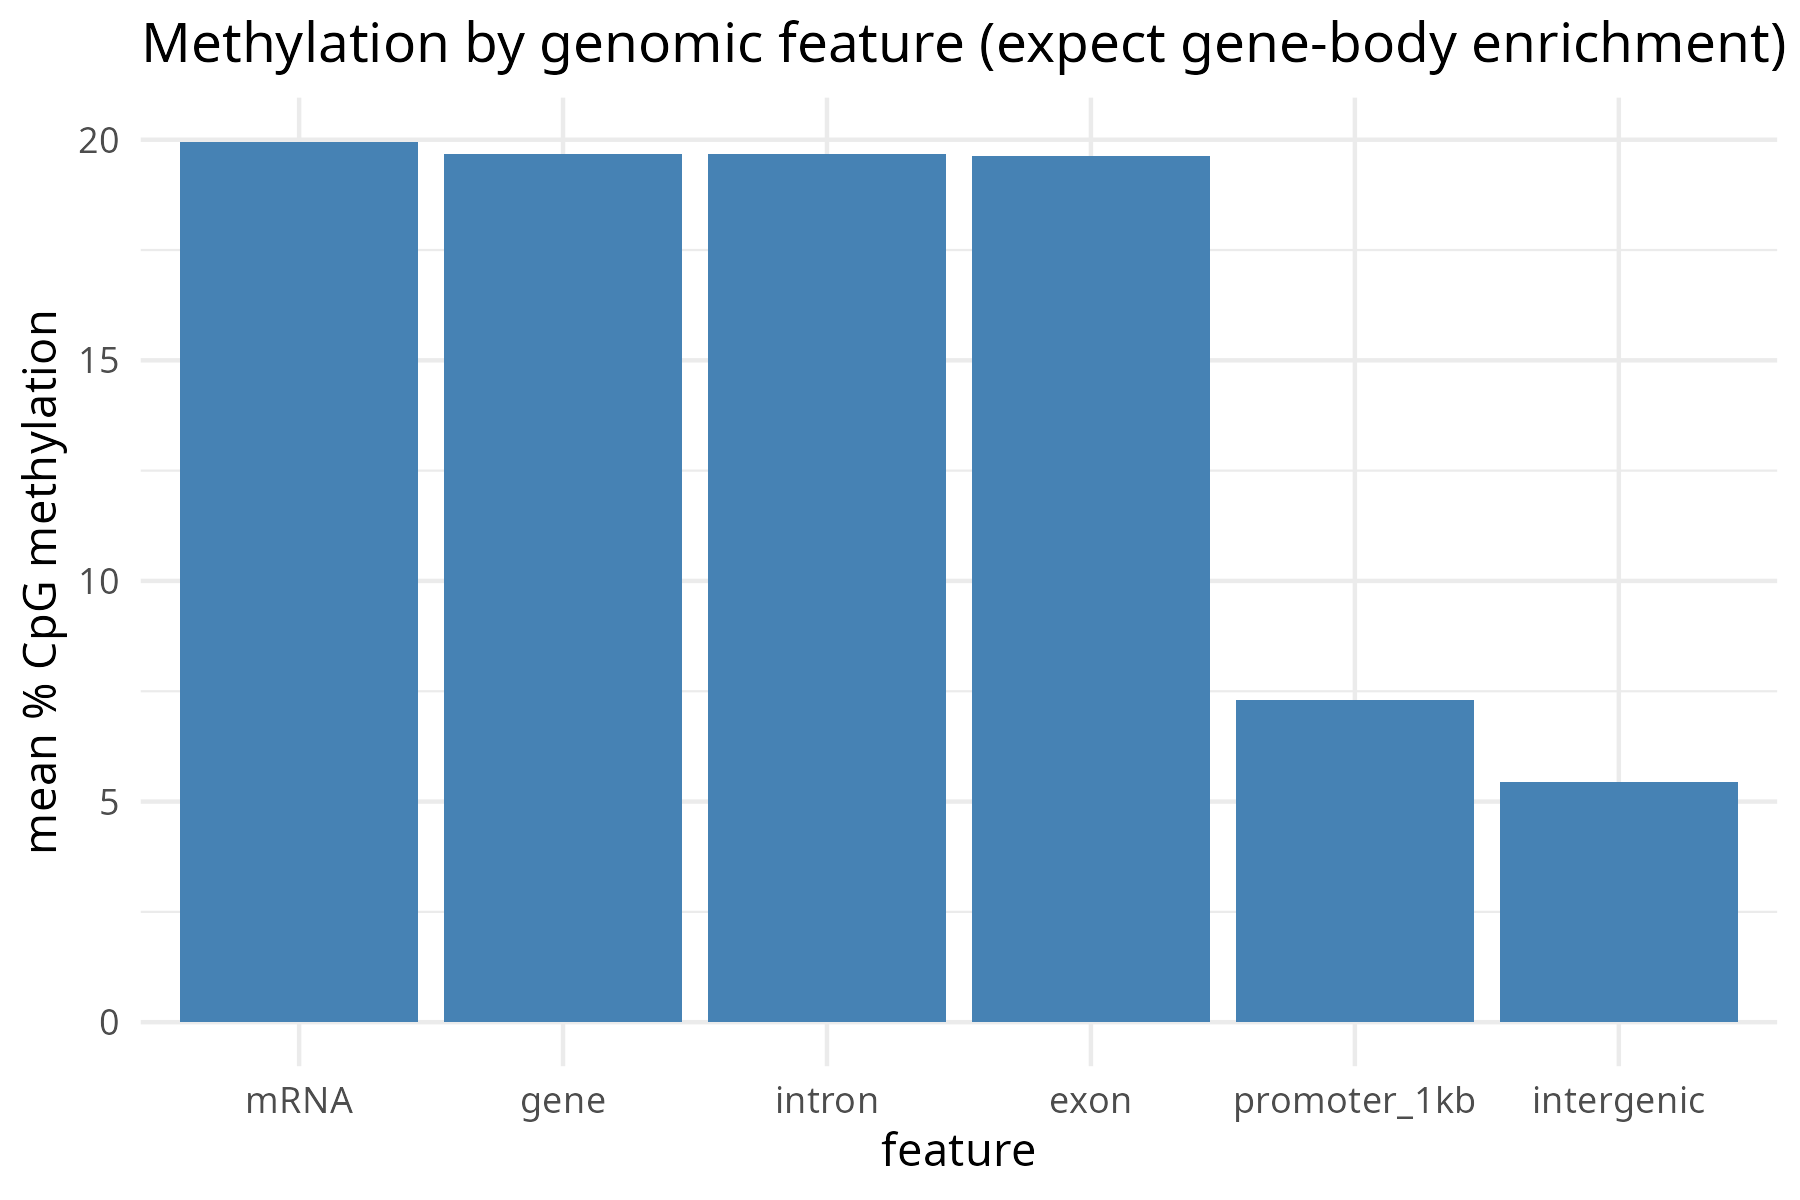
This “gene-body methylation” is the signature pattern of invertebrates, and it’s thought to mark the steady, housekeeping genes a cell relies on all the time.
4. The genome itself remembers where methylation has been
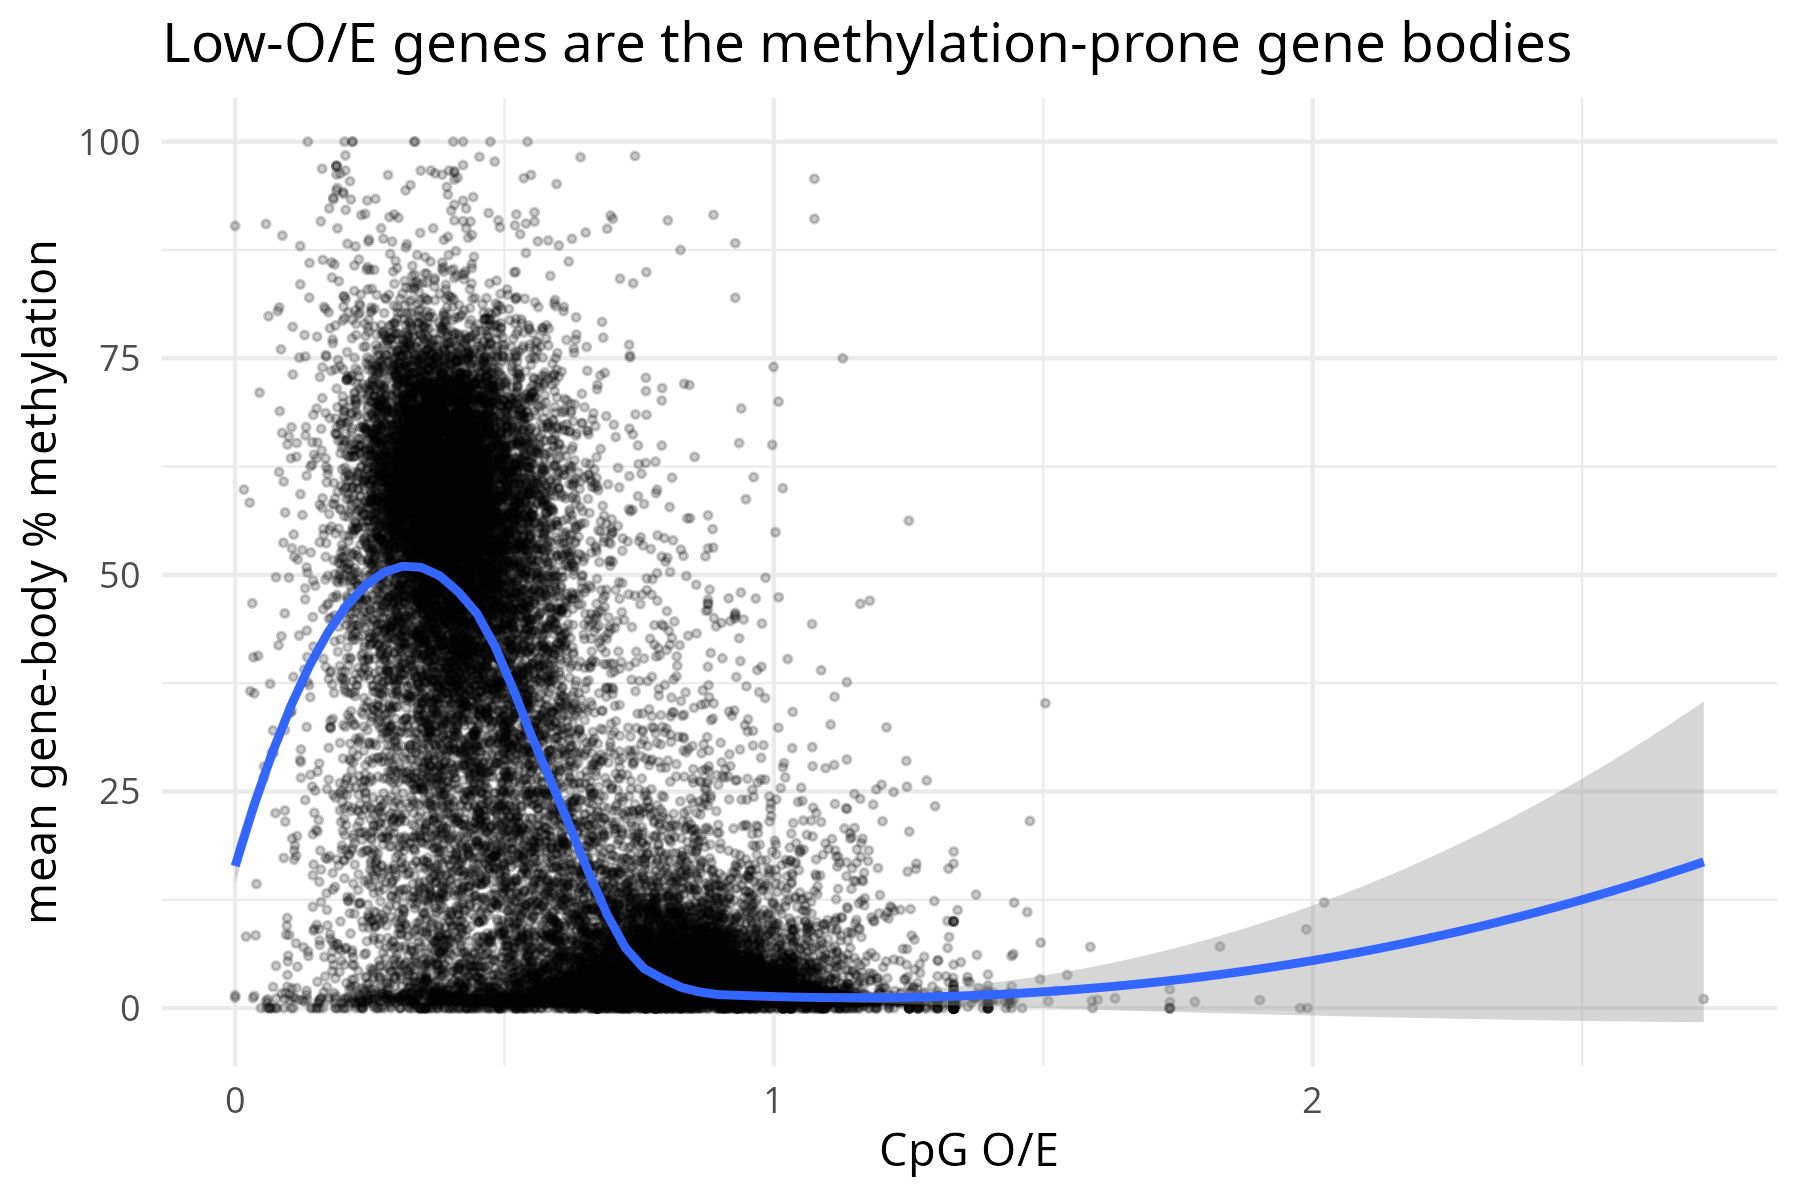
There’s an elegant twist here. Methylation is chemically corrosive to DNA over evolutionary time — spots that have been methylated for millions of years slowly lose their CpG sites. So we can measure how “CpG-depleted” each gene is and use that as a fossil record of its long-term methylation history.
Sure enough, mussel genes fall into two camps — one CpG-rich, one CpG-depleted — and the CpG-depleted genes are exactly the ones we observe to be heavily methylated today (a strong negative relationship, correlation ≈ −0.68). The genome’s ancient history and its present-day chemistry tell the same story.
And about that “outlier”…
Now that 93M was fully processed, we could finally check whether it deserved its bad reputation. It didn’t. Ranked against all 24 mussels by overall methylation, 93M came in 14th — dead center of the pack. Its recovered data is normal in every way that matters. Its earlier exclusion was a processing gap, not a quality problem.
The bottom line
- A mussel thought to be a low-quality dropout was actually just never finished processing; it has now been fully recovered and looks completely normal.
- Across all 24 Puget Sound mussels, DNA methylation is low and sparse (~12%), organized as an on/off mosaic, and concentrated inside genes — the textbook pattern for shellfish.
- The genome’s own CpG-depletion “fossil record” lines up with the methylation we measure today.
This is the descriptive baseline. The next chapter asks the question that started it all: do the mussels from polluted sites carry methylation differences from the clean-site mussels — and could any of those differences serve as a practical pollution biomarker? That comparison is where we head next.
Technical note: this landscape was produced with methylKit and BEDTools from merged-CpG coverage files; scripts and full results are in code/26–code/29 and output/26–output/29 of the project repository. The 93M recovery pipeline is code/25.1-93M-cov-recovery.sh.