35- DML gene-model figure (Table 2)
================
Steven Roberts
11 June, 2026
 - [1 Overview](#1-overview)
- [2 Download the NCBI GFF
annotation](#2-download-the-ncbi-gff-annotation)
- [3 Parse gene models](#3-parse-gene-models)
- [4 DML set (Table 2) and coordinate
verification](#4-dml-set-table-2-and-coordinate-verification)
- [5 Build the figure](#5-build-the-figure)
- [6 Summary table](#6-summary-table)
- [7 Session info](#7-session-info)
------------------------------------------------------------------------
# 1 Overview
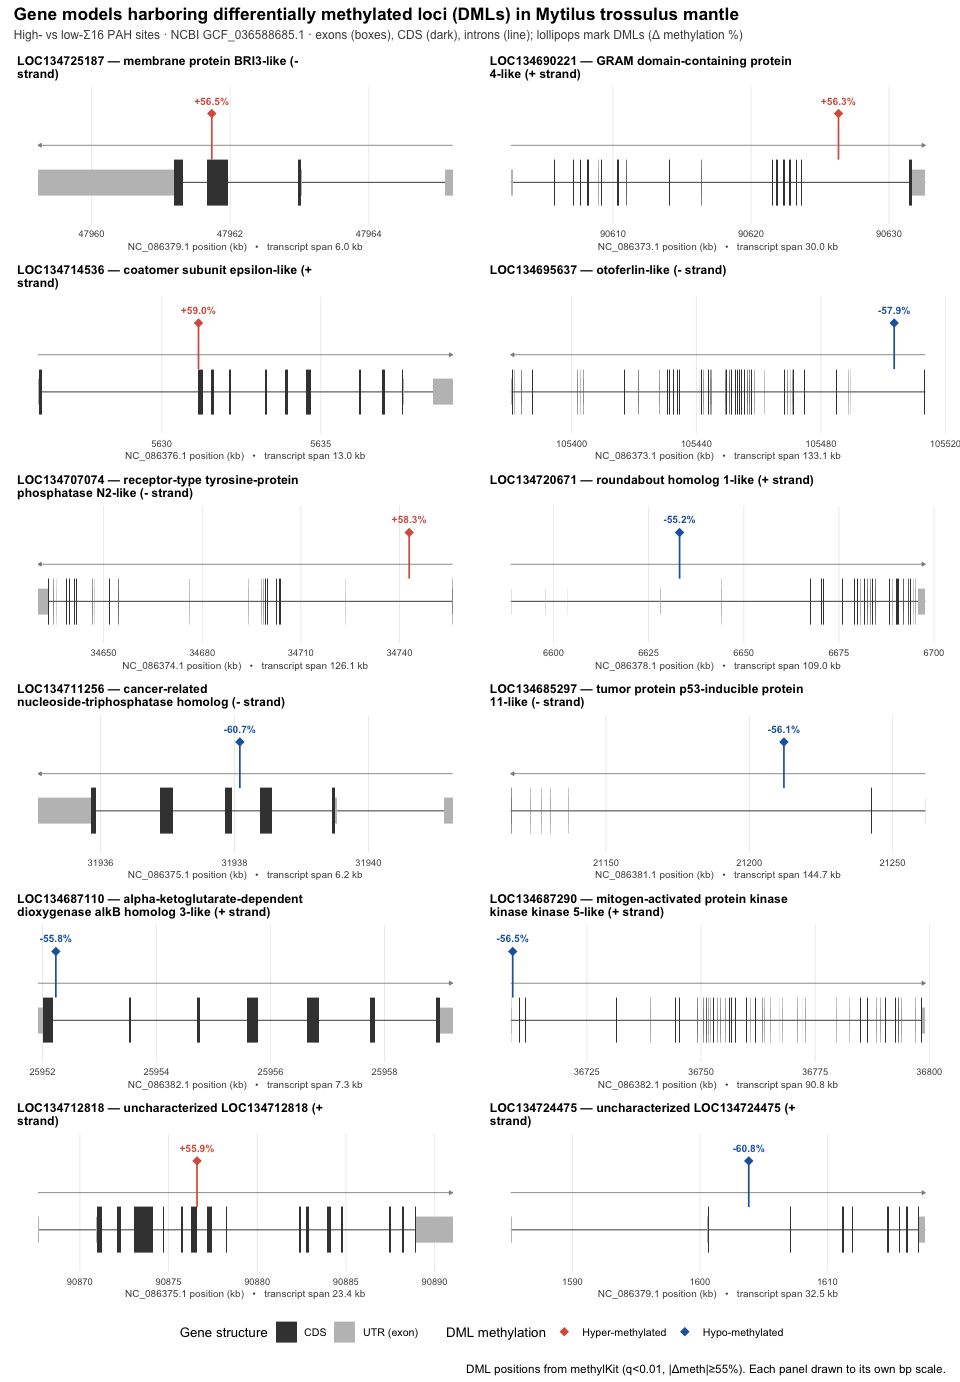
Publication-quality, multi-panel figure of the **10 annotated gene
models** that harbor the 12 differentially methylated loci (DMLs)
reported in `paper.md` Table 2, with each DML denoted on its gene model.
Companion to `30-dml-dmr-methylkit.Rmd` and `31-dml-dmr-annotation.Rmd`.
- DML headline set: `../output/11-methylkit-klone/myDiff_1055p.tab`
(methylKit, q<0.01, \|meth.diff\|>=55%; positions are 1-based
CpG coordinates)
- Reference: NCBI **GCF\_036588685.1** (PNRI\_Mtr1.1.1.hap1)
- Annotation: downloaded NCBI GFF (this script)
- Output dir: `../output/35-dml-gene-model-figure/`
`rtracklayer`/`GenomicFeatures` are not installed in this environment,
so the GFF is parsed directly with `data.table`/`awk`.
``` bash
mkdir -p ../output/35-dml-gene-model-figure
```
# 2 Download the NCBI GFF annotation
Downloads `GCF_036588685.1_..._genomic.gff` from the NCBI FTP if not
already present, then carves out the lines for the 10 genes of interest
so the rest of the script stays fast and reproducible.
``` bash
out="../output/35-dml-gene-model-figure"
gff="$out/genomic.gff"
if [ ! -s "$gff" ]; then
url="https://ftp.ncbi.nlm.nih.gov/genomes/all/GCF/036/588/685/GCF_036588685.1_PNRI_Mtr1.1.1.hap1/GCF_036588685.1_PNRI_Mtr1.1.1.hap1_genomic.gff.gz"
curl -sS -L -o "$gff.gz" "$url"
gunzip -f "$gff.gz"
fi
ls -la "$gff"
```
## -rw-r--r--@ 1 sr320 staff 331324929 Jun 11 06:52 ../output/35-dml-gene-model-figure/genomic.gff
``` bash
out="../output/35-dml-gene-model-figure"
awk -F'\t' '
BEGIN{ s="LOC134725187 LOC134690221 LOC134714536 LOC134695637 LOC134707074 LOC134720671 LOC134711256 LOC134685297 LOC134712818 LOC134724475 LOC134687110 LOC134687290";
n=split(s,g," "); for(i=1;i<=n;i++) want[g[i]]=1 }
/^#/{next}
{ if(match($9,/gene=[^;]+/)){ gname=substr($9,RSTART+5,RLENGTH-5); if(gname in want) print } }
' "$out/genomic.gff" > "$out/gene_models_raw.gff"
echo "feature lines: $(wc -l < "$out/gene_models_raw.gff")"
cut -f3 "$out/gene_models_raw.gff" | sort | uniq -c
```
## feature lines: 1269
## 596 CDS
## 624 exon
## 12 gene
## 37 mRNA
# 3 Parse gene models
``` r
library(data.table)
library(dplyr)
library(ggplot2)
library(patchwork)
out_dir <- "../output/35-dml-gene-model-figure"
raw <- fread(file.path(out_dir, "gene_models_raw.gff"), sep = "\t", header = FALSE,
quote = "", col.names = c("chr","src","type","start","end",
"score","strand","frame","attr"))
get_attr <- function(attr, key) {
out <- rep(NA_character_, length(attr))
m <- regexpr(paste0(key, "=[^;]+"), attr)
hit <- m > 0
out[hit] <- sub(paste0(key, "="), "", regmatches(attr, m))
out
}
raw[, gene := get_attr(attr, "gene")]
raw[, ID := get_attr(attr, "ID")]
raw[, Parent := get_attr(attr, "Parent")]
raw[, product := get_attr(attr, "product")]
raw[, description := get_attr(attr, "description")]
genes <- raw[type == "gene",
.(gene, chr, start, end, strand,
gene_desc = description, gene_id_full = ID)]
mrna <- raw[type == "mRNA",
.(gene, tx = ID, chr, start, end, strand, product)]
# exon / CDS counts per transcript to help pick the primary isoform
exon_counts <- raw[type == "exon", .N, by = .(tx = Parent)]
setnames(exon_counts, "N", "n_exon")
mrna <- merge(mrna, exon_counts, by = "tx", all.x = TRUE)
mrna[, span := end - start]
# Primary transcript = longest genomic span, tie-break by most exons, then ID
setorder(mrna, gene, -span, -n_exon, tx)
primary <- mrna[, .SD[1], by = gene]
primary[]
```
## gene tx chr start end strand
##
## 1: LOC134685297 rna-XM_063544925.1 NC_086381.1 21116727 21261455 -
## 2: LOC134687110 rna-XM_063547109.1 NC_086382.1 25951921 25959192 +
## 3: LOC134687290 rna-XM_063547445.1 NC_086382.1 36708321 36799106 +
## 4: LOC134690221 rna-XM_063550200.1 NC_086373.1 90602585 90632630 +
## 5: LOC134695637 rna-XM_063556955.1 NC_086373.1 105380391 105513502 -
## 6: LOC134707074 rna-XM_063566562.1 NC_086374.1 34630047 34756161 -
## 7: LOC134711256 rna-XM_063571761.1 NC_086375.1 31935064 31941257 -
## 8: LOC134712818 rna-XM_063574731.1 NC_086375.1 90867638 90891015 +
## 9: LOC134714536 rna-XM_063575859.1 NC_086376.1 5626113 5639140 +
## 10: LOC134720671 rna-XM_063583078.1 NC_086378.1 6588729 6697712 +
## 11: LOC134724475 rna-XM_063587507.1 NC_086379.1 1585149 1617685 +
## 12: LOC134725187 rna-XM_063588806.1 NC_086379.1 47959226 47965210 -
## product
##
## 1: tumor protein p53-inducible protein 11-like%2C transcript variant X4
## 2: alpha-ketoglutarate-dependent dioxygenase alkB homolog 3-like
## 3: mitogen-activated protein kinase kinase kinase 5-like
## 4: GRAM domain-containing protein 4-like
## 5: otoferlin-like%2C transcript variant X1
## 6: receptor-type tyrosine-protein phosphatase N2-like%2C transcript variant X1
## 7: cancer-related nucleoside-triphosphatase homolog%2C transcript variant X1
## 8: uncharacterized LOC134712818
## 9: coatomer subunit epsilon-like
## 10: roundabout homolog 1-like%2C transcript variant X2
## 11: uncharacterized LOC134724475%2C transcript variant X1
## 12: membrane protein BRI3-like
## n_exon span
##
## 1: 7 144728
## 2: 7 7271
## 3: 42 90785
## 4: 18 30045
## 5: 45 133111
## 6: 21 126114
## 7: 6 6193
## 8: 16 23377
## 9: 11 13027
## 10: 26 108983
## 11: 9 32536
## 12: 4 5984
``` r
prim_tx <- primary$tx
exons <- raw[type == "exon" & Parent %in% prim_tx,
.(gene, tx = Parent, start, end, strand)]
cds <- raw[type == "CDS" & Parent %in% prim_tx,
.(gene, tx = Parent, start, end, strand)]
# attach gene to features via primary transcript map
tx2gene <- setNames(primary$gene, primary$tx)
exons[, gene := tx2gene[tx]]
cds[, gene := tx2gene[tx]]
cat("exons per primary transcript:\n"); print(exons[, .N, by = gene])
```
## exons per primary transcript:
## gene N
##
## 1: LOC134690221 18
## 2: LOC134695637 45
## 3: LOC134707074 21
## 4: LOC134711256 6
## 5: LOC134712818 16
## 6: LOC134714536 11
## 7: LOC134720671 26
## 8: LOC134724475 9
## 9: LOC134725187 4
## 10: LOC134685297 7
## 11: LOC134687110 7
## 12: LOC134687290 42
# 4 DML set (Table 2) and coordinate verification
The 12 DMLs of Table 2 are pulled from `myDiff_1055p.tab` by matching
q-values, then each is checked for containment within its assigned gene
span.
``` r
# Corrected genic DML set: 12 DMLs, each inside a unique gene (see
# 35a-dml-assignment-audit.R). The two intergenic loci previously assigned to
# LOC134725187 / LOC134711256 are dropped, and the two genic loci on
# NC_086382.1 (LOC134687110 alkB, LOC134687290 MAP3K5/ASK1) are added.
dml <- data.table(
qvalue = c(5.77e-14, 1.16e-11, 2.92e-13, 4.17e-14, 1.10e-13,
7.20e-13, 8.98e-18, 1.06e-12, 1.32e-13, 2.52e-16,
6.02e-14, 5.83e-13),
chr = c("NC_086379.1","NC_086373.1","NC_086376.1","NC_086373.1","NC_086374.1",
"NC_086378.1","NC_086375.1","NC_086381.1","NC_086375.1","NC_086379.1",
"NC_086382.1","NC_086382.1"),
pos = c(47961734, 90626338, 5631156, 105503509, 34742951,
6633121, 31938079, 21212100, 90876604, 1603830,
25952234, 36708761),
assigned_gene= c("LOC134725187","LOC134690221","LOC134714536","LOC134695637","LOC134707074",
"LOC134720671","LOC134711256","LOC134685297","LOC134712818","LOC134724475",
"LOC134687110","LOC134687290"),
meth_diff = c(56.45, 56.32, 59, -57.86, 58.27,
-55.24, -60.69, -56.07, 55.88, -60.82,
-55.83, -56.50),
status_paper = c("Hyper","Hyper","Hyper","Hypo","Hyper",
"Hypo","Hypo","Hypo","Hyper","Hypo",
"Hypo","Hypo")
)
# direction from the sign of meth.diff (hyper = +, hypo = -)
dml[, direction := factor(ifelse(meth_diff >= 0, "Hyper-methylated", "Hypo-methylated"),
levels = c("Hyper-methylated", "Hypo-methylated"))]
# verify each DML against its assigned gene span
gspan <- genes[, .(assigned_gene = gene, g_chr = chr, g_start = start,
g_end = end, g_strand = strand, gene_desc)]
dml <- merge(dml, gspan, by = "assigned_gene", all.x = TRUE, sort = FALSE)
dml[, in_gene_span := (chr == g_chr & pos >= g_start & pos <= g_end)]
dml[, .(assigned_gene, chr, pos, meth_diff, direction, status_paper,
g_start, g_end, in_gene_span)][order(assigned_gene, pos)]
```
## assigned_gene chr pos meth_diff direction status_paper
##
## 1: LOC134685297 NC_086381.1 21212100 -56.07 Hypo-methylated Hypo
## 2: LOC134687110 NC_086382.1 25952234 -55.83 Hypo-methylated Hypo
## 3: LOC134687290 NC_086382.1 36708761 -56.50 Hypo-methylated Hypo
## 4: LOC134690221 NC_086373.1 90626338 56.32 Hyper-methylated Hyper
## 5: LOC134695637 NC_086373.1 105503509 -57.86 Hypo-methylated Hypo
## 6: LOC134707074 NC_086374.1 34742951 58.27 Hyper-methylated Hyper
## 7: LOC134711256 NC_086375.1 31938079 -60.69 Hypo-methylated Hypo
## 8: LOC134712818 NC_086375.1 90876604 55.88 Hyper-methylated Hyper
## 9: LOC134714536 NC_086376.1 5631156 59.00 Hyper-methylated Hyper
## 10: LOC134720671 NC_086378.1 6633121 -55.24 Hypo-methylated Hypo
## 11: LOC134724475 NC_086379.1 1603830 -60.82 Hypo-methylated Hypo
## 12: LOC134725187 NC_086379.1 47961734 56.45 Hyper-methylated Hyper
## g_start g_end in_gene_span
##
## 1: 21116727 21261455 TRUE
## 2: 25951921 25959192 TRUE
## 3: 36708321 36799106 TRUE
## 4: 90602585 90632630 TRUE
## 5: 105380391 105513502 TRUE
## 6: 34630047 34756161 TRUE
## 7: 31935064 31941257 TRUE
## 8: 90867638 90891015 TRUE
## 9: 5626113 5639140 TRUE
## 10: 6588729 6697712 TRUE
## 11: 1585149 1617687 TRUE
## 12: 47959226 47965210 TRUE
``` r
cat("DMLs inside their assigned gene span:", sum(dml$in_gene_span), "of", nrow(dml), "\n\n")
```
## DMLs inside their assigned gene span: 12 of 12
``` r
cat("DMLs NOT inside assigned gene span:\n")
```
## DMLs NOT inside assigned gene span:
``` r
print(dml[in_gene_span == FALSE, .(assigned_gene, chr, pos, meth_diff)])
```
## Empty data.table (0 rows and 4 cols): assigned_gene,chr,pos,meth_diff
**Note.** This is the **corrected** DML set (see
`35a-dml-assignment-audit.R`). All 12 DMLs fall cleanly inside a unique
gene body — i.e. 12 DMLs across 12 genes, none bidirectional. An earlier
version of the manuscript Table 2 assigned two intergenic loci
(`NC_086379.1:64017640` and `NC_086375.1:43581688`, \~16 Mb / \~11 Mb
from their listed genes) to LOC134725187 and LOC134711256, making them
appear bidirectional, while omitting two genuinely genic loci on
NC\_086382.1 (LOC134687110 *alkB homolog 3-like* and LOC134687290
*MAP3K5 / ASK1-like*). The intergenic loci are dropped here and the two
genic loci added.
# 5 Build the figure
``` r
# warm = hyper, cool = hypo
dml_cols <- c("Hyper-methylated" = "#D6604D", "Hypo-methylated" = "#2166AC")
feat_cols <- c("CDS" = "grey25", "UTR (exon)" = "grey75")
short_name <- function(desc) {
desc <- sub(", transcript variant.*$", "", desc)
desc
}
build_panel <- function(gid) {
g <- genes[gene == gid]
tx <- primary[gene == gid]
ex <- exons[gene == gid]
cd <- cds[gene == gid]
dd <- dml[assigned_gene == gid & in_gene_span == TRUE]
# plot coordinates in kb (absolute genomic position)
x0 <- tx$start / 1e3
x1 <- tx$end / 1e3
ymax_dml <- 1.15
# invisible layer carrying both DML levels so every panel yields an
# identical colour guide (patchwork then collapses it to one legend)
dummy <- data.frame(
direction = factor(c("Hyper-methylated", "Hypo-methylated"),
levels = c("Hyper-methylated", "Hypo-methylated")),
x = x0, y = 0)
p <- ggplot() +
# intron line spanning the primary transcript
geom_segment(aes(x = x0, xend = x1, y = 0, yend = 0),
linewidth = 0.4, colour = "grey40") +
geom_point(data = dummy, aes(x = x, y = y, colour = direction),
alpha = 0, shape = 18, size = 3) +
# exon boxes (UTR height)
geom_rect(data = ex,
aes(xmin = start/1e3, xmax = end/1e3, ymin = -0.22, ymax = 0.22,
fill = "UTR (exon)"), colour = NA) +
# CDS boxes (full height, drawn over exons)
geom_rect(data = cd,
aes(xmin = start/1e3, xmax = end/1e3, ymin = -0.38, ymax = 0.38,
fill = "CDS"), colour = NA)
# strand direction arrow above the model
arr_y <- 0.62
if (tx$strand == "+") {
p <- p + annotate("segment", x = x0, xend = x1, y = arr_y, yend = arr_y,
colour = "grey55", linewidth = 0.3,
arrow = arrow(length = unit(0.10, "cm"), type = "closed"))
} else {
p <- p + annotate("segment", x = x1, xend = x0, y = arr_y, yend = arr_y,
colour = "grey55", linewidth = 0.3,
arrow = arrow(length = unit(0.10, "cm"), type = "closed"))
}
# DML lollipops
if (nrow(dd) > 0) {
p <- p +
geom_segment(data = dd,
aes(x = pos/1e3, xend = pos/1e3, y = 0.38, yend = ymax_dml,
colour = direction), linewidth = 0.6, show.legend = FALSE) +
geom_point(data = dd,
aes(x = pos/1e3, y = ymax_dml, colour = direction),
size = 3, shape = 18, show.legend = FALSE) +
geom_text(data = dd,
aes(x = pos/1e3, y = ymax_dml + 0.22,
label = sprintf("%+.1f%%", meth_diff), colour = direction),
size = 2.7, fontface = "bold", show.legend = FALSE)
}
lab <- sprintf("%s \u2014 %s (%s strand)",
gid, short_name(g$gene_desc), tx$strand)
# wrap long titles so adjacent column panels don't collide
lab <- paste(strwrap(lab, width = 52), collapse = "\n")
span_kb <- (tx$end - tx$start) / 1e3
p +
scale_fill_manual(values = feat_cols, name = "Gene structure",
breaks = c("CDS","UTR (exon)")) +
scale_colour_manual(values = dml_cols, name = "DML methylation",
drop = FALSE) +
guides(colour = guide_legend(
override.aes = list(alpha = 1, shape = 18, size = 3, linetype = 0))) +
scale_y_continuous(limits = c(-0.7, ymax_dml + 0.45), expand = c(0,0)) +
labs(title = lab,
x = sprintf("%s position (kb) \u2022 transcript span %.1f kb",
g$chr, span_kb)) +
theme_minimal(base_size = 10) +
theme(
plot.title = element_text(size = 9.2, face = "bold"),
axis.title.x = element_text(size = 7.5, colour = "grey30"),
axis.text.x = element_text(size = 7),
axis.title.y = element_blank(),
axis.text.y = element_blank(),
panel.grid.major.y = element_blank(),
panel.grid.minor = element_blank(),
panel.grid.major.x = element_line(colour = "grey92", linewidth = 0.3),
legend.position = "bottom"
)
}
```
``` r
# order panels by paper functional grouping
gene_order <- c(
# Membrane dynamics and vesicle trafficking
"LOC134725187","LOC134690221","LOC134714536","LOC134695637",
# Cell signaling and regulation
"LOC134707074","LOC134720671",
# Stress response, apoptosis, and nucleic acid metabolism
"LOC134711256","LOC134685297","LOC134687110","LOC134687290",
# Uncharacterized
"LOC134712818","LOC134724475")
panels <- lapply(gene_order, build_panel)
fig <- wrap_plots(panels, ncol = 2) +
plot_layout(guides = "collect") +
plot_annotation(
title = "Gene models harboring differentially methylated loci (DMLs) in Mytilus trossulus mantle",
subtitle = "High- vs low-\u03a316 PAH sites \u00b7 NCBI GCF_036588685.1 \u00b7 exons (boxes), CDS (dark), introns (line); lollipops mark DMLs (\u0394 methylation %)",
caption = "DML positions from methylKit (q<0.01, |\u0394meth|\u226555%). Each panel drawn to its own bp scale.",
theme = theme(plot.title = element_text(face = "bold", size = 13),
plot.subtitle = element_text(size = 9, colour = "grey30"))
) &
theme(legend.position = "bottom")
ggsave(file.path(out_dir, "dml_gene_models.png"), fig,
width = 10, height = 14.4, dpi = 300, bg = "white")
ggsave(file.path(out_dir, "dml_gene_models.pdf"), fig,
width = 10, height = 14.4, bg = "white")
fig
```
- [1 Overview](#1-overview)
- [2 Download the NCBI GFF
annotation](#2-download-the-ncbi-gff-annotation)
- [3 Parse gene models](#3-parse-gene-models)
- [4 DML set (Table 2) and coordinate
verification](#4-dml-set-table-2-and-coordinate-verification)
- [5 Build the figure](#5-build-the-figure)
- [6 Summary table](#6-summary-table)
- [7 Session info](#7-session-info)
------------------------------------------------------------------------
# 1 Overview
Publication-quality, multi-panel figure of the **10 annotated gene
models** that harbor the 12 differentially methylated loci (DMLs)
reported in `paper.md` Table 2, with each DML denoted on its gene model.
Companion to `30-dml-dmr-methylkit.Rmd` and `31-dml-dmr-annotation.Rmd`.
- DML headline set: `../output/11-methylkit-klone/myDiff_1055p.tab`
(methylKit, q<0.01, \|meth.diff\|>=55%; positions are 1-based
CpG coordinates)
- Reference: NCBI **GCF\_036588685.1** (PNRI\_Mtr1.1.1.hap1)
- Annotation: downloaded NCBI GFF (this script)
- Output dir: `../output/35-dml-gene-model-figure/`
`rtracklayer`/`GenomicFeatures` are not installed in this environment,
so the GFF is parsed directly with `data.table`/`awk`.
``` bash
mkdir -p ../output/35-dml-gene-model-figure
```
# 2 Download the NCBI GFF annotation
Downloads `GCF_036588685.1_..._genomic.gff` from the NCBI FTP if not
already present, then carves out the lines for the 10 genes of interest
so the rest of the script stays fast and reproducible.
``` bash
out="../output/35-dml-gene-model-figure"
gff="$out/genomic.gff"
if [ ! -s "$gff" ]; then
url="https://ftp.ncbi.nlm.nih.gov/genomes/all/GCF/036/588/685/GCF_036588685.1_PNRI_Mtr1.1.1.hap1/GCF_036588685.1_PNRI_Mtr1.1.1.hap1_genomic.gff.gz"
curl -sS -L -o "$gff.gz" "$url"
gunzip -f "$gff.gz"
fi
ls -la "$gff"
```
## -rw-r--r--@ 1 sr320 staff 331324929 Jun 11 06:52 ../output/35-dml-gene-model-figure/genomic.gff
``` bash
out="../output/35-dml-gene-model-figure"
awk -F'\t' '
BEGIN{ s="LOC134725187 LOC134690221 LOC134714536 LOC134695637 LOC134707074 LOC134720671 LOC134711256 LOC134685297 LOC134712818 LOC134724475 LOC134687110 LOC134687290";
n=split(s,g," "); for(i=1;i<=n;i++) want[g[i]]=1 }
/^#/{next}
{ if(match($9,/gene=[^;]+/)){ gname=substr($9,RSTART+5,RLENGTH-5); if(gname in want) print } }
' "$out/genomic.gff" > "$out/gene_models_raw.gff"
echo "feature lines: $(wc -l < "$out/gene_models_raw.gff")"
cut -f3 "$out/gene_models_raw.gff" | sort | uniq -c
```
## feature lines: 1269
## 596 CDS
## 624 exon
## 12 gene
## 37 mRNA
# 3 Parse gene models
``` r
library(data.table)
library(dplyr)
library(ggplot2)
library(patchwork)
out_dir <- "../output/35-dml-gene-model-figure"
raw <- fread(file.path(out_dir, "gene_models_raw.gff"), sep = "\t", header = FALSE,
quote = "", col.names = c("chr","src","type","start","end",
"score","strand","frame","attr"))
get_attr <- function(attr, key) {
out <- rep(NA_character_, length(attr))
m <- regexpr(paste0(key, "=[^;]+"), attr)
hit <- m > 0
out[hit] <- sub(paste0(key, "="), "", regmatches(attr, m))
out
}
raw[, gene := get_attr(attr, "gene")]
raw[, ID := get_attr(attr, "ID")]
raw[, Parent := get_attr(attr, "Parent")]
raw[, product := get_attr(attr, "product")]
raw[, description := get_attr(attr, "description")]
genes <- raw[type == "gene",
.(gene, chr, start, end, strand,
gene_desc = description, gene_id_full = ID)]
mrna <- raw[type == "mRNA",
.(gene, tx = ID, chr, start, end, strand, product)]
# exon / CDS counts per transcript to help pick the primary isoform
exon_counts <- raw[type == "exon", .N, by = .(tx = Parent)]
setnames(exon_counts, "N", "n_exon")
mrna <- merge(mrna, exon_counts, by = "tx", all.x = TRUE)
mrna[, span := end - start]
# Primary transcript = longest genomic span, tie-break by most exons, then ID
setorder(mrna, gene, -span, -n_exon, tx)
primary <- mrna[, .SD[1], by = gene]
primary[]
```
## gene tx chr start end strand
##
## 1: LOC134685297 rna-XM_063544925.1 NC_086381.1 21116727 21261455 -
## 2: LOC134687110 rna-XM_063547109.1 NC_086382.1 25951921 25959192 +
## 3: LOC134687290 rna-XM_063547445.1 NC_086382.1 36708321 36799106 +
## 4: LOC134690221 rna-XM_063550200.1 NC_086373.1 90602585 90632630 +
## 5: LOC134695637 rna-XM_063556955.1 NC_086373.1 105380391 105513502 -
## 6: LOC134707074 rna-XM_063566562.1 NC_086374.1 34630047 34756161 -
## 7: LOC134711256 rna-XM_063571761.1 NC_086375.1 31935064 31941257 -
## 8: LOC134712818 rna-XM_063574731.1 NC_086375.1 90867638 90891015 +
## 9: LOC134714536 rna-XM_063575859.1 NC_086376.1 5626113 5639140 +
## 10: LOC134720671 rna-XM_063583078.1 NC_086378.1 6588729 6697712 +
## 11: LOC134724475 rna-XM_063587507.1 NC_086379.1 1585149 1617685 +
## 12: LOC134725187 rna-XM_063588806.1 NC_086379.1 47959226 47965210 -
## product
##
## 1: tumor protein p53-inducible protein 11-like%2C transcript variant X4
## 2: alpha-ketoglutarate-dependent dioxygenase alkB homolog 3-like
## 3: mitogen-activated protein kinase kinase kinase 5-like
## 4: GRAM domain-containing protein 4-like
## 5: otoferlin-like%2C transcript variant X1
## 6: receptor-type tyrosine-protein phosphatase N2-like%2C transcript variant X1
## 7: cancer-related nucleoside-triphosphatase homolog%2C transcript variant X1
## 8: uncharacterized LOC134712818
## 9: coatomer subunit epsilon-like
## 10: roundabout homolog 1-like%2C transcript variant X2
## 11: uncharacterized LOC134724475%2C transcript variant X1
## 12: membrane protein BRI3-like
## n_exon span
##
## 1: 7 144728
## 2: 7 7271
## 3: 42 90785
## 4: 18 30045
## 5: 45 133111
## 6: 21 126114
## 7: 6 6193
## 8: 16 23377
## 9: 11 13027
## 10: 26 108983
## 11: 9 32536
## 12: 4 5984
``` r
prim_tx <- primary$tx
exons <- raw[type == "exon" & Parent %in% prim_tx,
.(gene, tx = Parent, start, end, strand)]
cds <- raw[type == "CDS" & Parent %in% prim_tx,
.(gene, tx = Parent, start, end, strand)]
# attach gene to features via primary transcript map
tx2gene <- setNames(primary$gene, primary$tx)
exons[, gene := tx2gene[tx]]
cds[, gene := tx2gene[tx]]
cat("exons per primary transcript:\n"); print(exons[, .N, by = gene])
```
## exons per primary transcript:
## gene N
##
## 1: LOC134690221 18
## 2: LOC134695637 45
## 3: LOC134707074 21
## 4: LOC134711256 6
## 5: LOC134712818 16
## 6: LOC134714536 11
## 7: LOC134720671 26
## 8: LOC134724475 9
## 9: LOC134725187 4
## 10: LOC134685297 7
## 11: LOC134687110 7
## 12: LOC134687290 42
# 4 DML set (Table 2) and coordinate verification
The 12 DMLs of Table 2 are pulled from `myDiff_1055p.tab` by matching
q-values, then each is checked for containment within its assigned gene
span.
``` r
# Corrected genic DML set: 12 DMLs, each inside a unique gene (see
# 35a-dml-assignment-audit.R). The two intergenic loci previously assigned to
# LOC134725187 / LOC134711256 are dropped, and the two genic loci on
# NC_086382.1 (LOC134687110 alkB, LOC134687290 MAP3K5/ASK1) are added.
dml <- data.table(
qvalue = c(5.77e-14, 1.16e-11, 2.92e-13, 4.17e-14, 1.10e-13,
7.20e-13, 8.98e-18, 1.06e-12, 1.32e-13, 2.52e-16,
6.02e-14, 5.83e-13),
chr = c("NC_086379.1","NC_086373.1","NC_086376.1","NC_086373.1","NC_086374.1",
"NC_086378.1","NC_086375.1","NC_086381.1","NC_086375.1","NC_086379.1",
"NC_086382.1","NC_086382.1"),
pos = c(47961734, 90626338, 5631156, 105503509, 34742951,
6633121, 31938079, 21212100, 90876604, 1603830,
25952234, 36708761),
assigned_gene= c("LOC134725187","LOC134690221","LOC134714536","LOC134695637","LOC134707074",
"LOC134720671","LOC134711256","LOC134685297","LOC134712818","LOC134724475",
"LOC134687110","LOC134687290"),
meth_diff = c(56.45, 56.32, 59, -57.86, 58.27,
-55.24, -60.69, -56.07, 55.88, -60.82,
-55.83, -56.50),
status_paper = c("Hyper","Hyper","Hyper","Hypo","Hyper",
"Hypo","Hypo","Hypo","Hyper","Hypo",
"Hypo","Hypo")
)
# direction from the sign of meth.diff (hyper = +, hypo = -)
dml[, direction := factor(ifelse(meth_diff >= 0, "Hyper-methylated", "Hypo-methylated"),
levels = c("Hyper-methylated", "Hypo-methylated"))]
# verify each DML against its assigned gene span
gspan <- genes[, .(assigned_gene = gene, g_chr = chr, g_start = start,
g_end = end, g_strand = strand, gene_desc)]
dml <- merge(dml, gspan, by = "assigned_gene", all.x = TRUE, sort = FALSE)
dml[, in_gene_span := (chr == g_chr & pos >= g_start & pos <= g_end)]
dml[, .(assigned_gene, chr, pos, meth_diff, direction, status_paper,
g_start, g_end, in_gene_span)][order(assigned_gene, pos)]
```
## assigned_gene chr pos meth_diff direction status_paper
##
## 1: LOC134685297 NC_086381.1 21212100 -56.07 Hypo-methylated Hypo
## 2: LOC134687110 NC_086382.1 25952234 -55.83 Hypo-methylated Hypo
## 3: LOC134687290 NC_086382.1 36708761 -56.50 Hypo-methylated Hypo
## 4: LOC134690221 NC_086373.1 90626338 56.32 Hyper-methylated Hyper
## 5: LOC134695637 NC_086373.1 105503509 -57.86 Hypo-methylated Hypo
## 6: LOC134707074 NC_086374.1 34742951 58.27 Hyper-methylated Hyper
## 7: LOC134711256 NC_086375.1 31938079 -60.69 Hypo-methylated Hypo
## 8: LOC134712818 NC_086375.1 90876604 55.88 Hyper-methylated Hyper
## 9: LOC134714536 NC_086376.1 5631156 59.00 Hyper-methylated Hyper
## 10: LOC134720671 NC_086378.1 6633121 -55.24 Hypo-methylated Hypo
## 11: LOC134724475 NC_086379.1 1603830 -60.82 Hypo-methylated Hypo
## 12: LOC134725187 NC_086379.1 47961734 56.45 Hyper-methylated Hyper
## g_start g_end in_gene_span
##
## 1: 21116727 21261455 TRUE
## 2: 25951921 25959192 TRUE
## 3: 36708321 36799106 TRUE
## 4: 90602585 90632630 TRUE
## 5: 105380391 105513502 TRUE
## 6: 34630047 34756161 TRUE
## 7: 31935064 31941257 TRUE
## 8: 90867638 90891015 TRUE
## 9: 5626113 5639140 TRUE
## 10: 6588729 6697712 TRUE
## 11: 1585149 1617687 TRUE
## 12: 47959226 47965210 TRUE
``` r
cat("DMLs inside their assigned gene span:", sum(dml$in_gene_span), "of", nrow(dml), "\n\n")
```
## DMLs inside their assigned gene span: 12 of 12
``` r
cat("DMLs NOT inside assigned gene span:\n")
```
## DMLs NOT inside assigned gene span:
``` r
print(dml[in_gene_span == FALSE, .(assigned_gene, chr, pos, meth_diff)])
```
## Empty data.table (0 rows and 4 cols): assigned_gene,chr,pos,meth_diff
**Note.** This is the **corrected** DML set (see
`35a-dml-assignment-audit.R`). All 12 DMLs fall cleanly inside a unique
gene body — i.e. 12 DMLs across 12 genes, none bidirectional. An earlier
version of the manuscript Table 2 assigned two intergenic loci
(`NC_086379.1:64017640` and `NC_086375.1:43581688`, \~16 Mb / \~11 Mb
from their listed genes) to LOC134725187 and LOC134711256, making them
appear bidirectional, while omitting two genuinely genic loci on
NC\_086382.1 (LOC134687110 *alkB homolog 3-like* and LOC134687290
*MAP3K5 / ASK1-like*). The intergenic loci are dropped here and the two
genic loci added.
# 5 Build the figure
``` r
# warm = hyper, cool = hypo
dml_cols <- c("Hyper-methylated" = "#D6604D", "Hypo-methylated" = "#2166AC")
feat_cols <- c("CDS" = "grey25", "UTR (exon)" = "grey75")
short_name <- function(desc) {
desc <- sub(", transcript variant.*$", "", desc)
desc
}
build_panel <- function(gid) {
g <- genes[gene == gid]
tx <- primary[gene == gid]
ex <- exons[gene == gid]
cd <- cds[gene == gid]
dd <- dml[assigned_gene == gid & in_gene_span == TRUE]
# plot coordinates in kb (absolute genomic position)
x0 <- tx$start / 1e3
x1 <- tx$end / 1e3
ymax_dml <- 1.15
# invisible layer carrying both DML levels so every panel yields an
# identical colour guide (patchwork then collapses it to one legend)
dummy <- data.frame(
direction = factor(c("Hyper-methylated", "Hypo-methylated"),
levels = c("Hyper-methylated", "Hypo-methylated")),
x = x0, y = 0)
p <- ggplot() +
# intron line spanning the primary transcript
geom_segment(aes(x = x0, xend = x1, y = 0, yend = 0),
linewidth = 0.4, colour = "grey40") +
geom_point(data = dummy, aes(x = x, y = y, colour = direction),
alpha = 0, shape = 18, size = 3) +
# exon boxes (UTR height)
geom_rect(data = ex,
aes(xmin = start/1e3, xmax = end/1e3, ymin = -0.22, ymax = 0.22,
fill = "UTR (exon)"), colour = NA) +
# CDS boxes (full height, drawn over exons)
geom_rect(data = cd,
aes(xmin = start/1e3, xmax = end/1e3, ymin = -0.38, ymax = 0.38,
fill = "CDS"), colour = NA)
# strand direction arrow above the model
arr_y <- 0.62
if (tx$strand == "+") {
p <- p + annotate("segment", x = x0, xend = x1, y = arr_y, yend = arr_y,
colour = "grey55", linewidth = 0.3,
arrow = arrow(length = unit(0.10, "cm"), type = "closed"))
} else {
p <- p + annotate("segment", x = x1, xend = x0, y = arr_y, yend = arr_y,
colour = "grey55", linewidth = 0.3,
arrow = arrow(length = unit(0.10, "cm"), type = "closed"))
}
# DML lollipops
if (nrow(dd) > 0) {
p <- p +
geom_segment(data = dd,
aes(x = pos/1e3, xend = pos/1e3, y = 0.38, yend = ymax_dml,
colour = direction), linewidth = 0.6, show.legend = FALSE) +
geom_point(data = dd,
aes(x = pos/1e3, y = ymax_dml, colour = direction),
size = 3, shape = 18, show.legend = FALSE) +
geom_text(data = dd,
aes(x = pos/1e3, y = ymax_dml + 0.22,
label = sprintf("%+.1f%%", meth_diff), colour = direction),
size = 2.7, fontface = "bold", show.legend = FALSE)
}
lab <- sprintf("%s \u2014 %s (%s strand)",
gid, short_name(g$gene_desc), tx$strand)
# wrap long titles so adjacent column panels don't collide
lab <- paste(strwrap(lab, width = 52), collapse = "\n")
span_kb <- (tx$end - tx$start) / 1e3
p +
scale_fill_manual(values = feat_cols, name = "Gene structure",
breaks = c("CDS","UTR (exon)")) +
scale_colour_manual(values = dml_cols, name = "DML methylation",
drop = FALSE) +
guides(colour = guide_legend(
override.aes = list(alpha = 1, shape = 18, size = 3, linetype = 0))) +
scale_y_continuous(limits = c(-0.7, ymax_dml + 0.45), expand = c(0,0)) +
labs(title = lab,
x = sprintf("%s position (kb) \u2022 transcript span %.1f kb",
g$chr, span_kb)) +
theme_minimal(base_size = 10) +
theme(
plot.title = element_text(size = 9.2, face = "bold"),
axis.title.x = element_text(size = 7.5, colour = "grey30"),
axis.text.x = element_text(size = 7),
axis.title.y = element_blank(),
axis.text.y = element_blank(),
panel.grid.major.y = element_blank(),
panel.grid.minor = element_blank(),
panel.grid.major.x = element_line(colour = "grey92", linewidth = 0.3),
legend.position = "bottom"
)
}
```
``` r
# order panels by paper functional grouping
gene_order <- c(
# Membrane dynamics and vesicle trafficking
"LOC134725187","LOC134690221","LOC134714536","LOC134695637",
# Cell signaling and regulation
"LOC134707074","LOC134720671",
# Stress response, apoptosis, and nucleic acid metabolism
"LOC134711256","LOC134685297","LOC134687110","LOC134687290",
# Uncharacterized
"LOC134712818","LOC134724475")
panels <- lapply(gene_order, build_panel)
fig <- wrap_plots(panels, ncol = 2) +
plot_layout(guides = "collect") +
plot_annotation(
title = "Gene models harboring differentially methylated loci (DMLs) in Mytilus trossulus mantle",
subtitle = "High- vs low-\u03a316 PAH sites \u00b7 NCBI GCF_036588685.1 \u00b7 exons (boxes), CDS (dark), introns (line); lollipops mark DMLs (\u0394 methylation %)",
caption = "DML positions from methylKit (q<0.01, |\u0394meth|\u226555%). Each panel drawn to its own bp scale.",
theme = theme(plot.title = element_text(face = "bold", size = 13),
plot.subtitle = element_text(size = 9, colour = "grey30"))
) &
theme(legend.position = "bottom")
ggsave(file.path(out_dir, "dml_gene_models.png"), fig,
width = 10, height = 14.4, dpi = 300, bg = "white")
ggsave(file.path(out_dir, "dml_gene_models.pdf"), fig,
width = 10, height = 14.4, bg = "white")
fig
```
 # 6 Summary table
``` r
# nearest-gene context for the two intergenic loci (computed from the GFF)
nearest_note <- c(
"NC_086379.1:64017640" = "intergenic; nearest gene LOC134725550 (protein chibby homolog 1-like), ~3.7 kb",
"NC_086375.1:43581688" = "intergenic; nearest gene LOC134711544 (solute carrier family 40 member 1-like), ~1.0 kb"
)
n_exon_map <- exons[, .N, by = gene]
setnames(n_exon_map, "N", "exon_count")
summary_tab <- dml |>
merge(n_exon_map, by.x = "assigned_gene", by.y = "gene", all.x = TRUE, sort = FALSE) |>
merge(primary[, .(assigned_gene = gene, primary_tx = tx)], by = "assigned_gene",
all.x = TRUE, sort = FALSE)
summary_tab[, gene_span := paste0(g_start, "-", g_end)]
summary_tab[, locus := paste0(chr, ":", pos)]
summary_tab[, note := ifelse(in_gene_span, "DML within gene body",
nearest_note[locus])]
summary_out <- summary_tab[order(assigned_gene, pos),
.(gene_id = assigned_gene, gene_description = gene_desc, chr,
gene_span, strand = g_strand, primary_tx, exon_count,
dml_position = pos, qvalue, meth_diff, direction,
status_paper, in_gene_span, note)]
fwrite(summary_out, file.path(out_dir, "dml_gene_model_summary.tsv"), sep = "\t")
fwrite(summary_out, file.path(out_dir, "dml_gene_model_summary.csv"))
knitr::kable(summary_out)
```
| gene\_id | gene\_description | chr | gene\_span | strand | primary\_tx | exon\_count | dml\_position | qvalue | meth\_diff | direction | status\_paper | in\_gene\_span | note |
|:-------------|:--------------------------------------------------------------|:-------------|:--------------------|:-------|:--------------------|------------:|--------------:|-------:|-----------:|:-----------------|:--------------|:---------------|:---------------------|
| LOC134685297 | tumor protein p53-inducible protein 11-like | NC\_086381.1 | 21116727-21261455 | \- | rna-XM\_063544925.1 | 7 | 21212100 | 0 | -56.07 | Hypo-methylated | Hypo | TRUE | DML within gene body |
| LOC134687110 | alpha-ketoglutarate-dependent dioxygenase alkB homolog 3-like | NC\_086382.1 | 25951921-25959192 | \+ | rna-XM\_063547109.1 | 7 | 25952234 | 0 | -55.83 | Hypo-methylated | Hypo | TRUE | DML within gene body |
| LOC134687290 | mitogen-activated protein kinase kinase kinase 5-like | NC\_086382.1 | 36708321-36799106 | \+ | rna-XM\_063547445.1 | 42 | 36708761 | 0 | -56.50 | Hypo-methylated | Hypo | TRUE | DML within gene body |
| LOC134690221 | GRAM domain-containing protein 4-like | NC\_086373.1 | 90602585-90632630 | \+ | rna-XM\_063550200.1 | 18 | 90626338 | 0 | 56.32 | Hyper-methylated | Hyper | TRUE | DML within gene body |
| LOC134695637 | otoferlin-like | NC\_086373.1 | 105380391-105513502 | \- | rna-XM\_063556955.1 | 45 | 105503509 | 0 | -57.86 | Hypo-methylated | Hypo | TRUE | DML within gene body |
| LOC134707074 | receptor-type tyrosine-protein phosphatase N2-like | NC\_086374.1 | 34630047-34756161 | \- | rna-XM\_063566562.1 | 21 | 34742951 | 0 | 58.27 | Hyper-methylated | Hyper | TRUE | DML within gene body |
| LOC134711256 | cancer-related nucleoside-triphosphatase homolog | NC\_086375.1 | 31935064-31941257 | \- | rna-XM\_063571761.1 | 6 | 31938079 | 0 | -60.69 | Hypo-methylated | Hypo | TRUE | DML within gene body |
| LOC134712818 | uncharacterized LOC134712818 | NC\_086375.1 | 90867638-90891015 | \+ | rna-XM\_063574731.1 | 16 | 90876604 | 0 | 55.88 | Hyper-methylated | Hyper | TRUE | DML within gene body |
| LOC134714536 | coatomer subunit epsilon-like | NC\_086376.1 | 5626113-5639140 | \+ | rna-XM\_063575859.1 | 11 | 5631156 | 0 | 59.00 | Hyper-methylated | Hyper | TRUE | DML within gene body |
| LOC134720671 | roundabout homolog 1-like | NC\_086378.1 | 6588729-6697712 | \+ | rna-XM\_063583078.1 | 26 | 6633121 | 0 | -55.24 | Hypo-methylated | Hypo | TRUE | DML within gene body |
| LOC134724475 | uncharacterized LOC134724475 | NC\_086379.1 | 1585149-1617687 | \+ | rna-XM\_063587507.1 | 9 | 1603830 | 0 | -60.82 | Hypo-methylated | Hypo | TRUE | DML within gene body |
| LOC134725187 | membrane protein BRI3-like | NC\_086379.1 | 47959226-47965210 | \- | rna-XM\_063588806.1 | 4 | 47961734 | 0 | 56.45 | Hyper-methylated | Hyper | TRUE | DML within gene body |
# 7 Session info
``` r
sessionInfo()
```
## R version 4.3.2 (2023-10-31)
## Platform: aarch64-apple-darwin20 (64-bit)
## Running under: macOS Sonoma 14.7.6
##
## Matrix products: default
## BLAS: /Library/Frameworks/R.framework/Versions/4.3-arm64/Resources/lib/libRblas.0.dylib
## LAPACK: /Library/Frameworks/R.framework/Versions/4.3-arm64/Resources/lib/libRlapack.dylib; LAPACK version 3.11.0
##
## locale:
## [1] C
##
## time zone: America/Los_Angeles
## tzcode source: internal
##
## attached base packages:
## [1] stats graphics grDevices utils datasets methods base
##
## other attached packages:
## [1] patchwork_1.3.1 ggplot2_3.5.1 dplyr_1.1.4 data.table_1.16.0
## [5] knitr_1.48
##
## loaded via a namespace (and not attached):
## [1] vctrs_0.6.5 cli_3.6.3 rlang_1.1.4 xfun_0.48
## [5] highr_0.11 generics_0.1.3 textshaping_0.4.0 labeling_0.4.3
## [9] glue_1.8.0 colorspace_2.1-1 htmltools_0.5.8.1 ragg_1.3.3
## [13] scales_1.3.0 fansi_1.0.6 rmarkdown_2.28 grid_4.3.2
## [17] munsell_0.5.1 evaluate_1.0.0 tibble_3.2.1 fastmap_1.2.0
## [21] yaml_2.3.10 lifecycle_1.0.4 compiler_4.3.2 pkgconfig_2.0.3
## [25] systemfonts_1.1.0 farver_2.1.2 digest_0.6.37 R6_2.5.1
## [29] tidyselect_1.2.1 utf8_1.2.4 pillar_1.9.0 magrittr_2.0.3
## [33] withr_3.0.1 tools_4.3.2 gtable_0.3.6
# 6 Summary table
``` r
# nearest-gene context for the two intergenic loci (computed from the GFF)
nearest_note <- c(
"NC_086379.1:64017640" = "intergenic; nearest gene LOC134725550 (protein chibby homolog 1-like), ~3.7 kb",
"NC_086375.1:43581688" = "intergenic; nearest gene LOC134711544 (solute carrier family 40 member 1-like), ~1.0 kb"
)
n_exon_map <- exons[, .N, by = gene]
setnames(n_exon_map, "N", "exon_count")
summary_tab <- dml |>
merge(n_exon_map, by.x = "assigned_gene", by.y = "gene", all.x = TRUE, sort = FALSE) |>
merge(primary[, .(assigned_gene = gene, primary_tx = tx)], by = "assigned_gene",
all.x = TRUE, sort = FALSE)
summary_tab[, gene_span := paste0(g_start, "-", g_end)]
summary_tab[, locus := paste0(chr, ":", pos)]
summary_tab[, note := ifelse(in_gene_span, "DML within gene body",
nearest_note[locus])]
summary_out <- summary_tab[order(assigned_gene, pos),
.(gene_id = assigned_gene, gene_description = gene_desc, chr,
gene_span, strand = g_strand, primary_tx, exon_count,
dml_position = pos, qvalue, meth_diff, direction,
status_paper, in_gene_span, note)]
fwrite(summary_out, file.path(out_dir, "dml_gene_model_summary.tsv"), sep = "\t")
fwrite(summary_out, file.path(out_dir, "dml_gene_model_summary.csv"))
knitr::kable(summary_out)
```
| gene\_id | gene\_description | chr | gene\_span | strand | primary\_tx | exon\_count | dml\_position | qvalue | meth\_diff | direction | status\_paper | in\_gene\_span | note |
|:-------------|:--------------------------------------------------------------|:-------------|:--------------------|:-------|:--------------------|------------:|--------------:|-------:|-----------:|:-----------------|:--------------|:---------------|:---------------------|
| LOC134685297 | tumor protein p53-inducible protein 11-like | NC\_086381.1 | 21116727-21261455 | \- | rna-XM\_063544925.1 | 7 | 21212100 | 0 | -56.07 | Hypo-methylated | Hypo | TRUE | DML within gene body |
| LOC134687110 | alpha-ketoglutarate-dependent dioxygenase alkB homolog 3-like | NC\_086382.1 | 25951921-25959192 | \+ | rna-XM\_063547109.1 | 7 | 25952234 | 0 | -55.83 | Hypo-methylated | Hypo | TRUE | DML within gene body |
| LOC134687290 | mitogen-activated protein kinase kinase kinase 5-like | NC\_086382.1 | 36708321-36799106 | \+ | rna-XM\_063547445.1 | 42 | 36708761 | 0 | -56.50 | Hypo-methylated | Hypo | TRUE | DML within gene body |
| LOC134690221 | GRAM domain-containing protein 4-like | NC\_086373.1 | 90602585-90632630 | \+ | rna-XM\_063550200.1 | 18 | 90626338 | 0 | 56.32 | Hyper-methylated | Hyper | TRUE | DML within gene body |
| LOC134695637 | otoferlin-like | NC\_086373.1 | 105380391-105513502 | \- | rna-XM\_063556955.1 | 45 | 105503509 | 0 | -57.86 | Hypo-methylated | Hypo | TRUE | DML within gene body |
| LOC134707074 | receptor-type tyrosine-protein phosphatase N2-like | NC\_086374.1 | 34630047-34756161 | \- | rna-XM\_063566562.1 | 21 | 34742951 | 0 | 58.27 | Hyper-methylated | Hyper | TRUE | DML within gene body |
| LOC134711256 | cancer-related nucleoside-triphosphatase homolog | NC\_086375.1 | 31935064-31941257 | \- | rna-XM\_063571761.1 | 6 | 31938079 | 0 | -60.69 | Hypo-methylated | Hypo | TRUE | DML within gene body |
| LOC134712818 | uncharacterized LOC134712818 | NC\_086375.1 | 90867638-90891015 | \+ | rna-XM\_063574731.1 | 16 | 90876604 | 0 | 55.88 | Hyper-methylated | Hyper | TRUE | DML within gene body |
| LOC134714536 | coatomer subunit epsilon-like | NC\_086376.1 | 5626113-5639140 | \+ | rna-XM\_063575859.1 | 11 | 5631156 | 0 | 59.00 | Hyper-methylated | Hyper | TRUE | DML within gene body |
| LOC134720671 | roundabout homolog 1-like | NC\_086378.1 | 6588729-6697712 | \+ | rna-XM\_063583078.1 | 26 | 6633121 | 0 | -55.24 | Hypo-methylated | Hypo | TRUE | DML within gene body |
| LOC134724475 | uncharacterized LOC134724475 | NC\_086379.1 | 1585149-1617687 | \+ | rna-XM\_063587507.1 | 9 | 1603830 | 0 | -60.82 | Hypo-methylated | Hypo | TRUE | DML within gene body |
| LOC134725187 | membrane protein BRI3-like | NC\_086379.1 | 47959226-47965210 | \- | rna-XM\_063588806.1 | 4 | 47961734 | 0 | 56.45 | Hyper-methylated | Hyper | TRUE | DML within gene body |
# 7 Session info
``` r
sessionInfo()
```
## R version 4.3.2 (2023-10-31)
## Platform: aarch64-apple-darwin20 (64-bit)
## Running under: macOS Sonoma 14.7.6
##
## Matrix products: default
## BLAS: /Library/Frameworks/R.framework/Versions/4.3-arm64/Resources/lib/libRblas.0.dylib
## LAPACK: /Library/Frameworks/R.framework/Versions/4.3-arm64/Resources/lib/libRlapack.dylib; LAPACK version 3.11.0
##
## locale:
## [1] C
##
## time zone: America/Los_Angeles
## tzcode source: internal
##
## attached base packages:
## [1] stats graphics grDevices utils datasets methods base
##
## other attached packages:
## [1] patchwork_1.3.1 ggplot2_3.5.1 dplyr_1.1.4 data.table_1.16.0
## [5] knitr_1.48
##
## loaded via a namespace (and not attached):
## [1] vctrs_0.6.5 cli_3.6.3 rlang_1.1.4 xfun_0.48
## [5] highr_0.11 generics_0.1.3 textshaping_0.4.0 labeling_0.4.3
## [9] glue_1.8.0 colorspace_2.1-1 htmltools_0.5.8.1 ragg_1.3.3
## [13] scales_1.3.0 fansi_1.0.6 rmarkdown_2.28 grid_4.3.2
## [17] munsell_0.5.1 evaluate_1.0.0 tibble_3.2.1 fastmap_1.2.0
## [21] yaml_2.3.10 lifecycle_1.0.4 compiler_4.3.2 pkgconfig_2.0.3
## [25] systemfonts_1.1.0 farver_2.1.2 digest_0.6.37 R6_2.5.1
## [29] tidyselect_1.2.1 utf8_1.2.4 pillar_1.9.0 magrittr_2.0.3
## [33] withr_3.0.1 tools_4.3.2 gtable_0.3.6