Input data and parameters
QualiMap command line
| qualimap bamqc -bam zr3644_9.deduplicated.sorted.bam -nw 400 -hm 3 |
Alignment
| Command line: | "bismark -1 zr3644_9_R1_val_1_val_1_val_1.fq.gz -2 zr3644_9_R2_val_2_val_2_val_2.fq.gz --genome BismarkIndex --bam --score_min L,0,-0.8 --non_directional --prefix zr3644_9 --multicore 3" |
| Draw chromosome limits: | no |
| Analyze overlapping paired-end reads: | yes |
| Program: | Bismark (v0.24.2) |
| Analysis date: | Wed Apr 16 07:35:17 GMT 2025 |
| Size of a homopolymer: | 3 |
| Skip duplicate alignments: | no |
| Number of windows: | 400 |
| BAM file: | zr3644_9.deduplicated.sorted.bam |
Summary
Globals
| Reference size | 563,985,803 |
| Number of reads | 52,631,226 |
| Mapped reads | 52,631,226 / 100% |
| Unmapped reads | 0 / 0% |
| Mapped paired reads | 52,631,226 / 100% |
| Mapped reads, first in pair | 26,315,613 / 50% |
| Mapped reads, second in pair | 26,315,613 / 50% |
| Mapped reads, both in pair | 52,631,226 / 100% |
| Mapped reads, singletons | 0 / 0% |
| Secondary alignments | 0 |
| Read min/max/mean length | 20 / 115 / 103.29 |
| Overlapping read pairs | 23,293,629 / 88.52% |
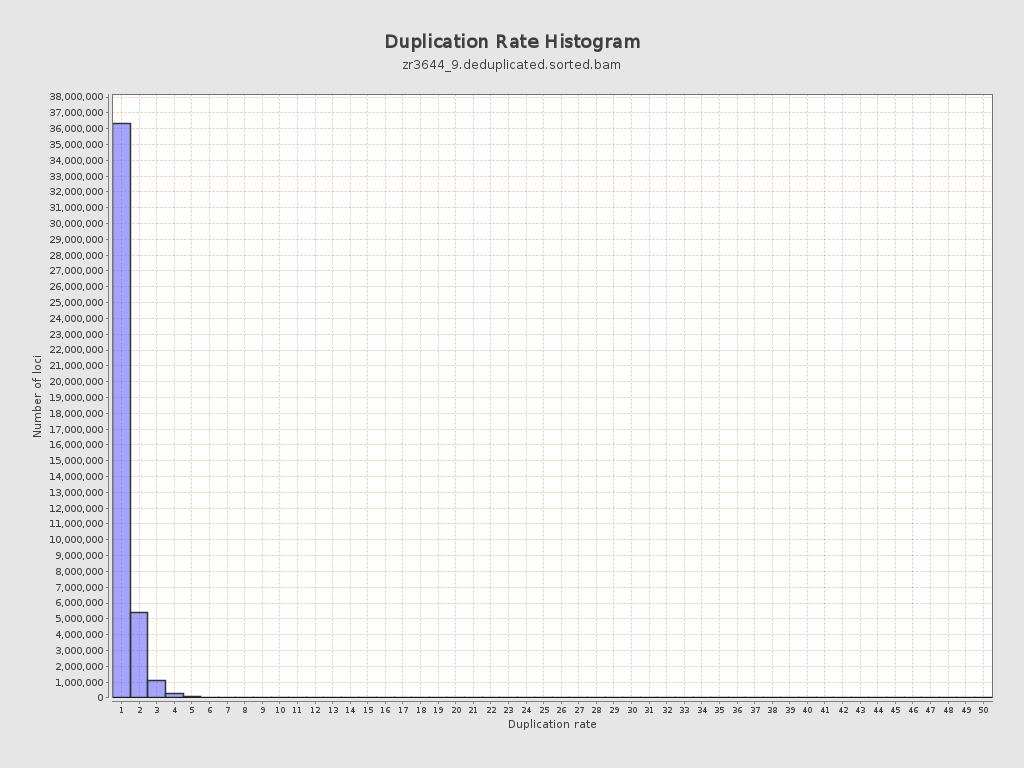
| Duplicated reads (estimated) | 9,356,431 / 17.78% |
| Duplication rate | 16.08% |
| Clipped reads | 0 / 0% |
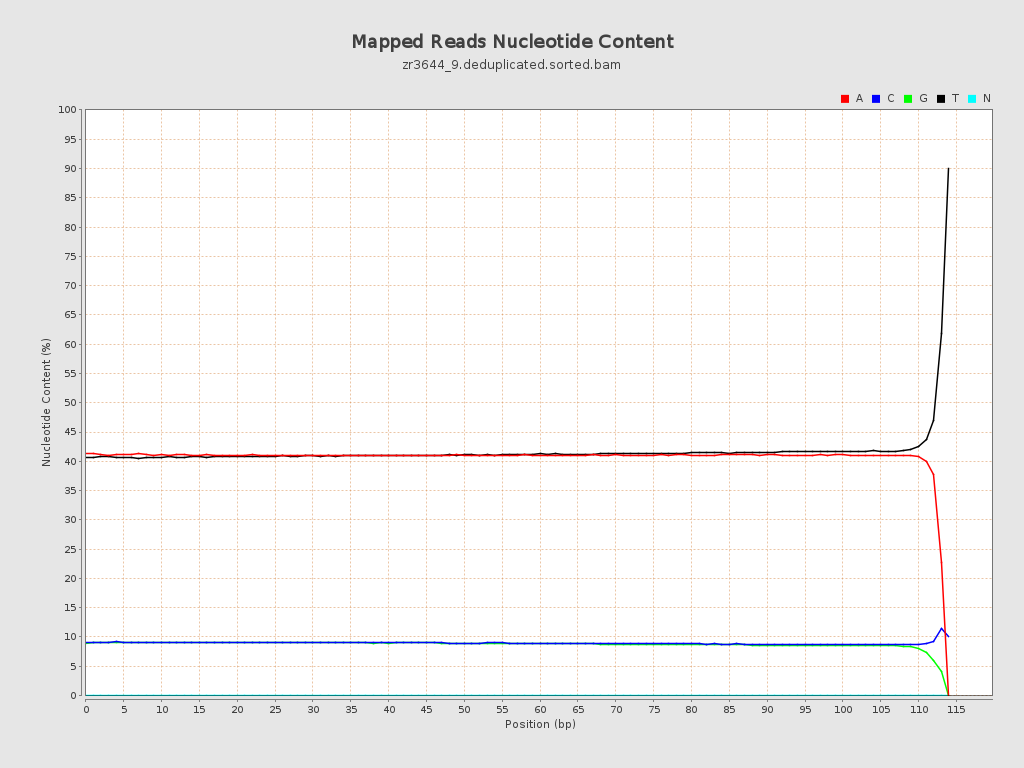
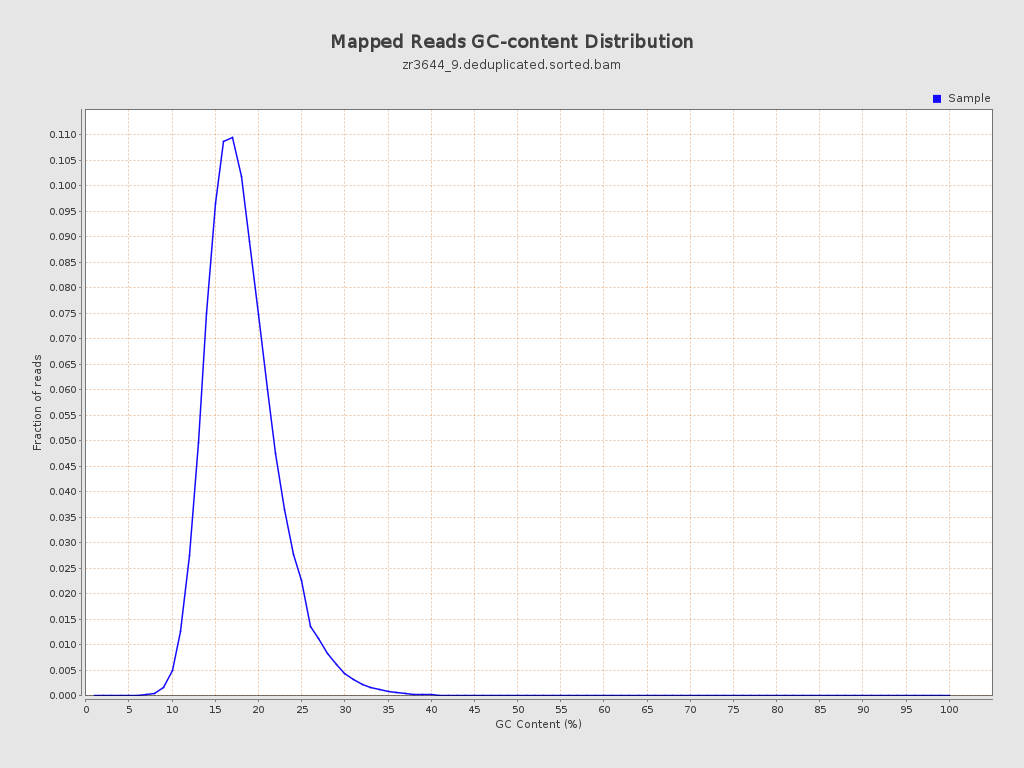
ACGT Content
| Number/percentage of A's | 2,210,778,570 / 40.9% |
| Number/percentage of C's | 484,151,180 / 8.96% |
| Number/percentage of T's | 2,233,878,763 / 41.33% |
| Number/percentage of G's | 476,424,516 / 8.81% |
| Number/percentage of N's | 41,084 / 0% |
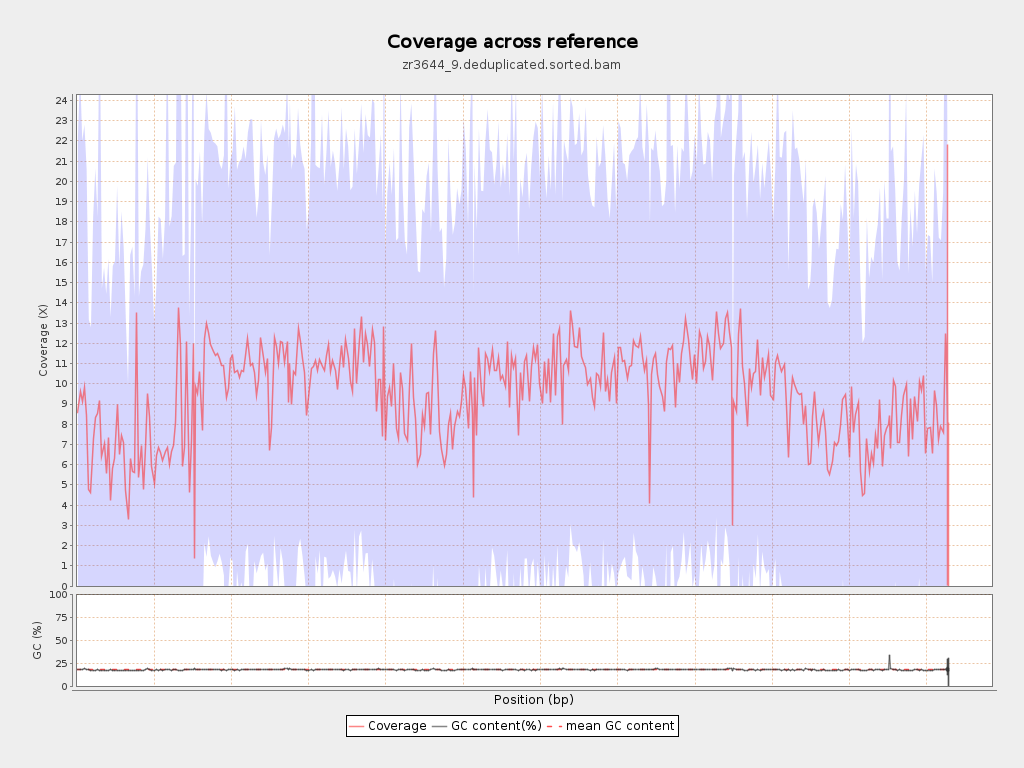
| GC Percentage | 17.77% |
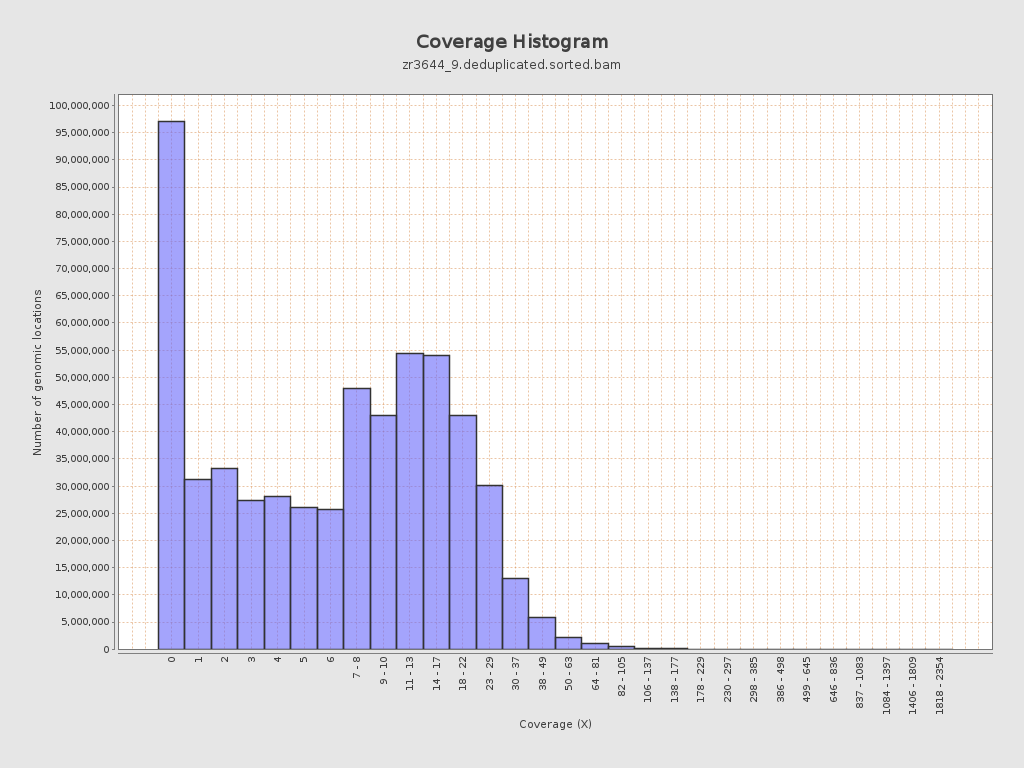
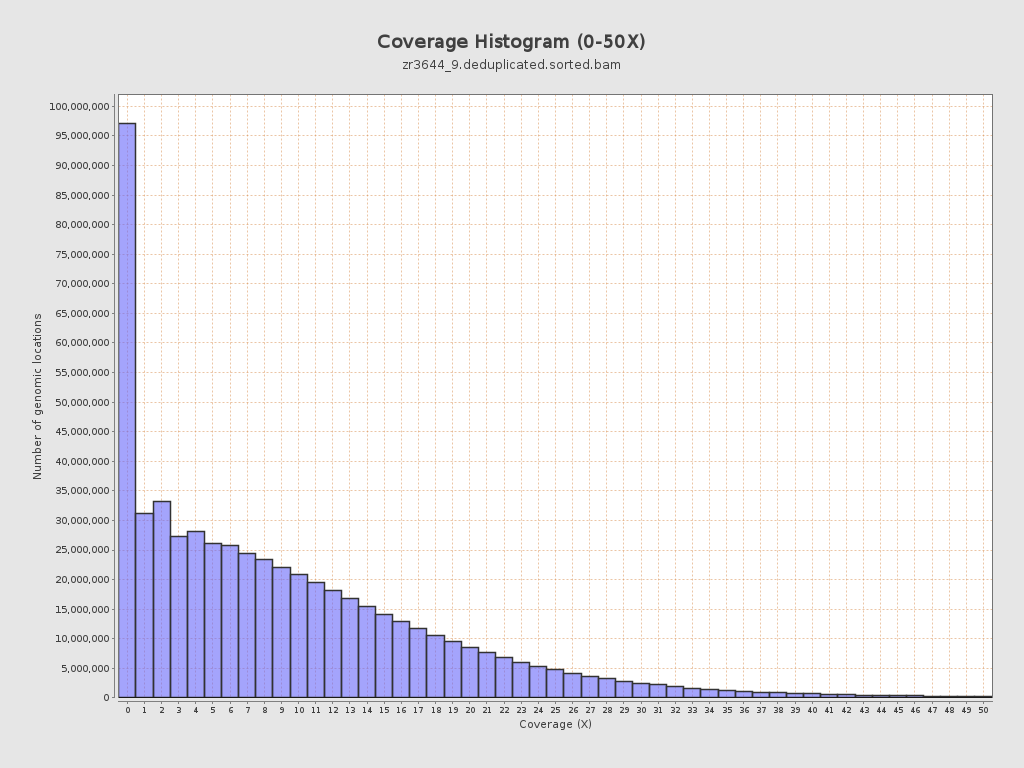
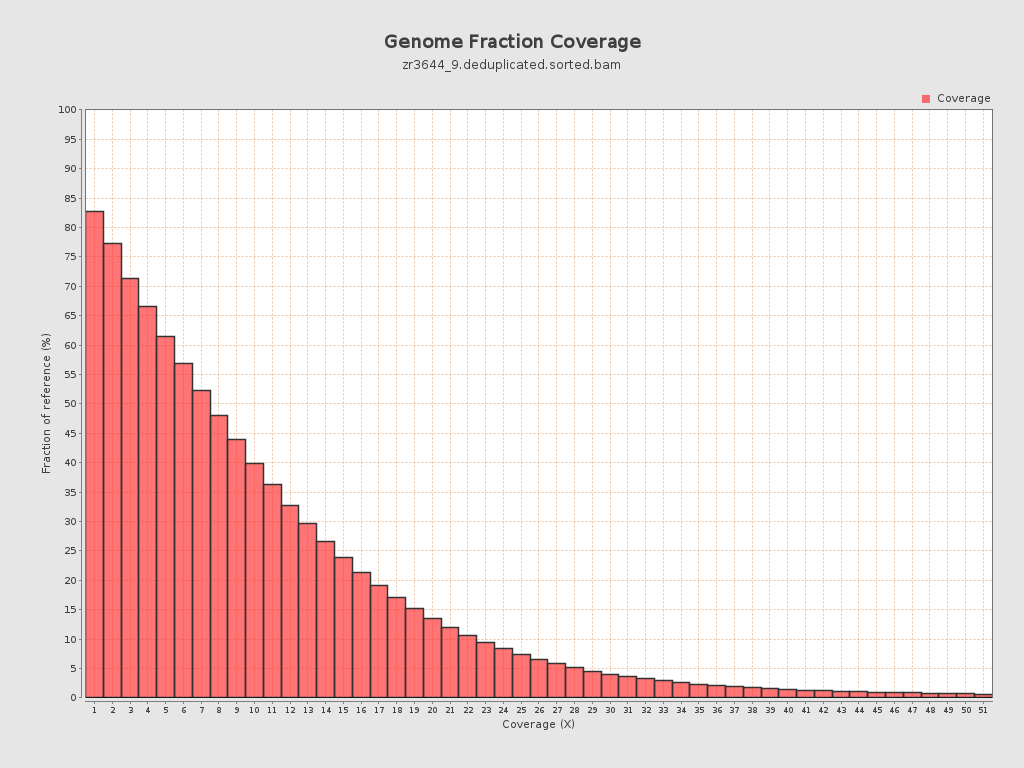
Coverage
| Mean | 9.6259 |
| Standard Deviation | 10.8821 |
| Mean (paired-end reads overlap ignored) | 6.63 |
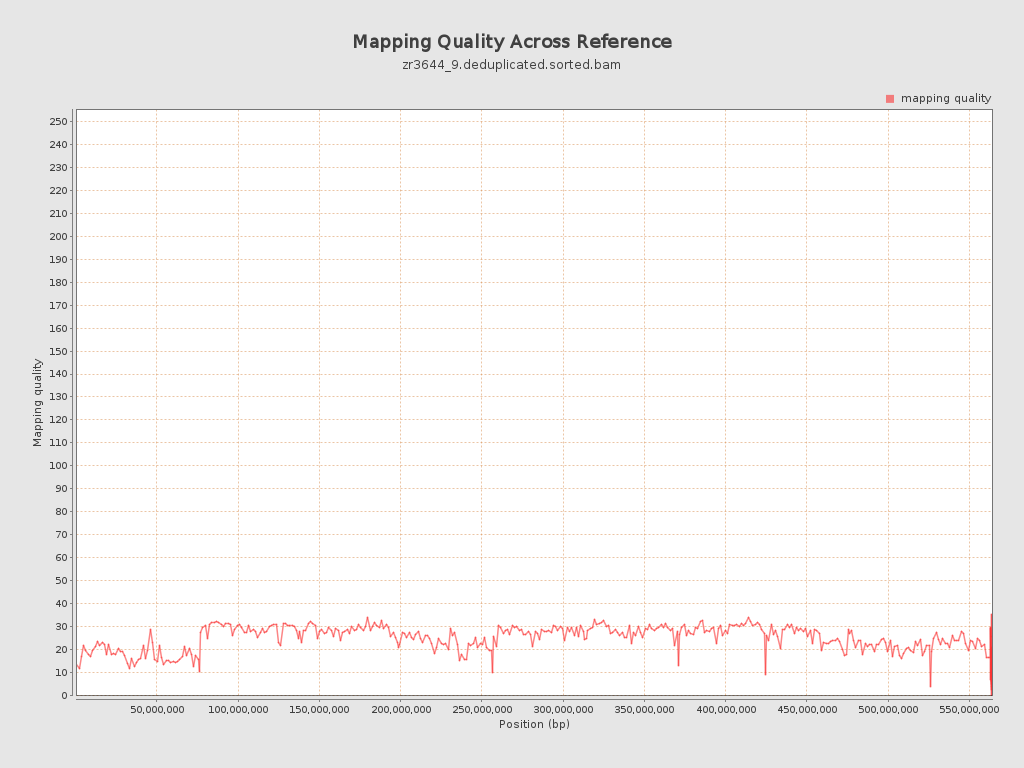
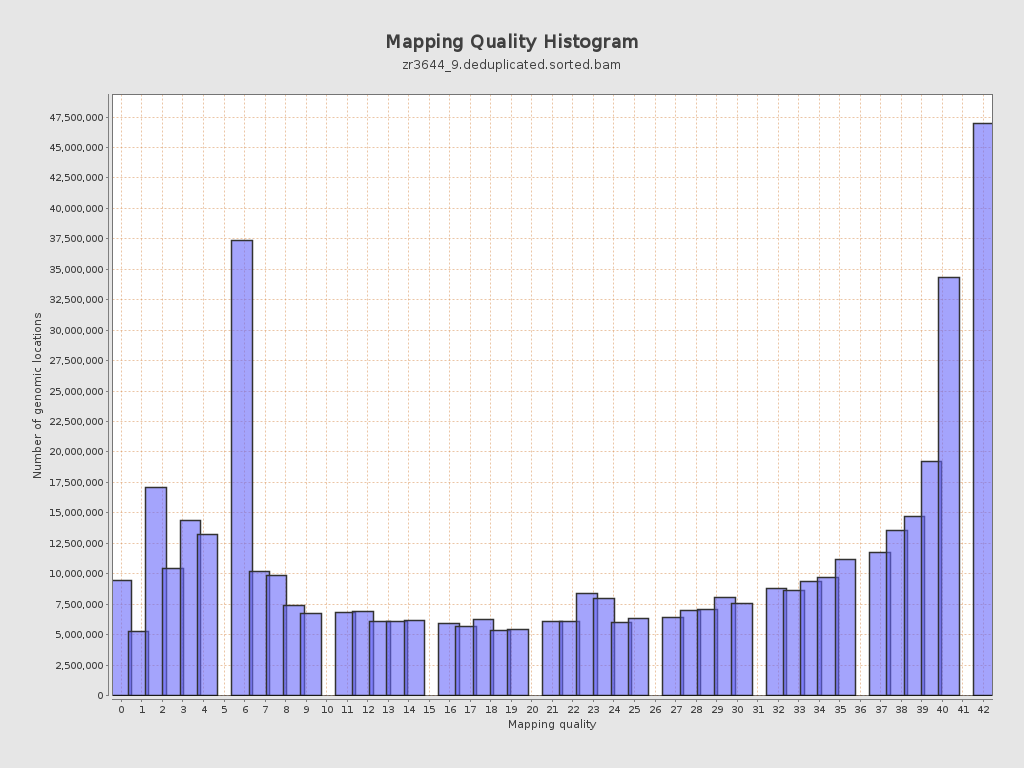
Mapping Quality
| Mean Mapping Quality | 24.64 |
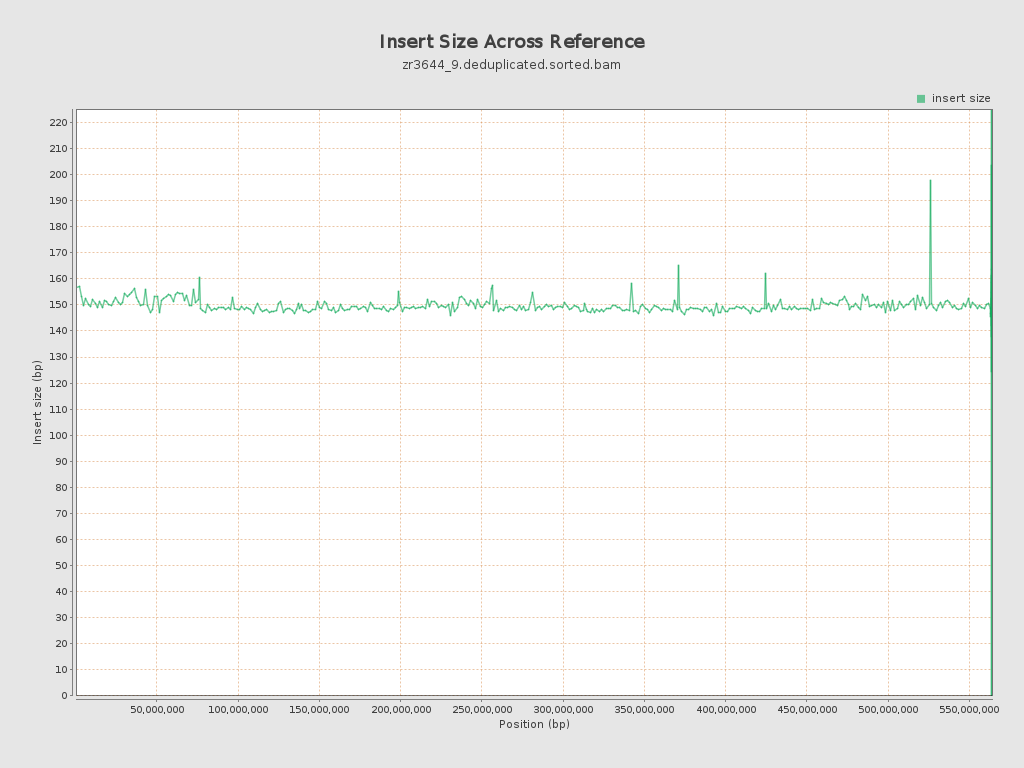
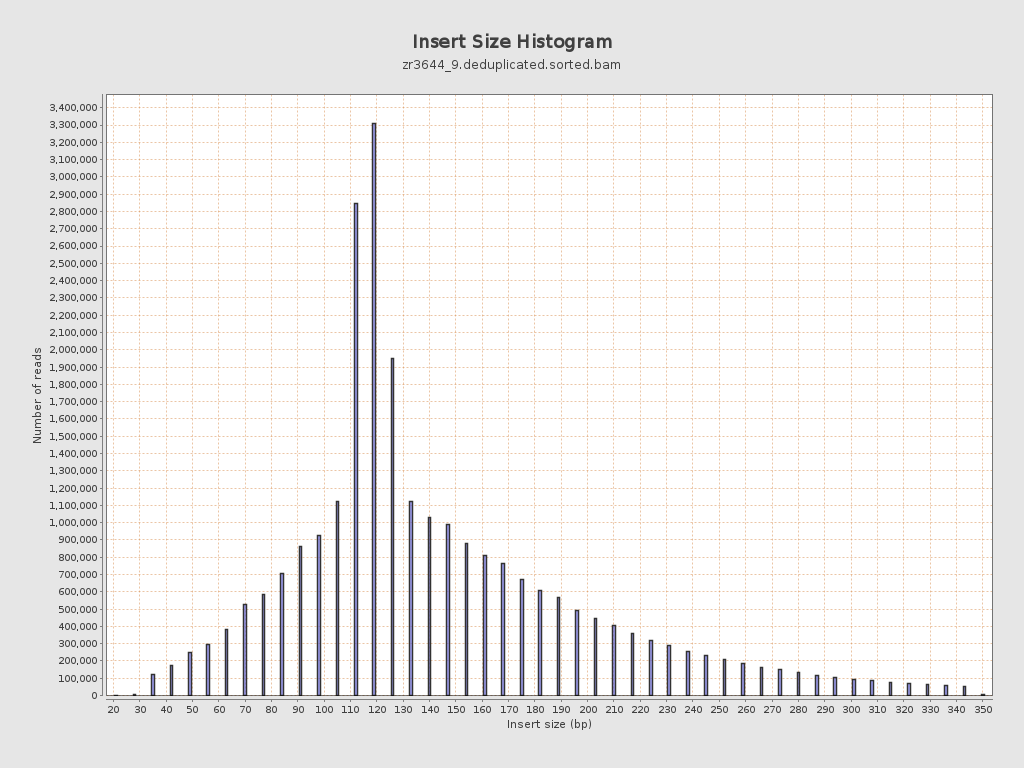
Insert size
| Mean | 149.39 |
| Standard Deviation | 65.21 |
| P25/Median/P75 | 114 / 128 / 175 |
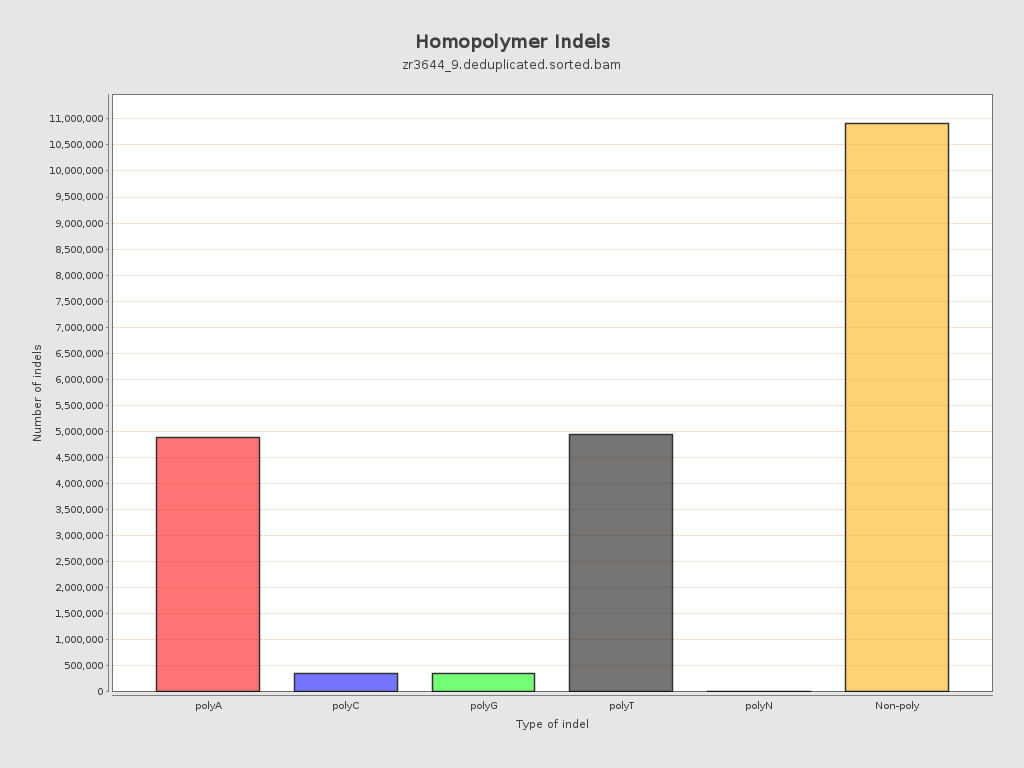
Mismatches and indels
| General error rate | 19.57% |
| Mismatches | 1,031,935,592 |
| Insertions | 11,404,149 |
| Mapped reads with at least one insertion | 16.42% |
| Deletions | 10,037,739 |
| Mapped reads with at least one deletion | 15.82% |
| Homopolymer indels | 49.09% |
Chromosome stats
| Name | Length | Mapped bases | Mean coverage | Standard deviation |
| NC_088853.1 | 76070991 | 555656170 | 7.3044 | 12.1813 |
| NC_088854.1 | 61469542 | 666041655 | 10.8353 | 10.3653 |
| NC_088855.1 | 61039741 | 666090811 | 10.9124 | 10.6417 |
| NC_088856.1 | 57946171 | 505975152 | 8.7318 | 10.7733 |
| NC_088857.1 | 57274926 | 603292998 | 10.5333 | 10.4485 |
| NC_088858.1 | 56905015 | 622481874 | 10.939 | 10.0499 |
| NC_088859.1 | 53672946 | 611280956 | 11.389 | 11.1308 |
| NC_088860.1 | 51133819 | 503616448 | 9.849 | 10.7703 |
| NC_088861.1 | 50364239 | 371025927 | 7.3669 | 9.8532 |
| NC_088862.1 | 37310742 | 320318579 | 8.5852 | 10.9125 |
| NW_027062568.1 | 15579 | 120415 | 7.7293 | 6.9273 |
| NW_027062569.1 | 16498 | 106081 | 6.4299 | 14.1925 |
| NW_027062570.1 | 4000 | 55743 | 13.9358 | 12.7094 |
| NW_027062571.1 | 36893 | 9594 | 0.26 | 1.91 |
| NW_027062572.1 | 51000 | 22271 | 0.4367 | 1.0579 |
| NW_027062573.1 | 2000 | 43629 | 21.8145 | 11.1539 |
| NW_027062574.1 | 37061 | 446 | 0.012 | 0.1501 |
| NW_027062575.1 | 49428 | 389893 | 7.8881 | 14.858 |
| NW_027062576.1 | 49232 | 233402 | 4.7409 | 19.4794 |
| NW_027062577.1 | 17087 | 136612 | 7.9951 | 5.9213 |
| NW_027062578.1 | 34507 | 515121 | 14.928 | 8.845 |
| NW_027062579.1 | 64000 | 406723 | 6.355 | 7.7707 |
| NW_027062580.1 | 24229 | 244103 | 10.0748 | 9.7076 |
| NW_027062581.1 | 5000 | 13782 | 2.7564 | 6.3251 |
| NW_027062582.1 | 18808 | 152441 | 8.1051 | 7.1789 |
| NW_027062583.1 | 1000 | 0 | 0 | 0 |
| NW_027062584.1 | 74000 | 10533 | 0.1423 | 0.6867 |
| NW_027062585.1 | 39334 | 241684 | 6.1444 | 6.5393 |
| NW_027062586.1 | 258015 | 395886 | 1.5344 | 4.8982 |