Input data and parameters
QualiMap command line
| qualimap bamqc -bam zr3644_8.deduplicated.sorted.bam -nw 400 -hm 3 |
Alignment
| Command line: | "bismark -1 zr3644_8_R1_val_1_val_1_val_1.fq.gz -2 zr3644_8_R2_val_2_val_2_val_2.fq.gz --genome BismarkIndex --bam --score_min L,0,-0.8 --non_directional --prefix zr3644_8 --multicore 3" |
| Draw chromosome limits: | no |
| Analyze overlapping paired-end reads: | yes |
| Program: | Bismark (v0.24.2) |
| Analysis date: | Wed Apr 16 06:20:37 GMT 2025 |
| Size of a homopolymer: | 3 |
| Skip duplicate alignments: | no |
| Number of windows: | 400 |
| BAM file: | zr3644_8.deduplicated.sorted.bam |
Summary
Globals
| Reference size | 563,985,803 |
| Number of reads | 47,687,228 |
| Mapped reads | 47,687,228 / 100% |
| Unmapped reads | 0 / 0% |
| Mapped paired reads | 47,687,228 / 100% |
| Mapped reads, first in pair | 23,843,614 / 50% |
| Mapped reads, second in pair | 23,843,614 / 50% |
| Mapped reads, both in pair | 47,687,228 / 100% |
| Mapped reads, singletons | 0 / 0% |
| Secondary alignments | 0 |
| Read min/max/mean length | 20 / 115 / 105.44 |
| Overlapping read pairs | 20,262,065 / 84.98% |
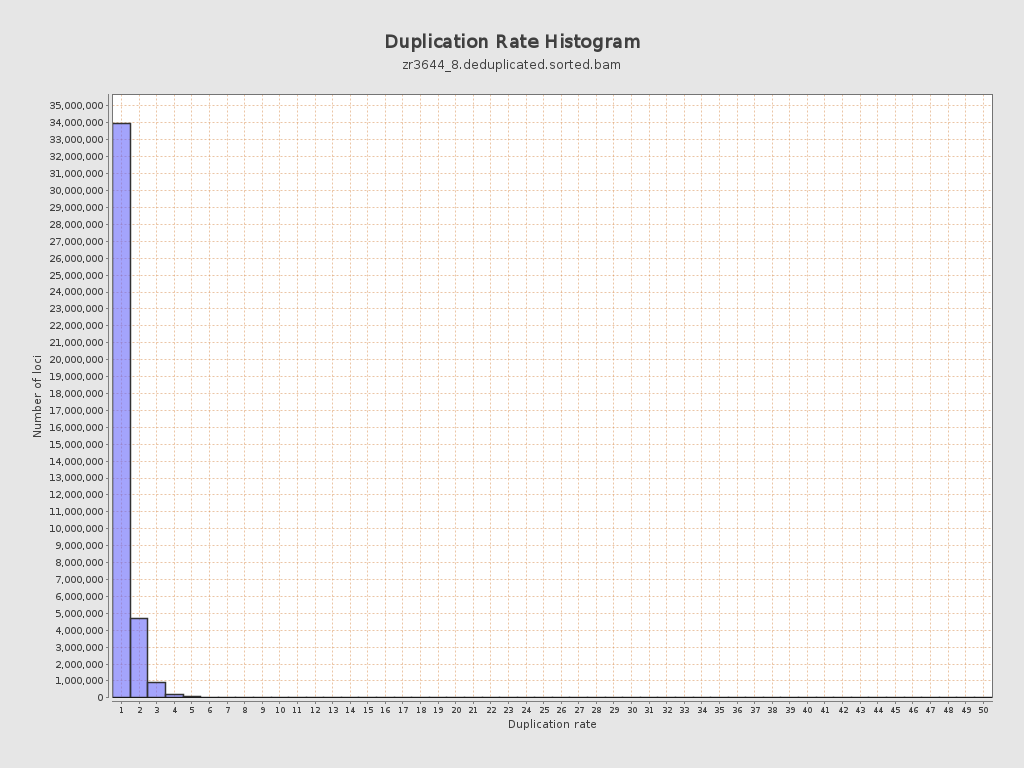
| Duplicated reads (estimated) | 7,802,103 / 16.36% |
| Duplication rate | 14.86% |
| Clipped reads | 0 / 0% |
ACGT Content
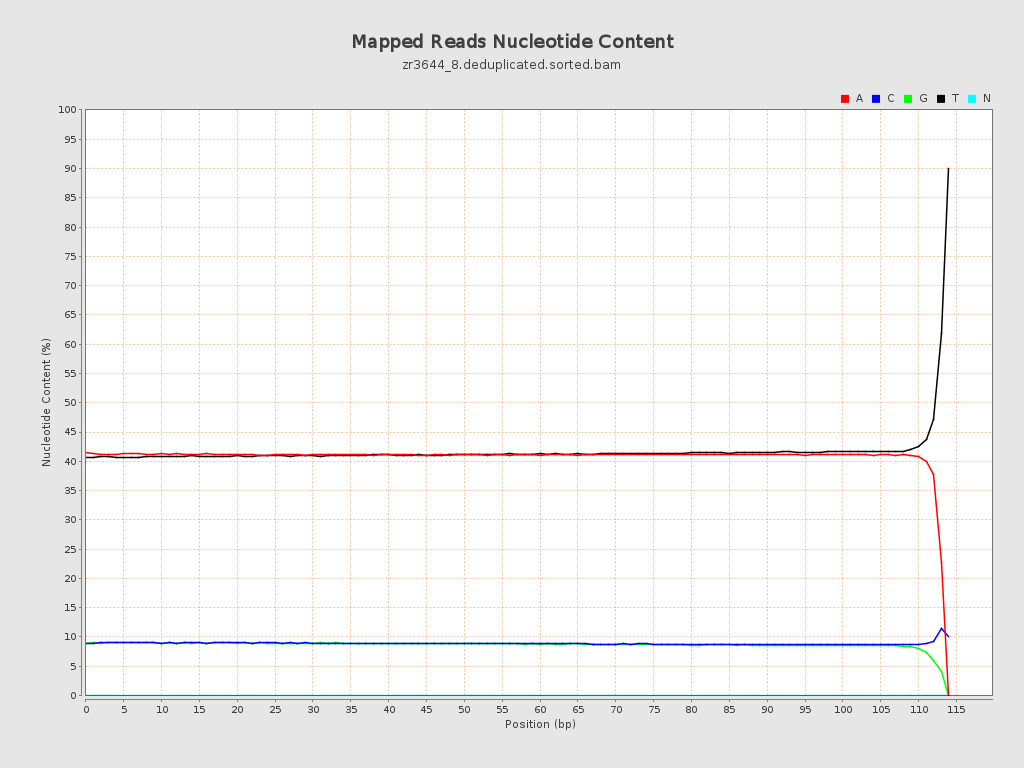
| Number/percentage of A's | 2,049,153,486 / 40.99% |
| Number/percentage of C's | 444,177,632 / 8.88% |
| Number/percentage of T's | 2,068,685,298 / 41.38% |
| Number/percentage of G's | 437,620,458 / 8.75% |
| Number/percentage of N's | 38,204 / 0% |
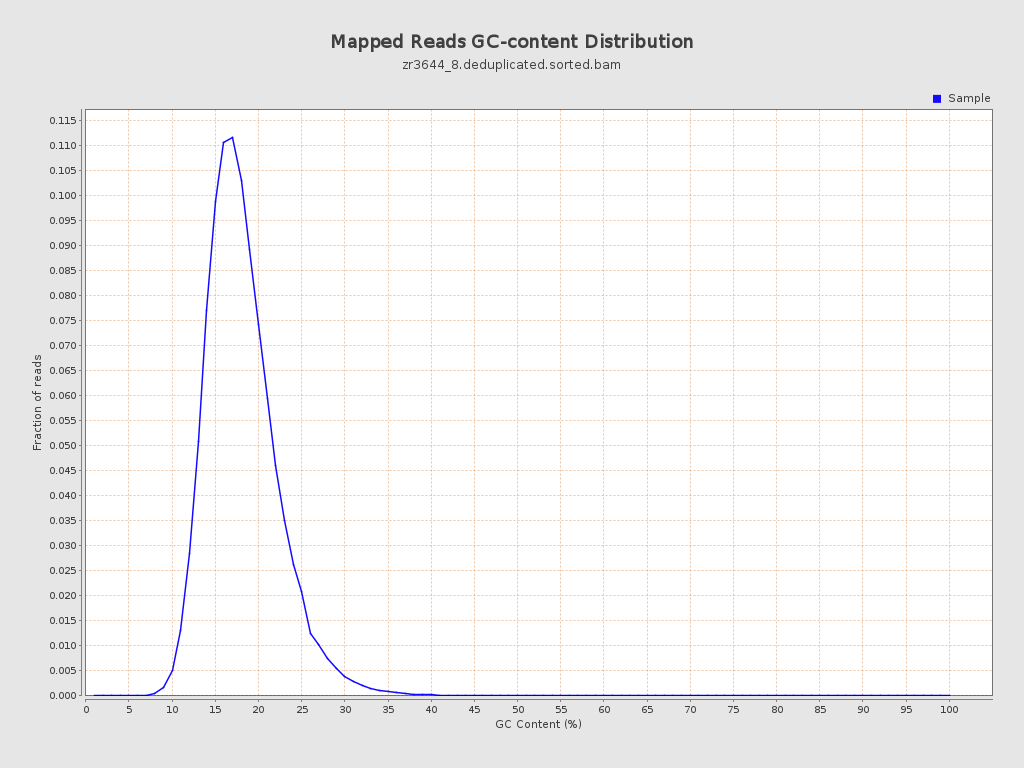
| GC Percentage | 17.64% |
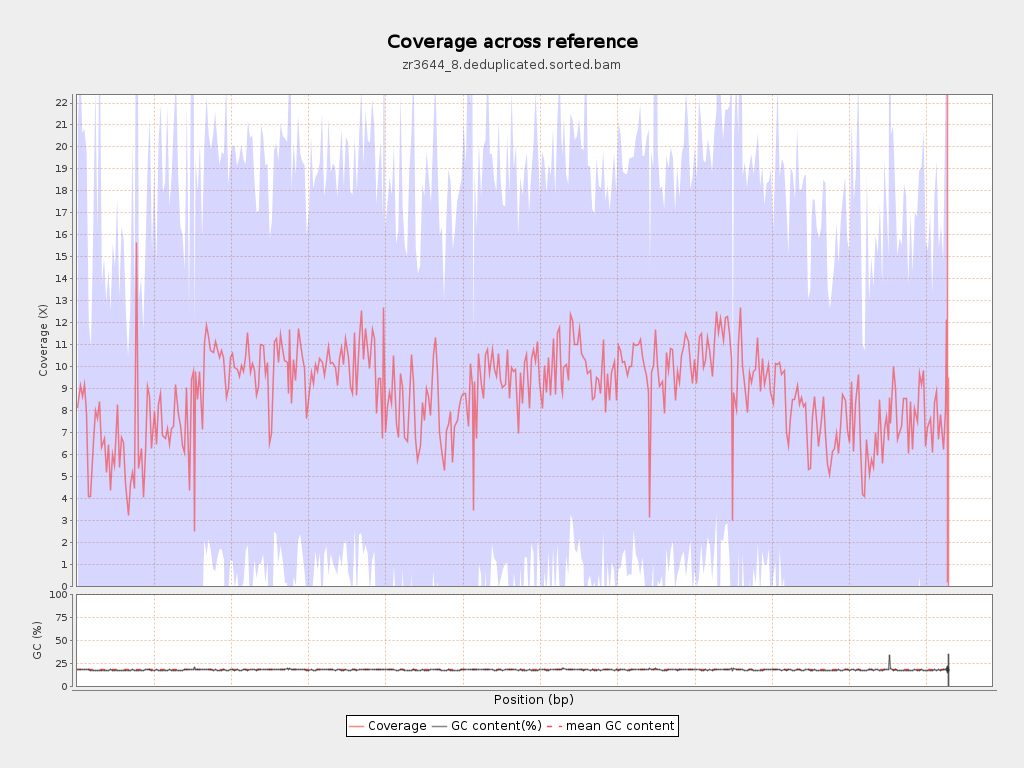
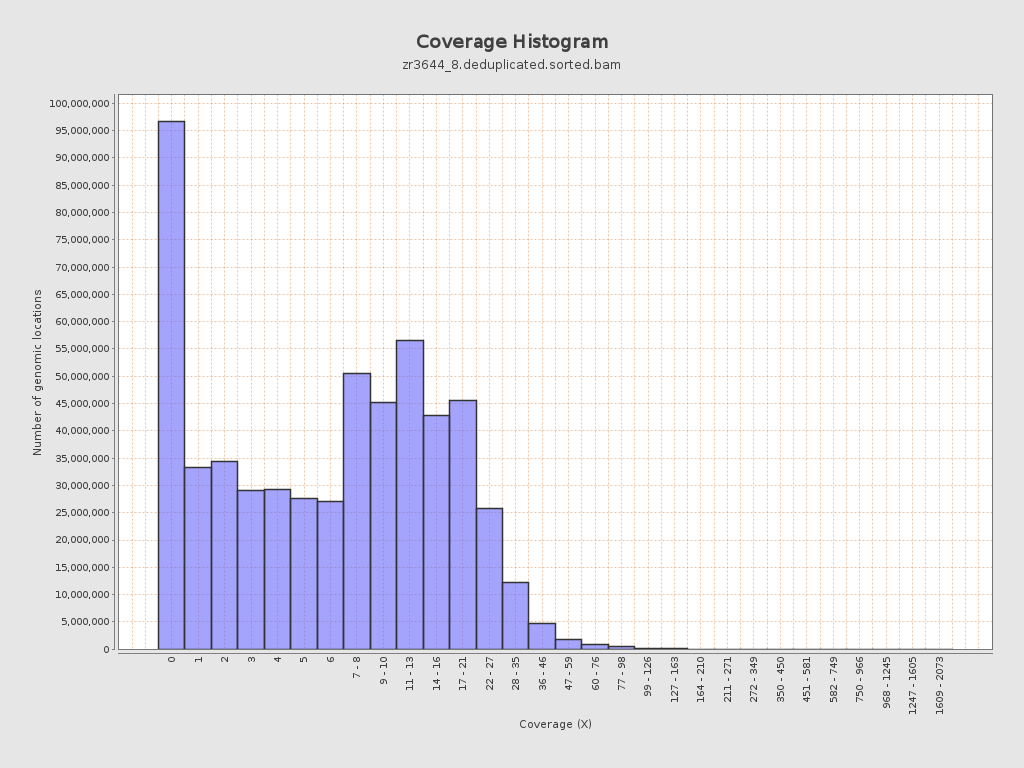
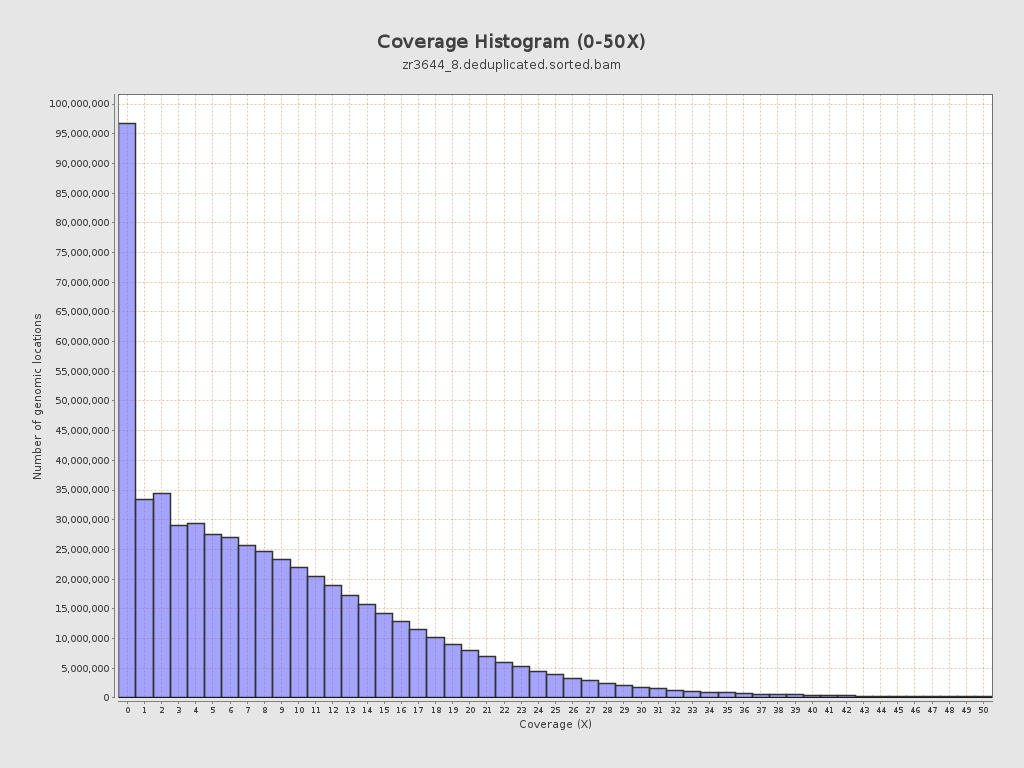
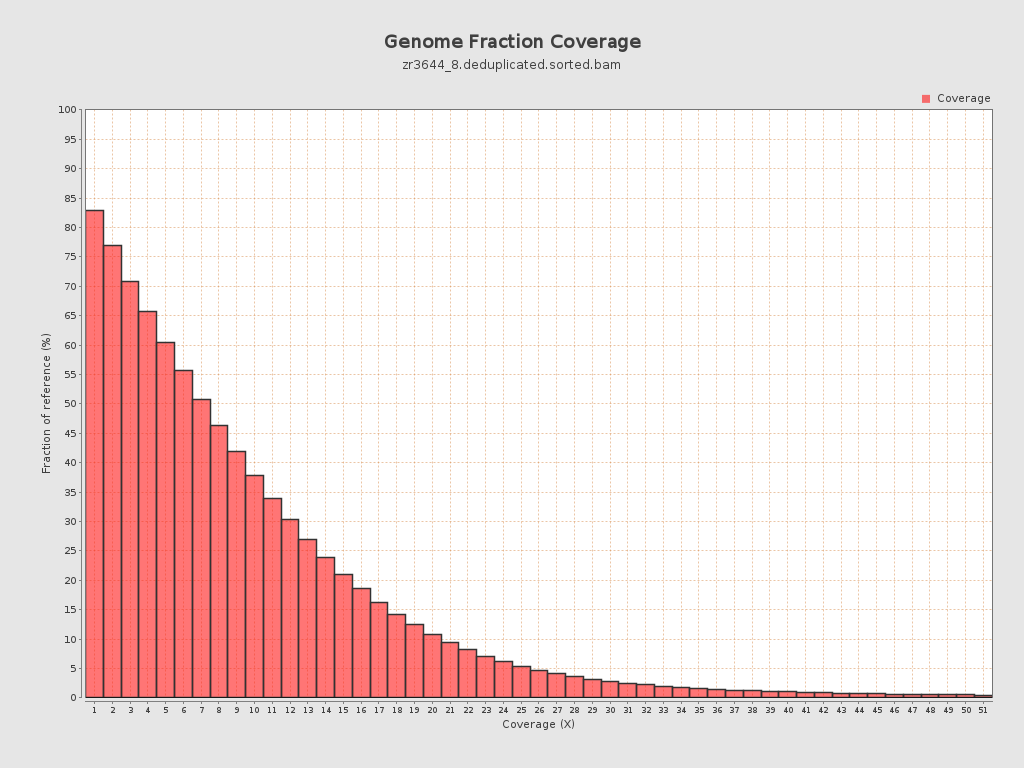
Coverage
| Mean | 8.904 |
| Standard Deviation | 9.8652 |
| Mean (paired-end reads overlap ignored) | 6.33 |
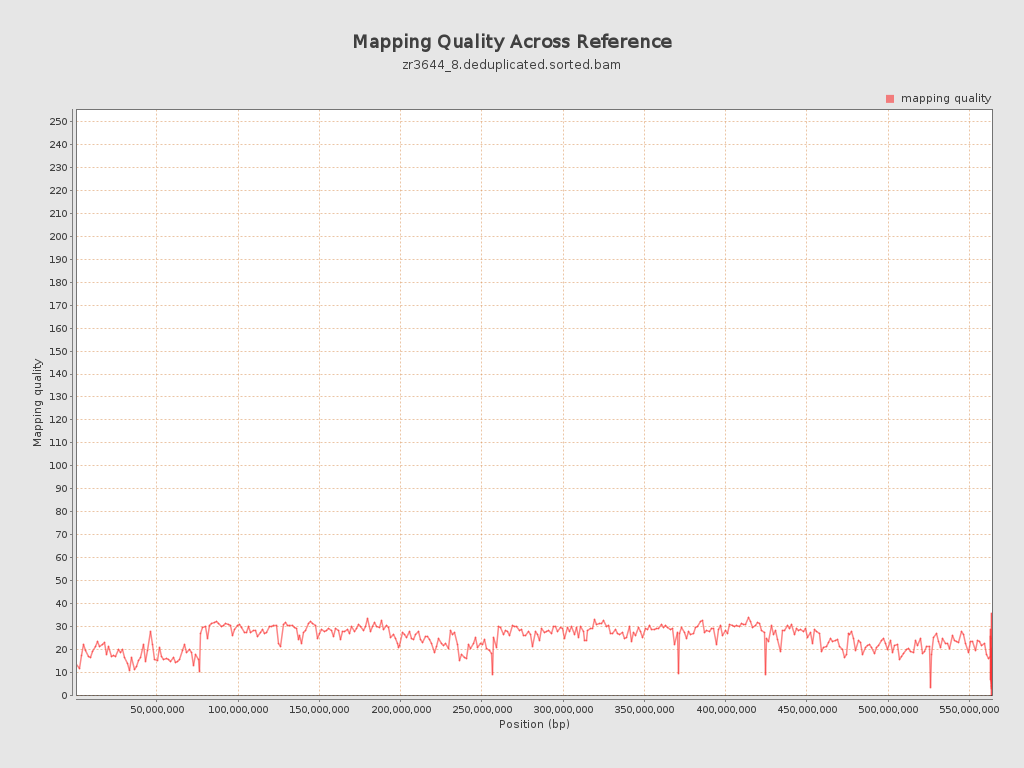
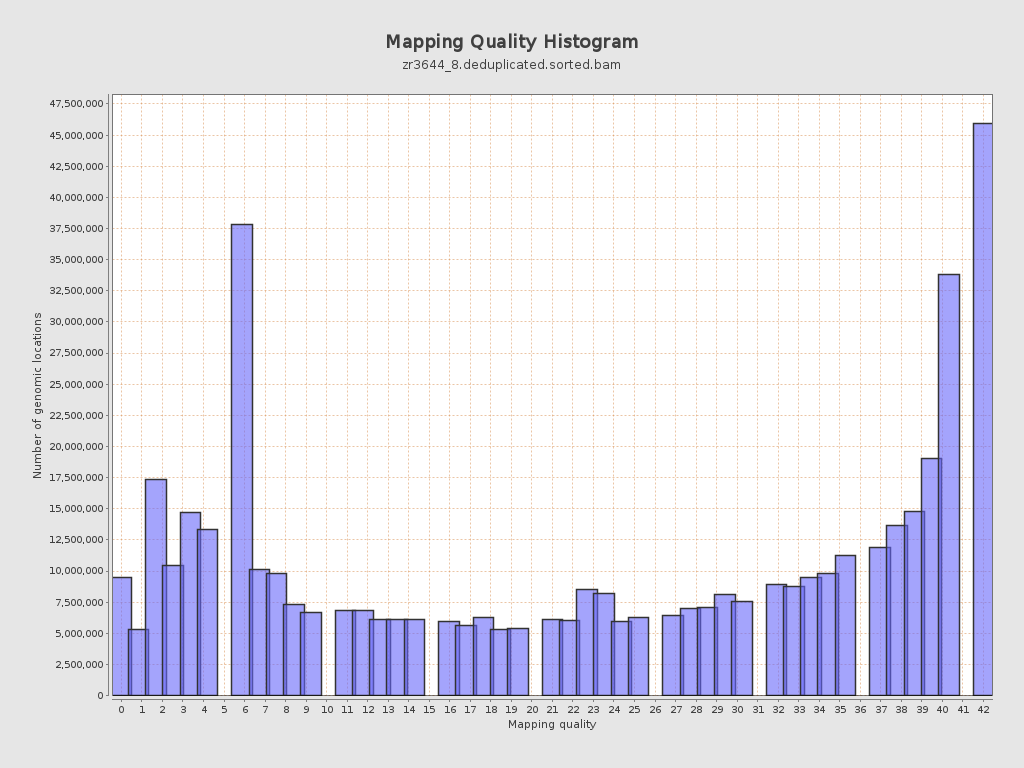
Mapping Quality
| Mean Mapping Quality | 24.46 |
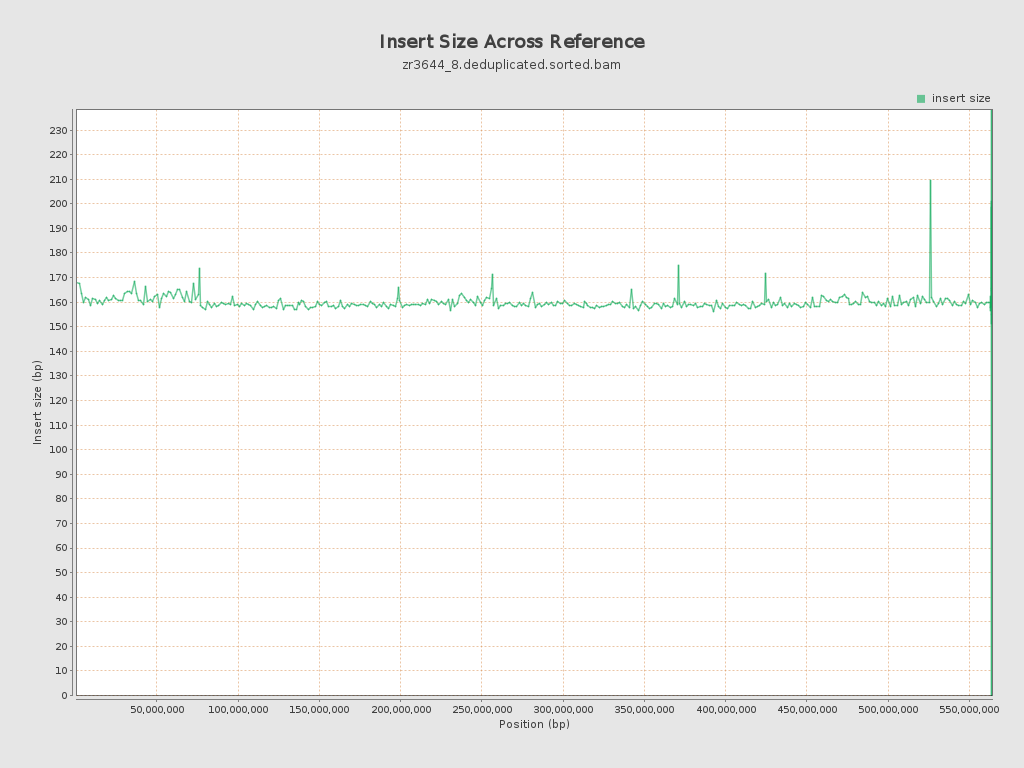
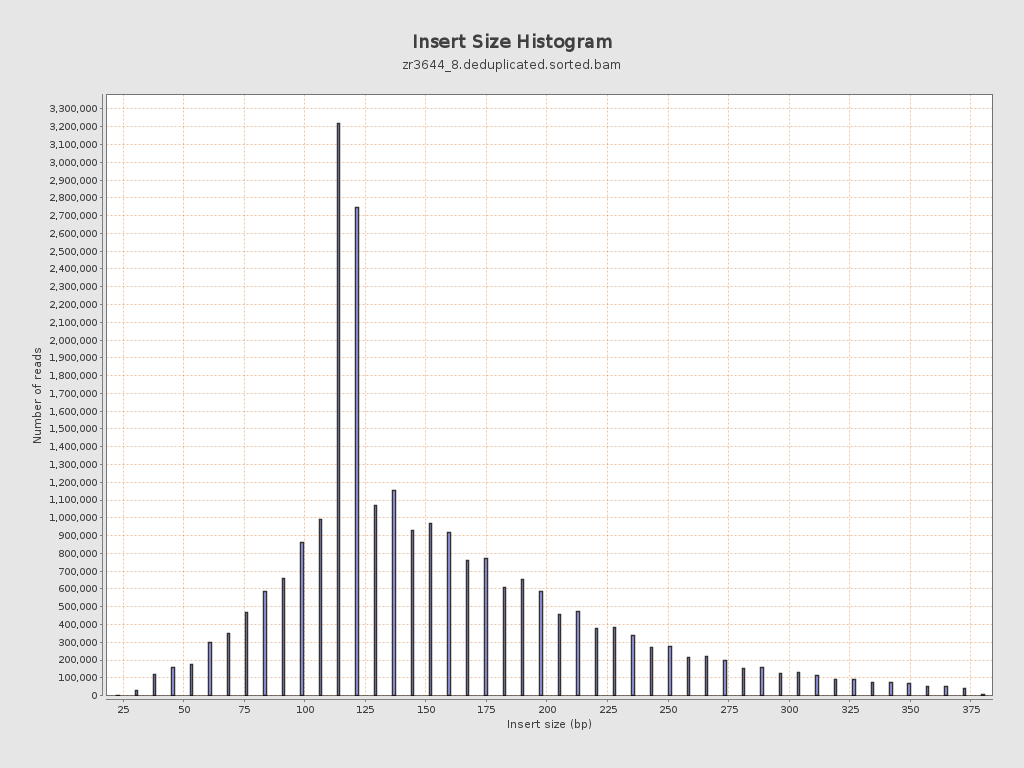
Insert size
| Mean | 159.56 |
| Standard Deviation | 69.83 |
| P25/Median/P75 | 117 / 138 / 190 |
Mismatches and indels
| General error rate | 19.5% |
| Mismatches | 950,354,570 |
| Insertions | 10,572,542 |
| Mapped reads with at least one insertion | 16.75% |
| Deletions | 9,315,821 |
| Mapped reads with at least one deletion | 16.16% |
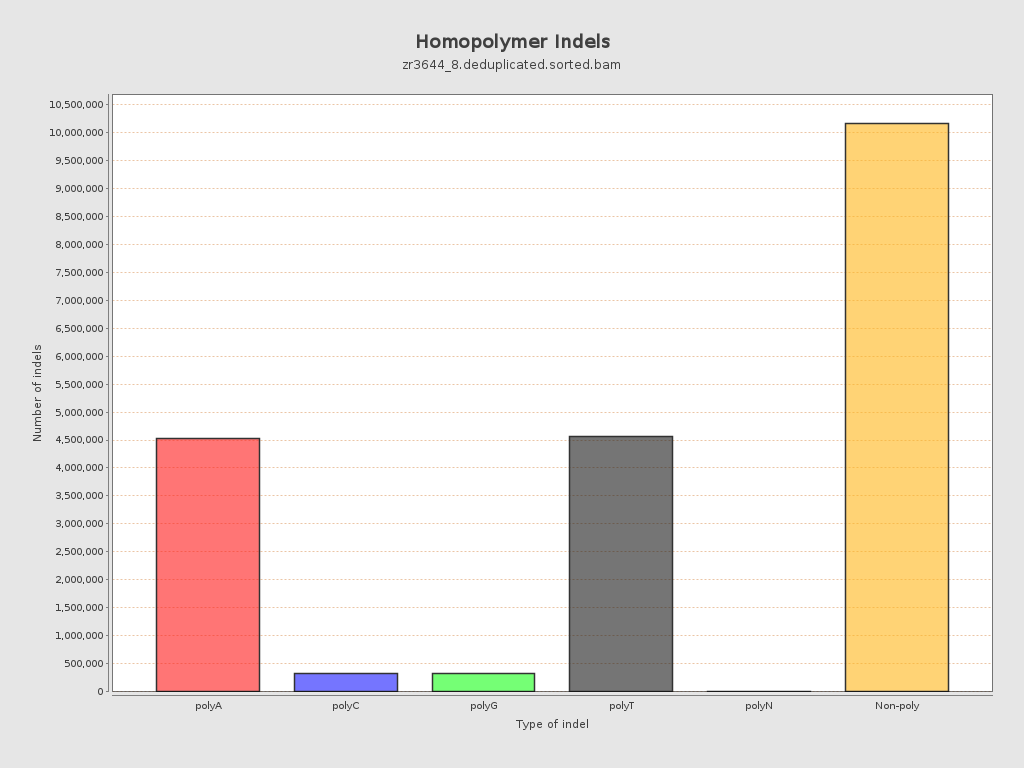
| Homopolymer indels | 48.88% |
Chromosome stats
| Name | Length | Mapped bases | Mean coverage | Standard deviation |
| NC_088853.1 | 76070991 | 528703598 | 6.9501 | 11.0898 |
| NC_088854.1 | 61469542 | 616415594 | 10.028 | 9.2312 |
| NC_088855.1 | 61039741 | 613842652 | 10.0564 | 9.1116 |
| NC_088856.1 | 57946171 | 469588741 | 8.1039 | 10.1241 |
| NC_088857.1 | 57274926 | 554025945 | 9.6731 | 9.3278 |
| NC_088858.1 | 56905015 | 573458449 | 10.0775 | 9.1119 |
| NC_088859.1 | 53672946 | 564216776 | 10.5121 | 10.4669 |
| NC_088860.1 | 51133819 | 459654761 | 8.9893 | 9.8512 |
| NC_088861.1 | 50364239 | 345211210 | 6.8543 | 9.2949 |
| NC_088862.1 | 37310742 | 293522387 | 7.867 | 9.4375 |
| NW_027062568.1 | 15579 | 95453 | 6.127 | 5.8921 |
| NW_027062569.1 | 16498 | 108565 | 6.5805 | 13.2046 |
| NW_027062570.1 | 4000 | 179790 | 44.9475 | 35.8997 |
| NW_027062571.1 | 36893 | 6321 | 0.1713 | 0.7342 |
| NW_027062572.1 | 51000 | 38698 | 0.7588 | 2.0273 |
| NW_027062573.1 | 2000 | 113907 | 56.9535 | 43.6992 |
| NW_027062574.1 | 37061 | 5819 | 0.157 | 0.5256 |
| NW_027062575.1 | 49428 | 297463 | 6.0181 | 11.1511 |
| NW_027062576.1 | 49232 | 159420 | 3.2381 | 7.7238 |
| NW_027062577.1 | 17087 | 127479 | 7.4606 | 5.9469 |
| NW_027062578.1 | 34507 | 466427 | 13.5169 | 7.5258 |
| NW_027062579.1 | 64000 | 387035 | 6.0474 | 7.6324 |
| NW_027062580.1 | 24229 | 99851 | 4.1211 | 5.7158 |
| NW_027062581.1 | 5000 | 47535 | 9.507 | 10.9833 |
| NW_027062582.1 | 18808 | 149817 | 7.9656 | 9.2728 |
| NW_027062583.1 | 1000 | 0 | 0 | 0 |
| NW_027062584.1 | 74000 | 13456 | 0.1818 | 1.1917 |
| NW_027062585.1 | 39334 | 219997 | 5.593 | 5.7298 |
| NW_027062586.1 | 258015 | 592224 | 2.2953 | 5.5181 |