Input data and parameters
QualiMap command line
| qualimap bamqc -bam zr3644_7.deduplicated.sorted.bam -nw 400 -hm 3 |
Alignment
| Command line: | "bismark -1 zr3644_7_R1_val_1_val_1_val_1.fq.gz -2 zr3644_7_R2_val_2_val_2_val_2.fq.gz --genome BismarkIndex --bam --score_min L,0,-0.8 --non_directional --prefix zr3644_7 --multicore 3" |
| Draw chromosome limits: | no |
| Analyze overlapping paired-end reads: | yes |
| Program: | Bismark (v0.24.2) |
| Analysis date: | Wed Apr 16 13:05:17 GMT 2025 |
| Size of a homopolymer: | 3 |
| Skip duplicate alignments: | no |
| Number of windows: | 400 |
| BAM file: | zr3644_7.deduplicated.sorted.bam |
Summary
Globals
| Reference size | 563,985,803 |
| Number of reads | 91,564,948 |
| Mapped reads | 91,564,948 / 100% |
| Unmapped reads | 0 / 0% |
| Mapped paired reads | 91,564,948 / 100% |
| Mapped reads, first in pair | 45,782,474 / 50% |
| Mapped reads, second in pair | 45,782,474 / 50% |
| Mapped reads, both in pair | 91,564,948 / 100% |
| Mapped reads, singletons | 0 / 0% |
| Secondary alignments | 0 |
| Read min/max/mean length | 20 / 115 / 106.01 |
| Overlapping read pairs | 38,199,434 / 83.44% |
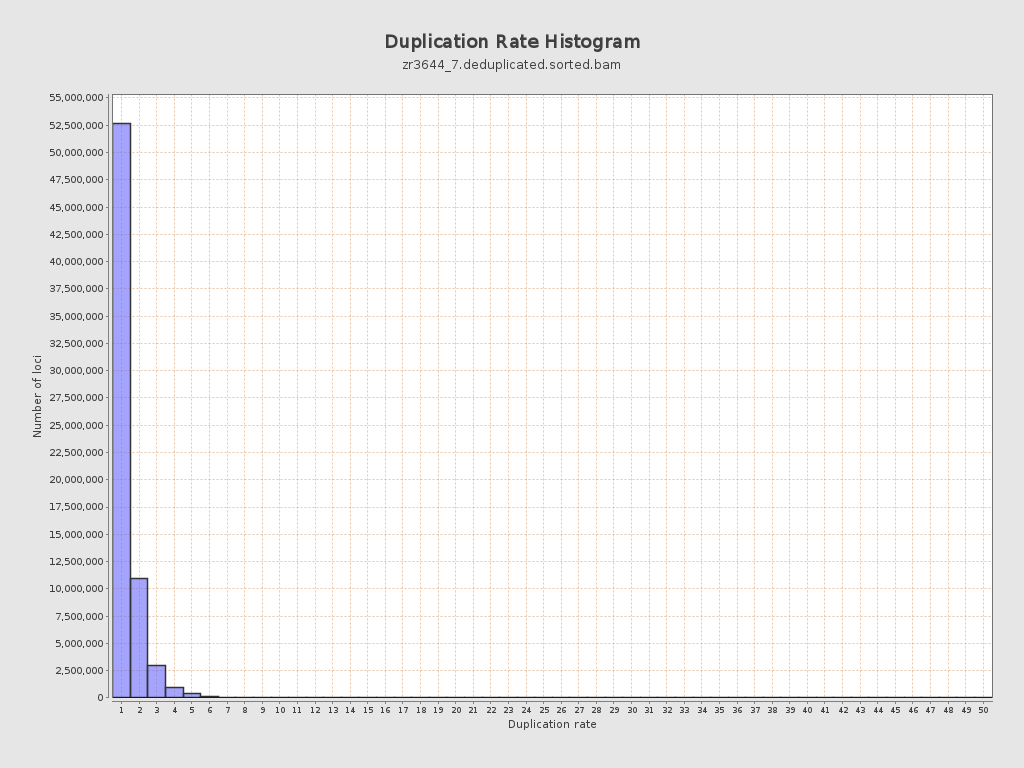
| Duplicated reads (estimated) | 23,360,886 / 25.51% |
| Duplication rate | 22.81% |
| Clipped reads | 0 / 0% |
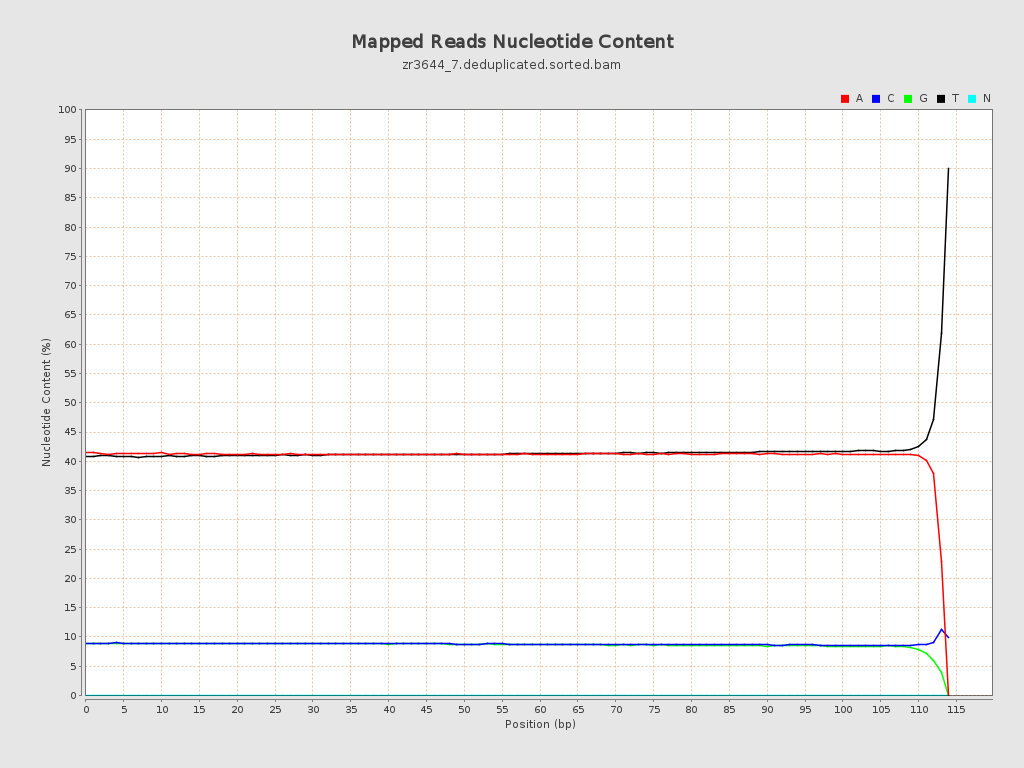
ACGT Content
| Number/percentage of A's | 3,963,529,394 / 41.07% |
| Number/percentage of C's | 848,526,519 / 8.79% |
| Number/percentage of T's | 4,002,039,155 / 41.47% |
| Number/percentage of G's | 835,984,342 / 8.66% |
| Number/percentage of N's | 74,072 / 0% |
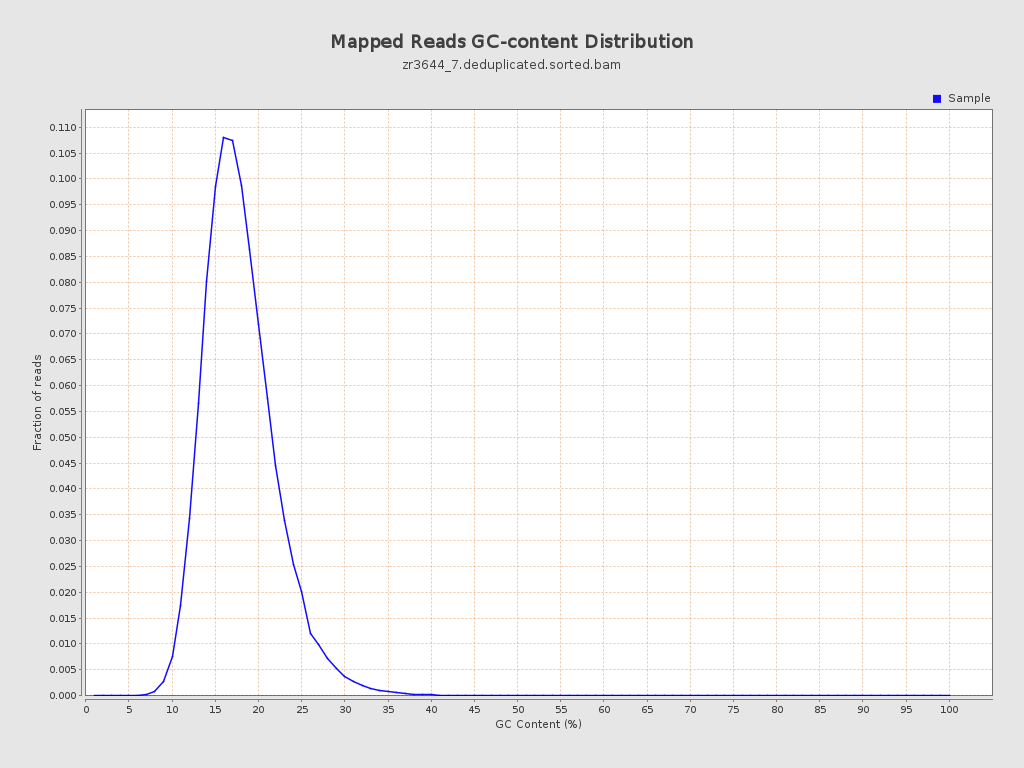
| GC Percentage | 17.46% |
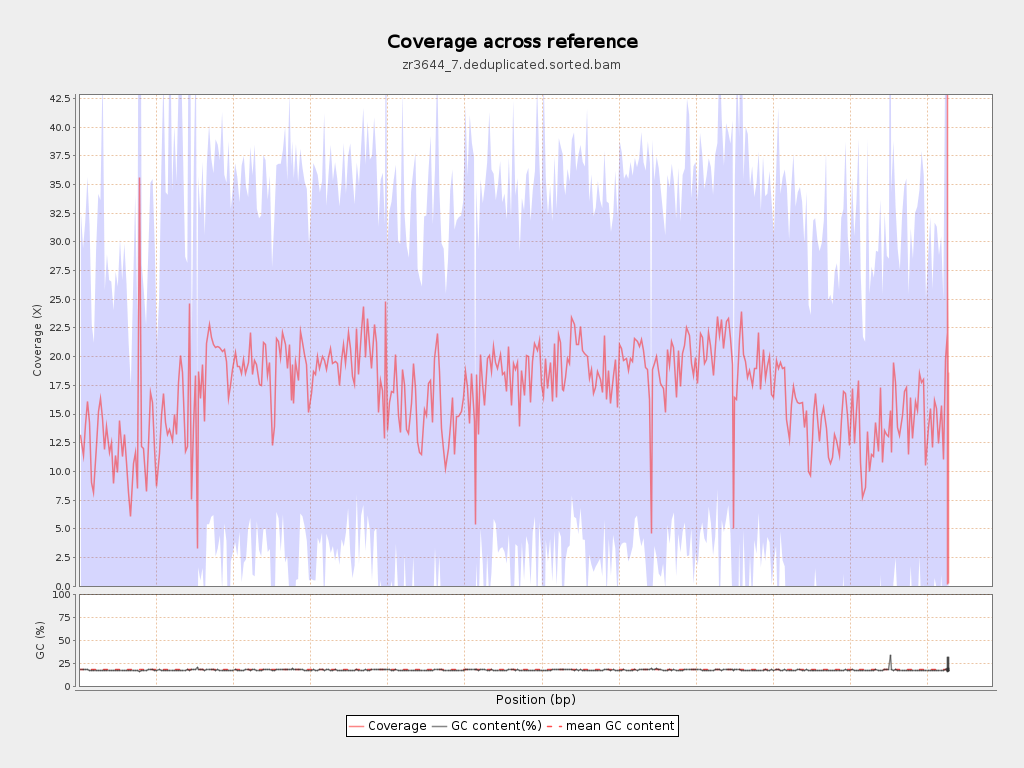
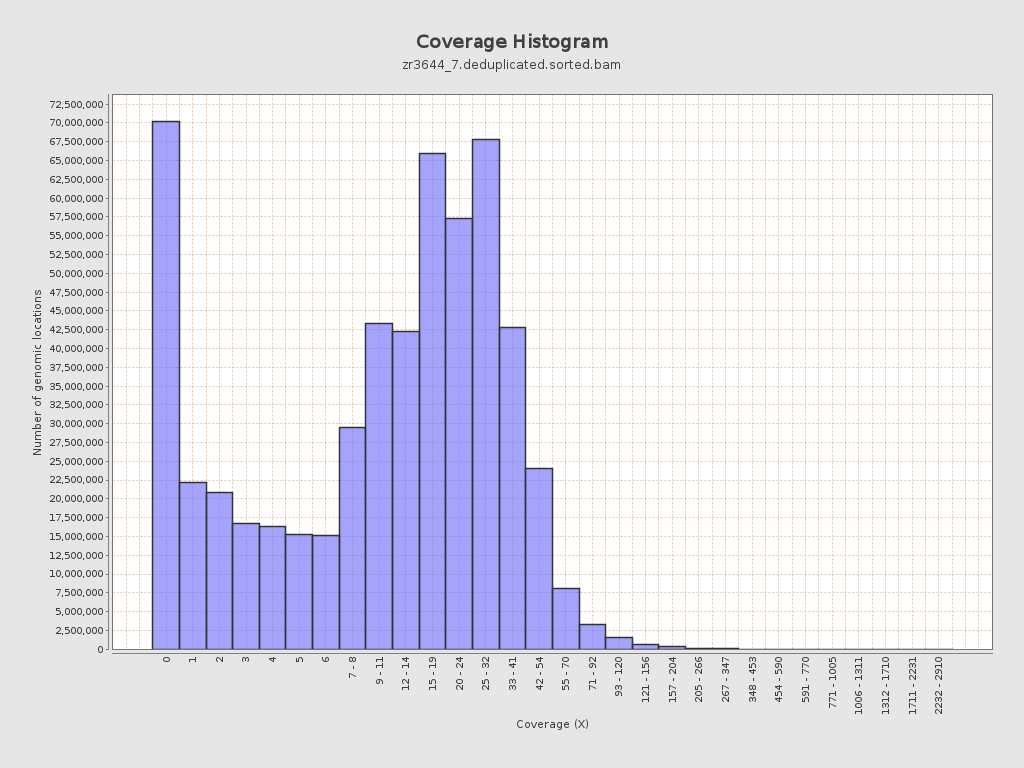
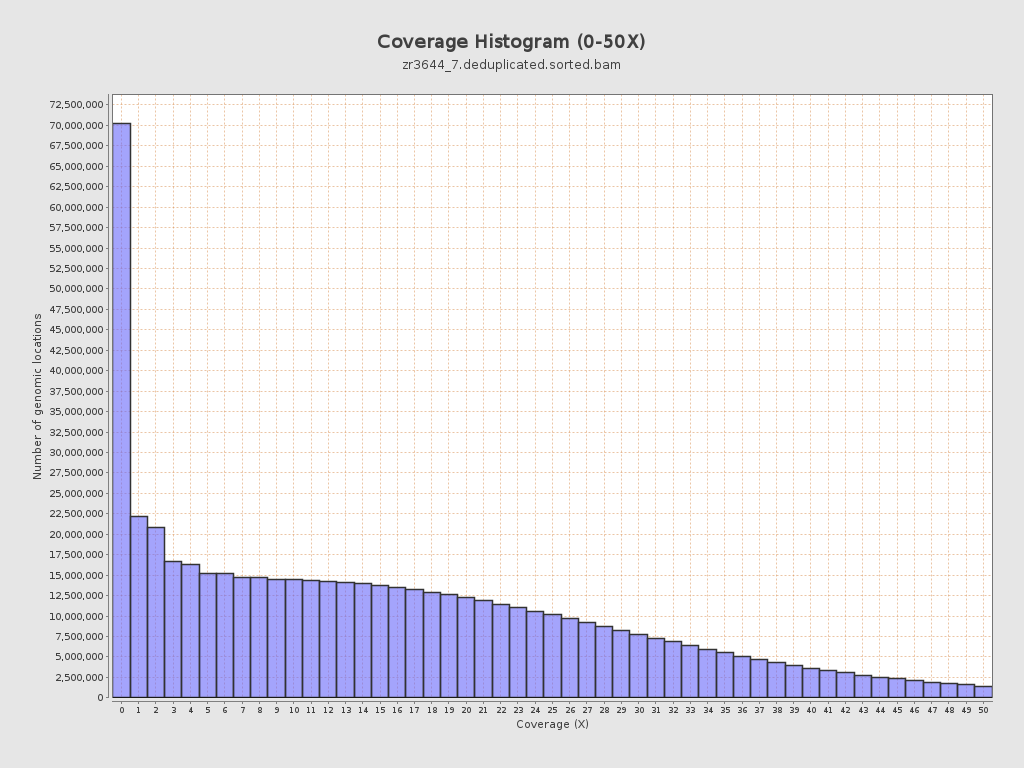
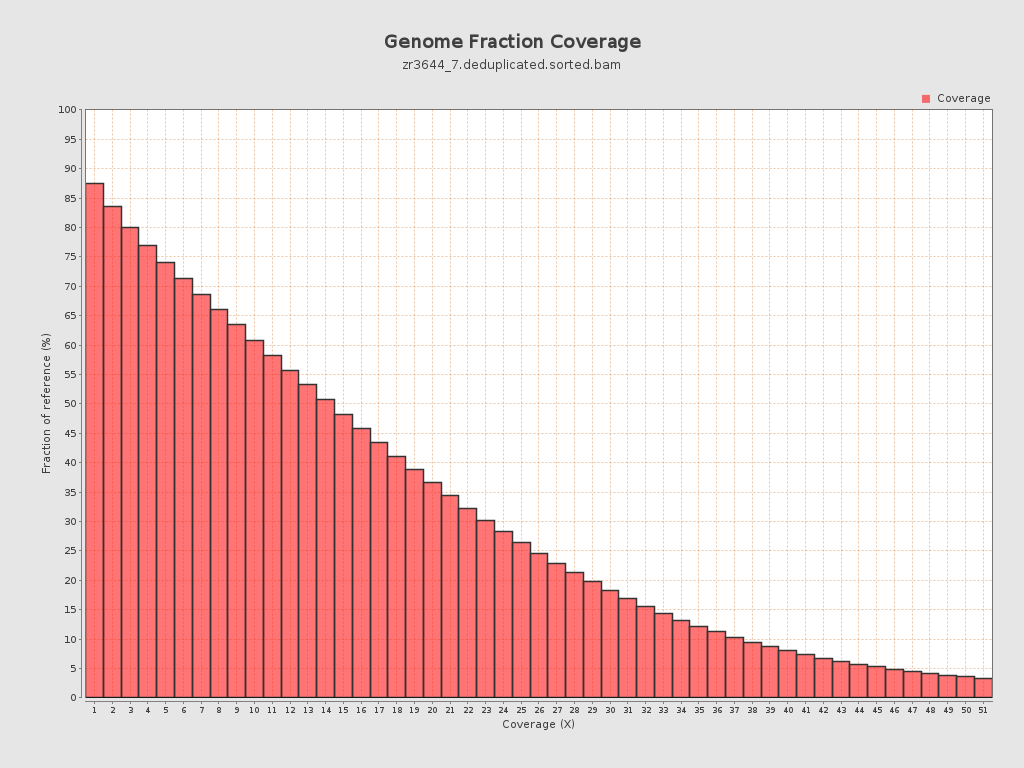
Coverage
| Mean | 17.1883 |
| Standard Deviation | 17.5892 |
| Mean (paired-end reads overlap ignored) | 12.35 |
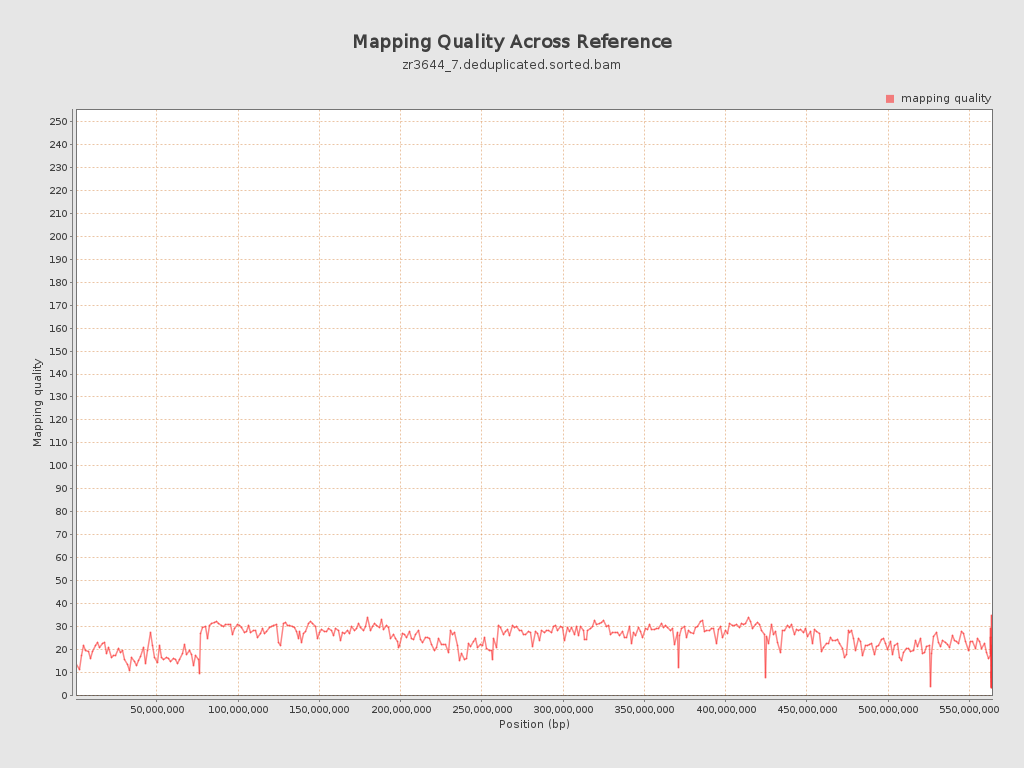
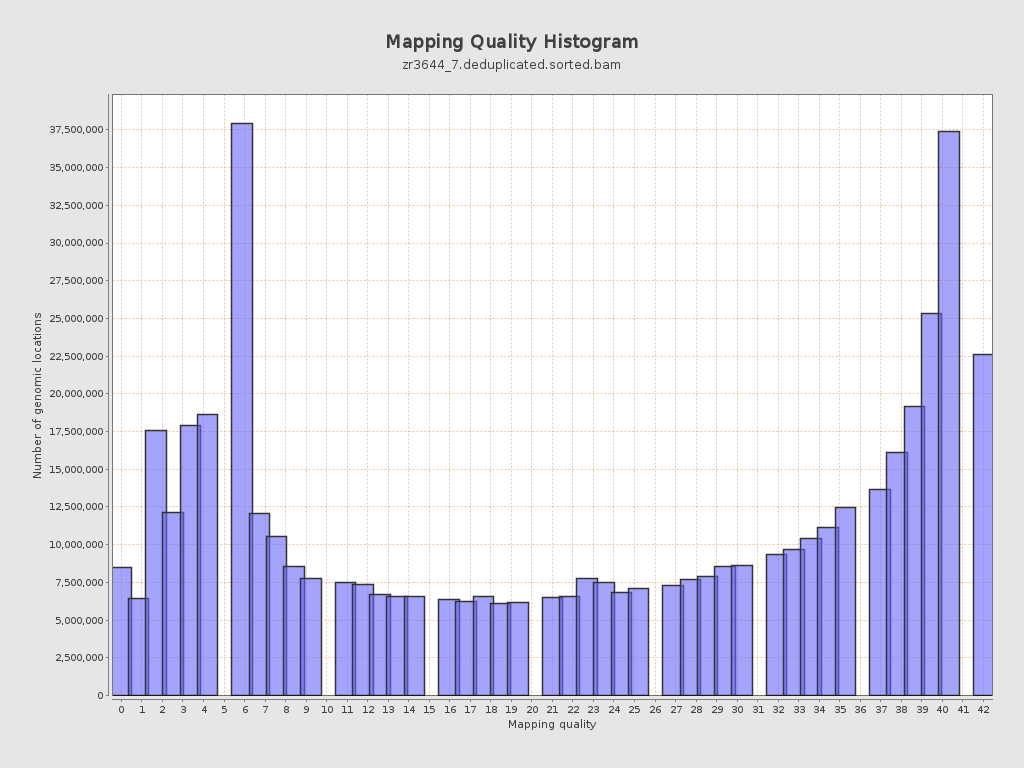
Mapping Quality
| Mean Mapping Quality | 24.55 |
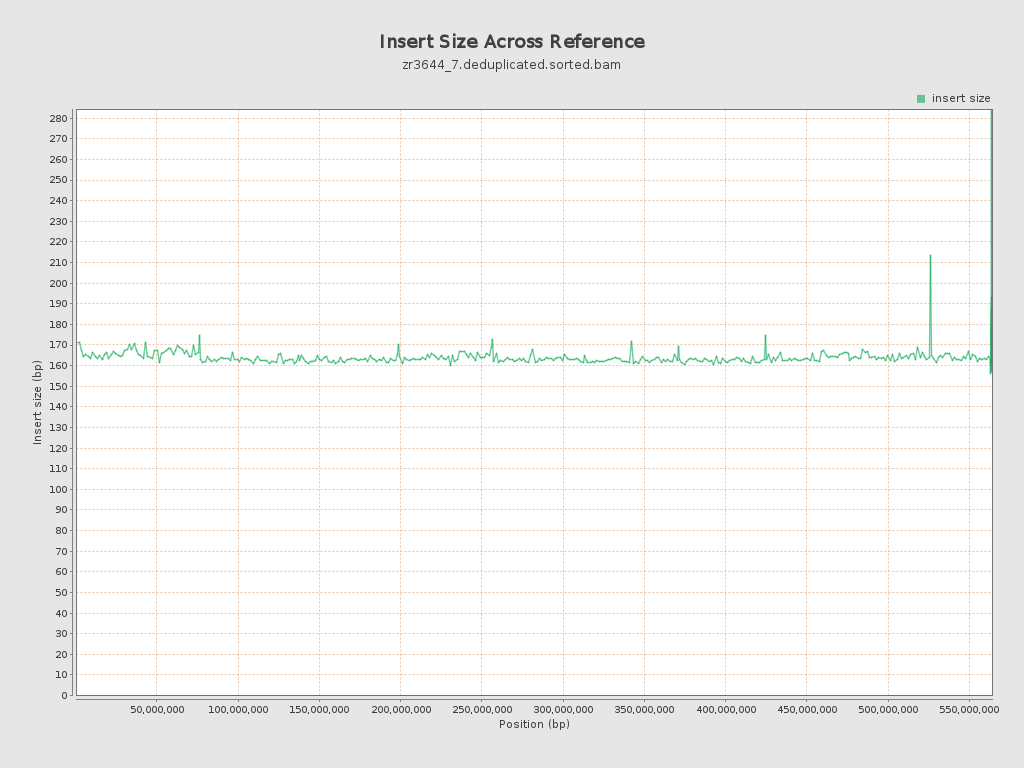
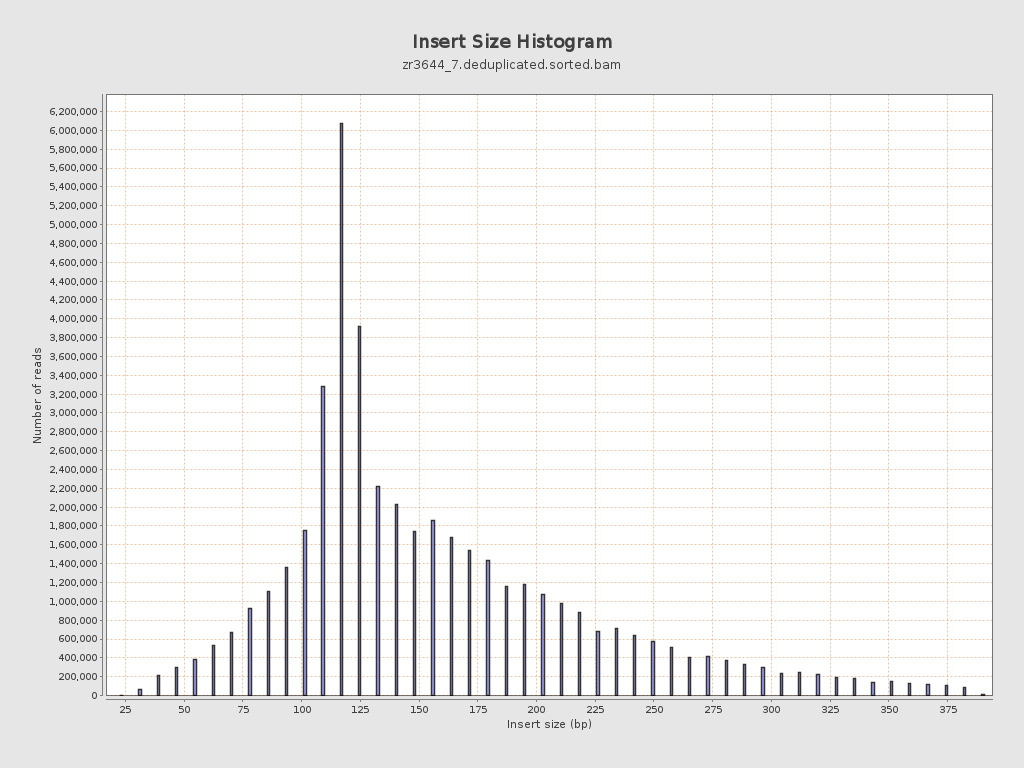
Insert size
| Mean | 163.53 |
| Standard Deviation | 72.75 |
| P25/Median/P75 | 118 / 141 / 195 |
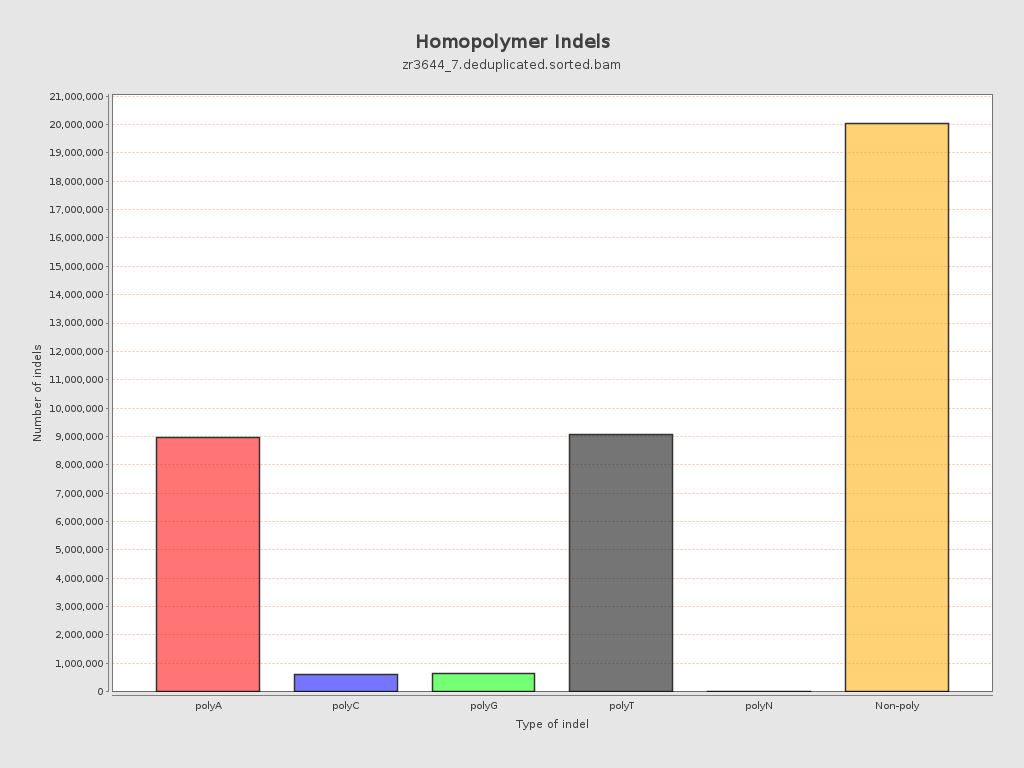
Mismatches and indels
| General error rate | 19.46% |
| Mismatches | 1,830,634,671 |
| Insertions | 20,734,897 |
| Mapped reads with at least one insertion | 17.11% |
| Deletions | 18,574,455 |
| Mapped reads with at least one deletion | 16.76% |
| Homopolymer indels | 49.01% |
Chromosome stats
| Name | Length | Mapped bases | Mean coverage | Standard deviation |
| NC_088853.1 | 76070991 | 1018795692 | 13.3927 | 20.7452 |
| NC_088854.1 | 61469542 | 1187224246 | 19.314 | 16.4187 |
| NC_088855.1 | 61039741 | 1188066853 | 19.4638 | 16.3528 |
| NC_088856.1 | 57946171 | 904507513 | 15.6094 | 18.0678 |
| NC_088857.1 | 57274926 | 1067922586 | 18.6456 | 16.555 |
| NC_088858.1 | 56905015 | 1108439659 | 19.4788 | 15.9949 |
| NC_088859.1 | 53672946 | 1080529829 | 20.1317 | 16.326 |
| NC_088860.1 | 51133819 | 893449836 | 17.4728 | 17.9301 |
| NC_088861.1 | 50364239 | 669417087 | 13.2915 | 16.606 |
| NC_088862.1 | 37310742 | 569508932 | 15.2639 | 17.2898 |
| NW_027062568.1 | 15579 | 215576 | 13.8376 | 10.9801 |
| NW_027062569.1 | 16498 | 361426 | 21.9073 | 22.9621 |
| NW_027062570.1 | 4000 | 363318 | 90.8295 | 76.1837 |
| NW_027062571.1 | 36893 | 15987 | 0.4333 | 1.9634 |
| NW_027062572.1 | 51000 | 32651 | 0.6402 | 1.7669 |
| NW_027062573.1 | 2000 | 199032 | 99.516 | 89.7107 |
| NW_027062574.1 | 37061 | 6959 | 0.1878 | 1.1235 |
| NW_027062575.1 | 49428 | 641852 | 12.9856 | 21.8646 |
| NW_027062576.1 | 49232 | 313136 | 6.3604 | 11.9329 |
| NW_027062577.1 | 17087 | 244526 | 14.3106 | 10.0921 |
| NW_027062578.1 | 34507 | 909516 | 26.3574 | 12.8191 |
| NW_027062579.1 | 64000 | 732476 | 11.4449 | 13.3445 |
| NW_027062580.1 | 24229 | 450979 | 18.6132 | 16.2526 |
| NW_027062581.1 | 5000 | 26506 | 5.3012 | 12.3678 |
| NW_027062582.1 | 18808 | 238440 | 12.6776 | 9.6127 |
| NW_027062583.1 | 1000 | 228 | 0.228 | 0.4195 |
| NW_027062584.1 | 74000 | 22342 | 0.3019 | 1.552 |
| NW_027062585.1 | 39334 | 428552 | 10.8952 | 10.0204 |
| NW_027062586.1 | 258015 | 880668 | 3.4132 | 9.8975 |