Input data and parameters
QualiMap command line
| qualimap bamqc -bam zr3644_6.deduplicated.sorted.bam -nw 400 -hm 3 |
Alignment
| Command line: | "bismark -1 zr3644_6_R1_val_1_val_1_val_1.fq.gz -2 zr3644_6_R2_val_2_val_2_val_2.fq.gz --genome BismarkIndex --bam --score_min L,0,-0.8 --non_directional --prefix zr3644_6 --multicore 3" |
| Draw chromosome limits: | no |
| Analyze overlapping paired-end reads: | yes |
| Program: | Bismark (v0.24.2) |
| Analysis date: | Wed Apr 16 07:54:45 GMT 2025 |
| Size of a homopolymer: | 3 |
| Skip duplicate alignments: | no |
| Number of windows: | 400 |
| BAM file: | zr3644_6.deduplicated.sorted.bam |
Summary
Globals
| Reference size | 563,985,803 |
| Number of reads | 59,679,730 |
| Mapped reads | 59,679,730 / 100% |
| Unmapped reads | 0 / 0% |
| Mapped paired reads | 59,679,730 / 100% |
| Mapped reads, first in pair | 29,839,865 / 50% |
| Mapped reads, second in pair | 29,839,865 / 50% |
| Mapped reads, both in pair | 59,679,730 / 100% |
| Mapped reads, singletons | 0 / 0% |
| Secondary alignments | 0 |
| Read min/max/mean length | 20 / 115 / 105.7 |
| Overlapping read pairs | 25,239,763 / 84.58% |
| Duplicated reads (estimated) | 11,536,760 / 19.33% |
| Duplication rate | 17.46% |
| Clipped reads | 0 / 0% |
ACGT Content
| Number/percentage of A's | 2,574,241,018 / 41.04% |
| Number/percentage of C's | 552,991,194 / 8.82% |
| Number/percentage of T's | 2,600,057,371 / 41.45% |
| Number/percentage of G's | 544,823,431 / 8.69% |
| Number/percentage of N's | 47,585 / 0% |
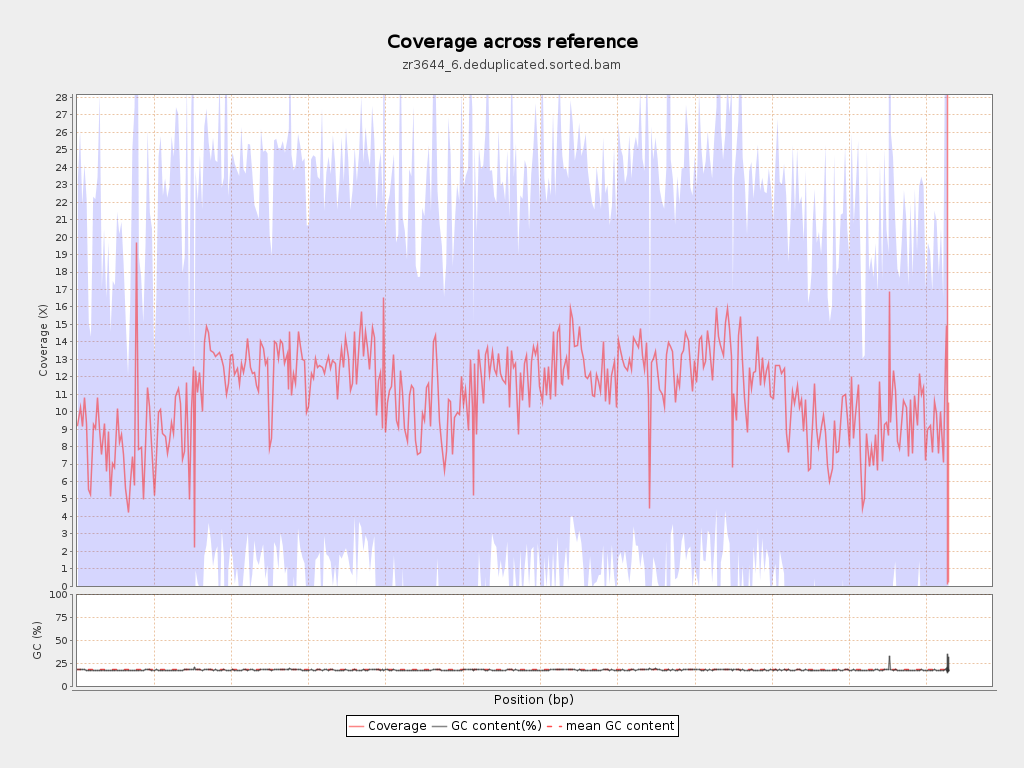
| GC Percentage | 17.5% |
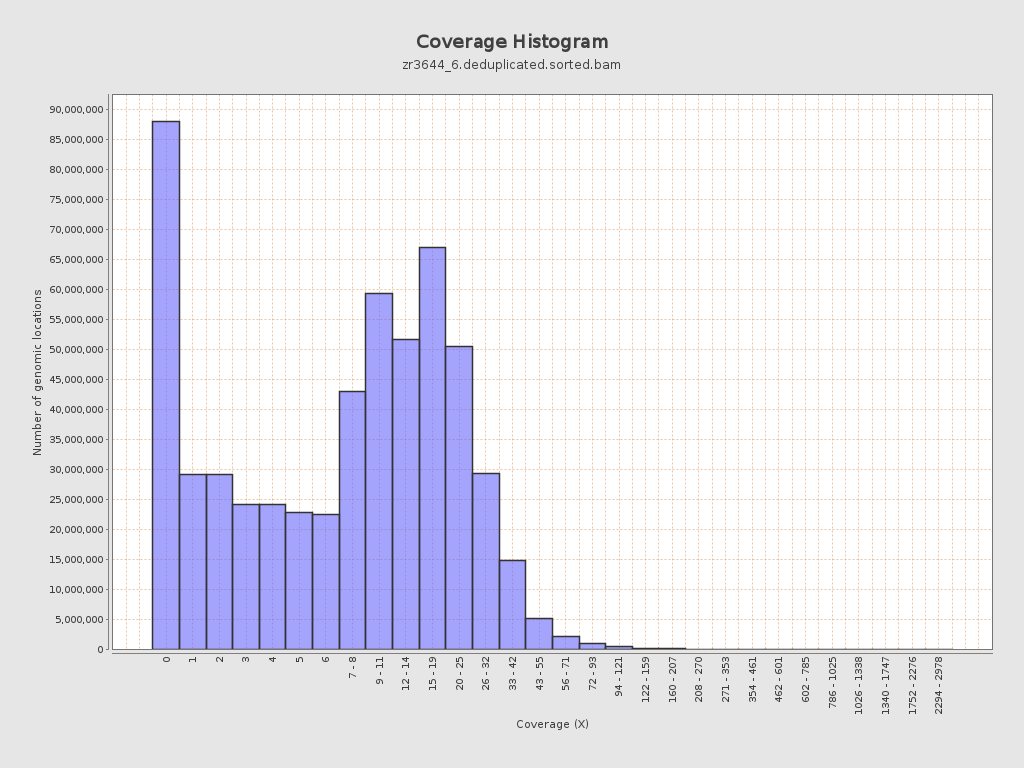
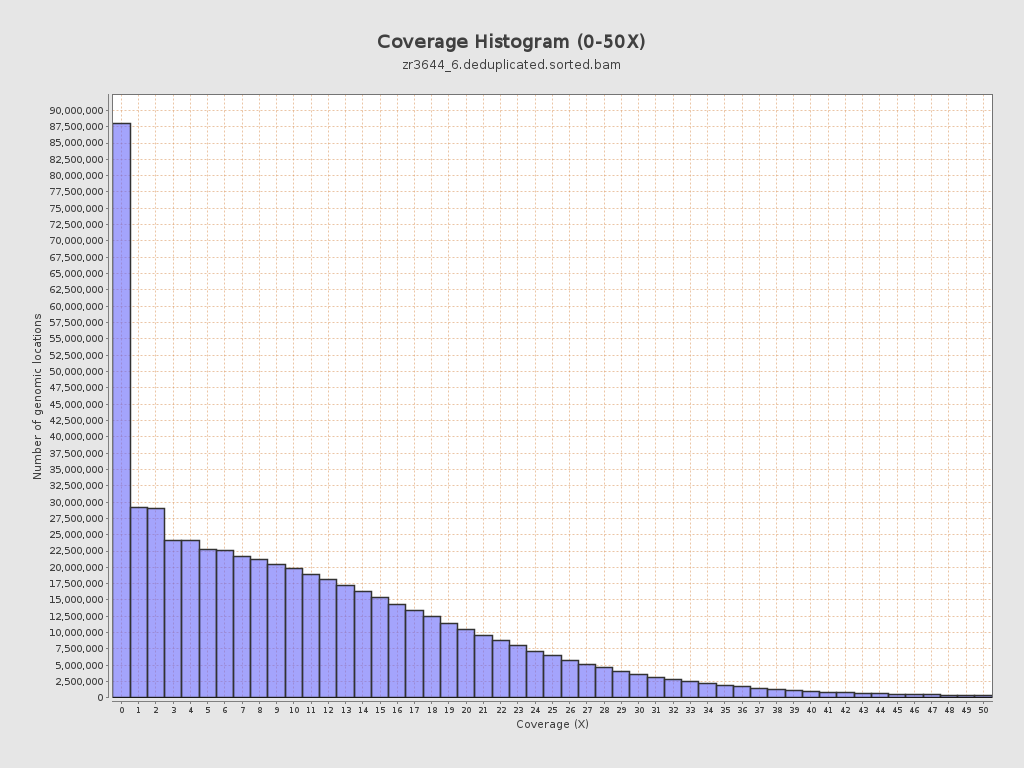
Coverage
| Mean | 11.1709 |
| Standard Deviation | 12.1346 |
| Mean (paired-end reads overlap ignored) | 7.96 |
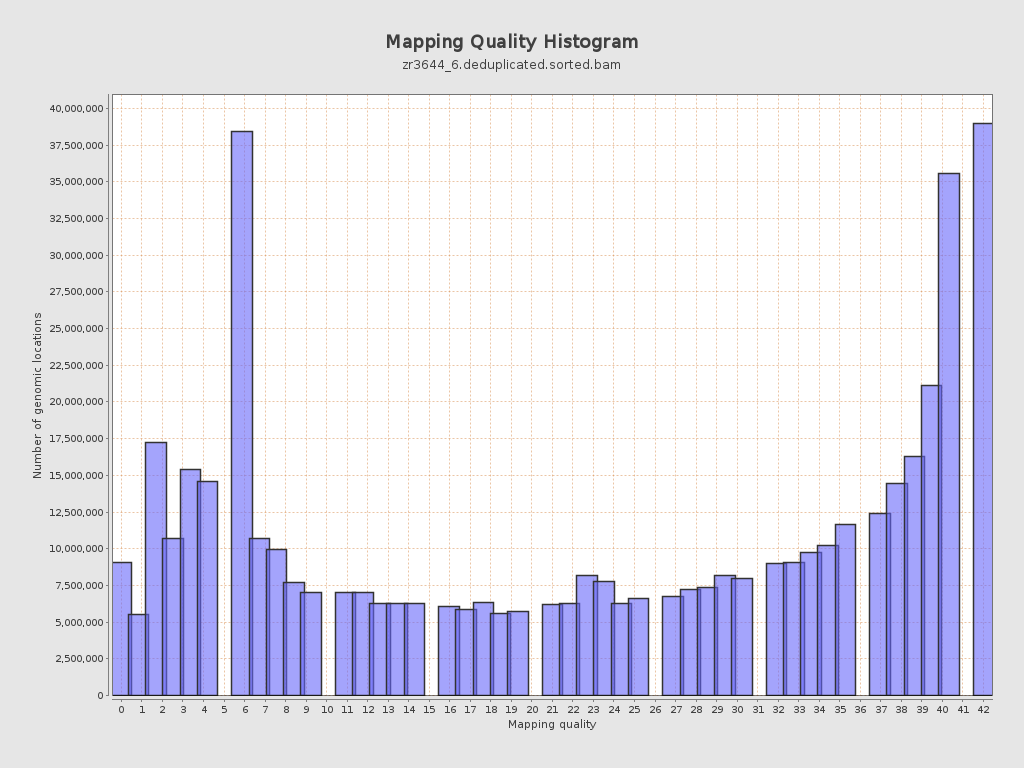
Mapping Quality
| Mean Mapping Quality | 24.78 |
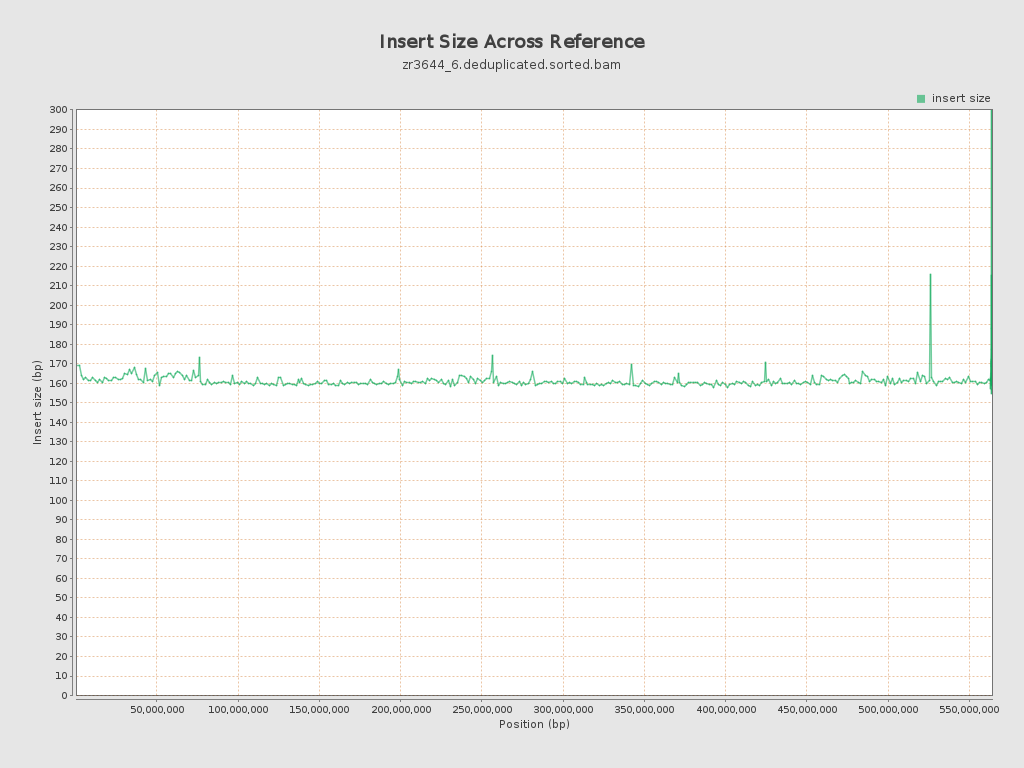
Insert size
| Mean | 160.75 |
| Standard Deviation | 70.53 |
| P25/Median/P75 | 117 / 139 / 192 |
Mismatches and indels
| General error rate | 19.48% |
| Mismatches | 1,191,326,340 |
| Insertions | 13,308,121 |
| Mapped reads with at least one insertion | 16.87% |
| Deletions | 11,882,080 |
| Mapped reads with at least one deletion | 16.46% |
| Homopolymer indels | 49.06% |
Chromosome stats
| Name | Length | Mapped bases | Mean coverage | Standard deviation |
| NC_088853.1 | 76070991 | 650788837 | 8.555 | 13.4985 |
| NC_088854.1 | 61469542 | 774970289 | 12.6074 | 11.5612 |
| NC_088855.1 | 61039741 | 771237393 | 12.635 | 11.2515 |
| NC_088856.1 | 57946171 | 595056242 | 10.2691 | 12.6327 |
| NC_088857.1 | 57274926 | 702347776 | 12.2627 | 11.8327 |
| NC_088858.1 | 56905015 | 726927895 | 12.7744 | 11.1506 |
| NC_088859.1 | 53672946 | 705737333 | 13.1488 | 12.5458 |
| NC_088860.1 | 51133819 | 572794896 | 11.2019 | 11.6239 |
| NC_088861.1 | 50364239 | 432559625 | 8.5886 | 11.552 |
| NC_088862.1 | 37310742 | 363709500 | 9.7481 | 11.6193 |
| NW_027062568.1 | 15579 | 127549 | 8.1872 | 7.582 |
| NW_027062569.1 | 16498 | 222632 | 13.4945 | 15.3741 |
| NW_027062570.1 | 4000 | 262164 | 65.541 | 58.7414 |
| NW_027062571.1 | 36893 | 5530 | 0.1499 | 0.7913 |
| NW_027062572.1 | 51000 | 75724 | 1.4848 | 3.2327 |
| NW_027062573.1 | 2000 | 133832 | 66.916 | 53.5285 |
| NW_027062574.1 | 37061 | 3340 | 0.0901 | 0.495 |
| NW_027062575.1 | 49428 | 389358 | 7.8773 | 14.1008 |
| NW_027062576.1 | 49232 | 210714 | 4.28 | 9.7926 |
| NW_027062577.1 | 17087 | 167793 | 9.8199 | 7.5641 |
| NW_027062578.1 | 34507 | 546268 | 15.8306 | 8.7637 |
| NW_027062579.1 | 64000 | 540635 | 8.4474 | 10.8656 |
| NW_027062580.1 | 24229 | 197857 | 8.1661 | 8.2223 |
| NW_027062581.1 | 5000 | 52638 | 10.5276 | 13.0111 |
| NW_027062582.1 | 18808 | 170301 | 9.0547 | 12.0104 |
| NW_027062583.1 | 1000 | 229 | 0.229 | 0.4202 |
| NW_027062584.1 | 74000 | 18203 | 0.246 | 1.4383 |
| NW_027062585.1 | 39334 | 211273 | 5.3713 | 6.4416 |
| NW_027062586.1 | 258015 | 782694 | 3.0335 | 7.1617 |


