Input data and parameters
QualiMap command line
| qualimap bamqc -bam zr3644_5.deduplicated.sorted.bam -nw 400 -hm 3 |
Alignment
| Command line: | "bismark -1 zr3644_5_R1_val_1_val_1_val_1.fq.gz -2 zr3644_5_R2_val_2_val_2_val_2.fq.gz --genome BismarkIndex --bam --score_min L,0,-0.8 --non_directional --prefix zr3644_5 --multicore 2" |
| Draw chromosome limits: | no |
| Analyze overlapping paired-end reads: | yes |
| Program: | Bismark (v0.24.2) |
| Analysis date: | Wed Apr 16 02:43:27 GMT 2025 |
| Size of a homopolymer: | 3 |
| Skip duplicate alignments: | no |
| Number of windows: | 400 |
| BAM file: | zr3644_5.deduplicated.sorted.bam |
Summary
Globals
| Reference size | 563,985,803 |
| Number of reads | 44,350,908 |
| Mapped reads | 44,350,908 / 100% |
| Unmapped reads | 0 / 0% |
| Mapped paired reads | 44,350,908 / 100% |
| Mapped reads, first in pair | 22,175,454 / 50% |
| Mapped reads, second in pair | 22,175,454 / 50% |
| Mapped reads, both in pair | 44,350,908 / 100% |
| Mapped reads, singletons | 0 / 0% |
| Secondary alignments | 0 |
| Read min/max/mean length | 20 / 115 / 105.88 |
| Overlapping read pairs | 18,638,892 / 84.05% |
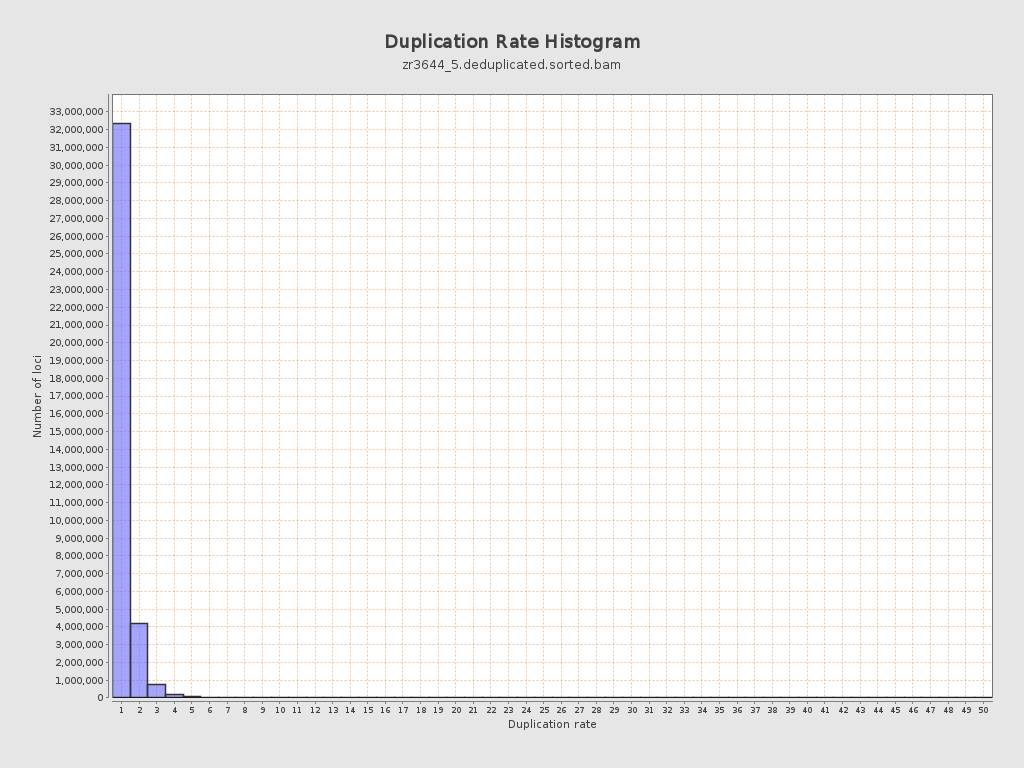
| Duplicated reads (estimated) | 6,766,261 / 15.26% |
| Duplication rate | 13.95% |
| Clipped reads | 0 / 0% |
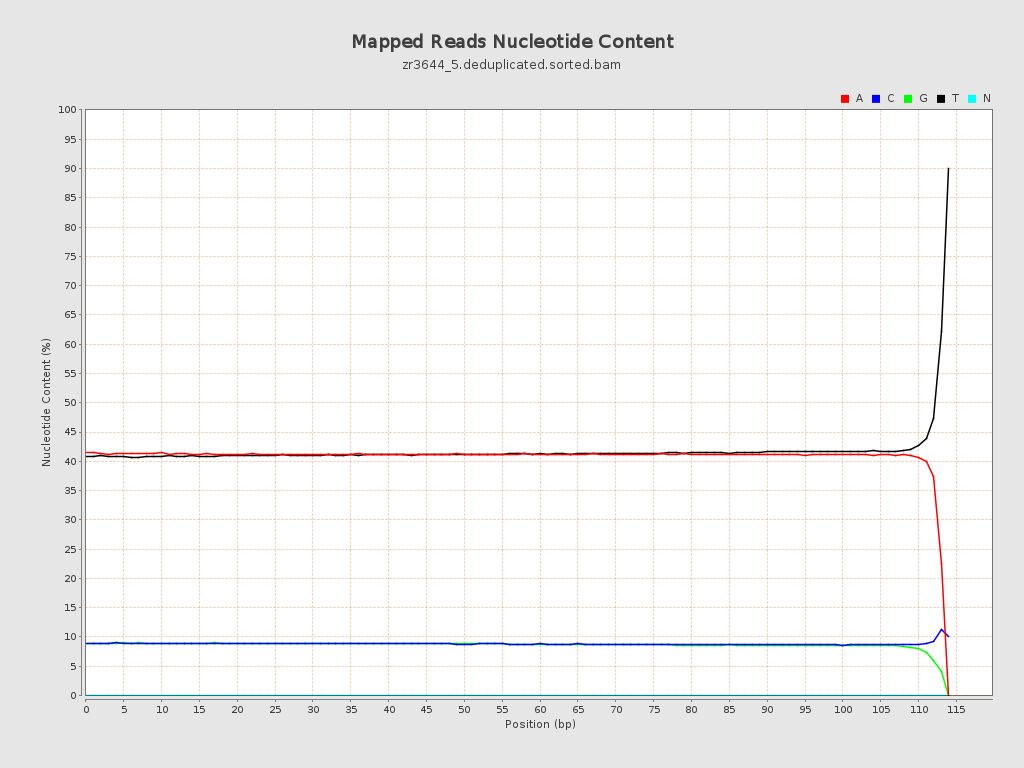
ACGT Content
| Number/percentage of A's | 1,915,969,054 / 41.04% |
| Number/percentage of C's | 411,623,091 / 8.82% |
| Number/percentage of T's | 1,934,700,044 / 41.44% |
| Number/percentage of G's | 406,468,189 / 8.71% |
| Number/percentage of N's | 32,290 / 0% |
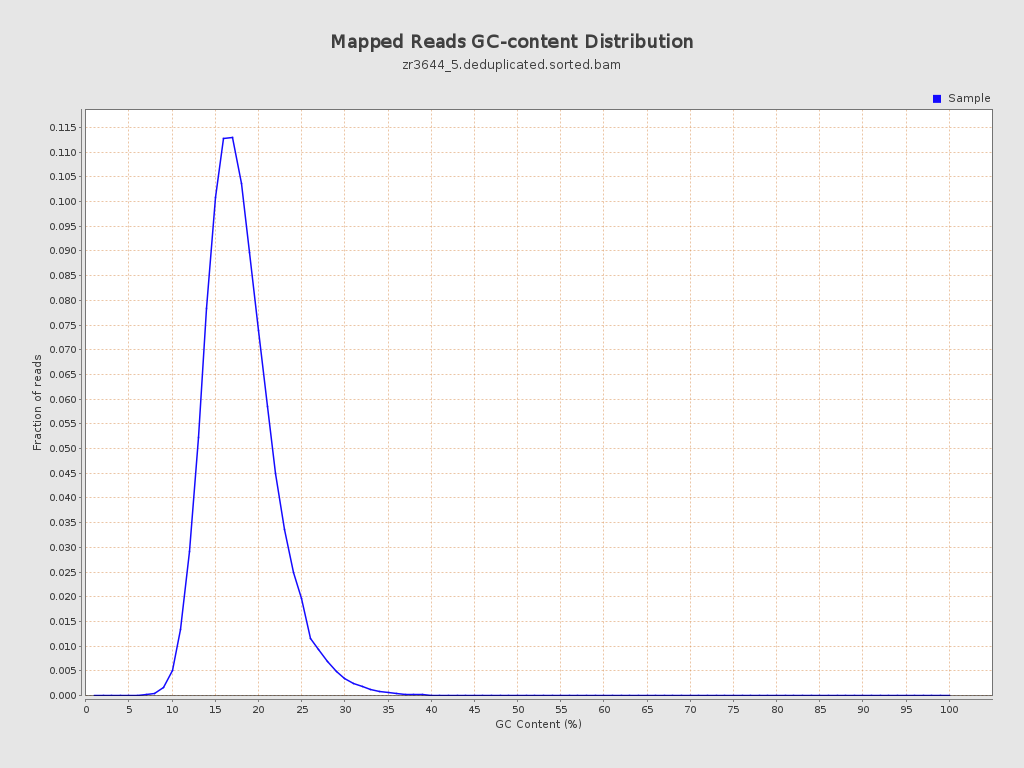
| GC Percentage | 17.52% |
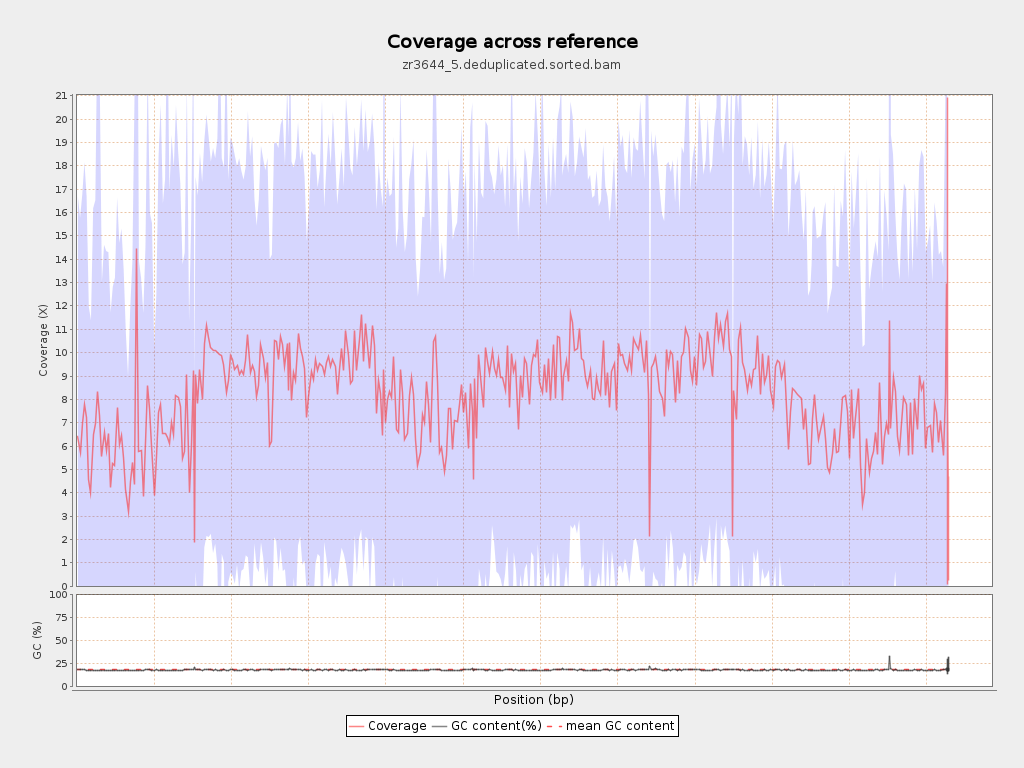
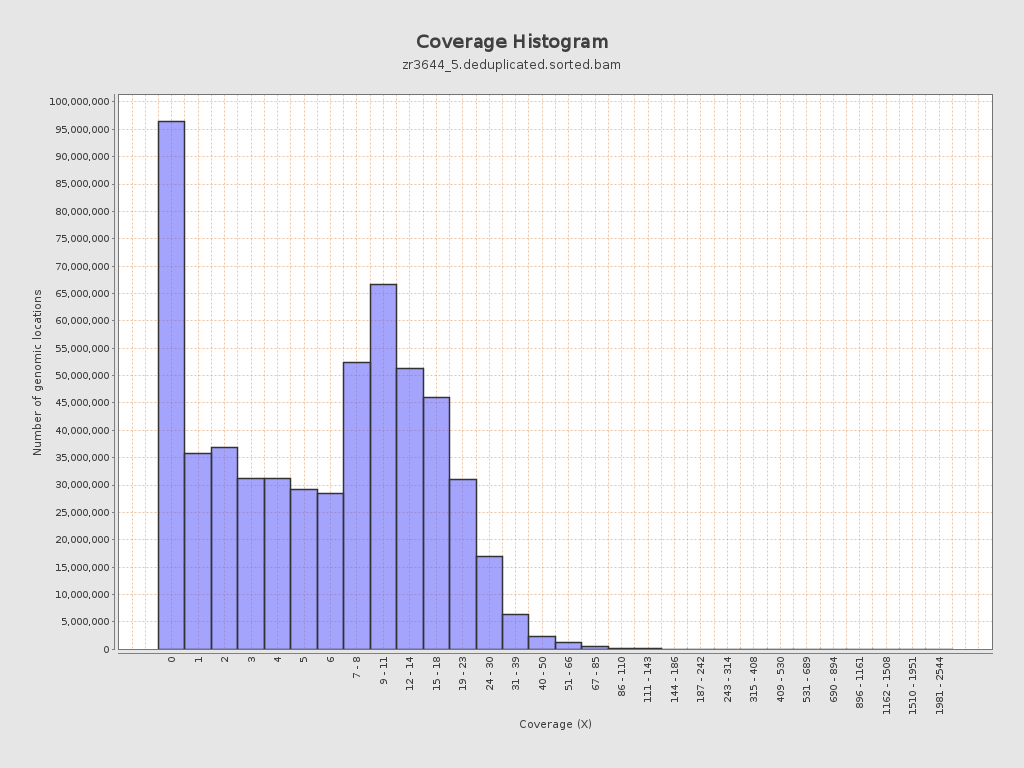
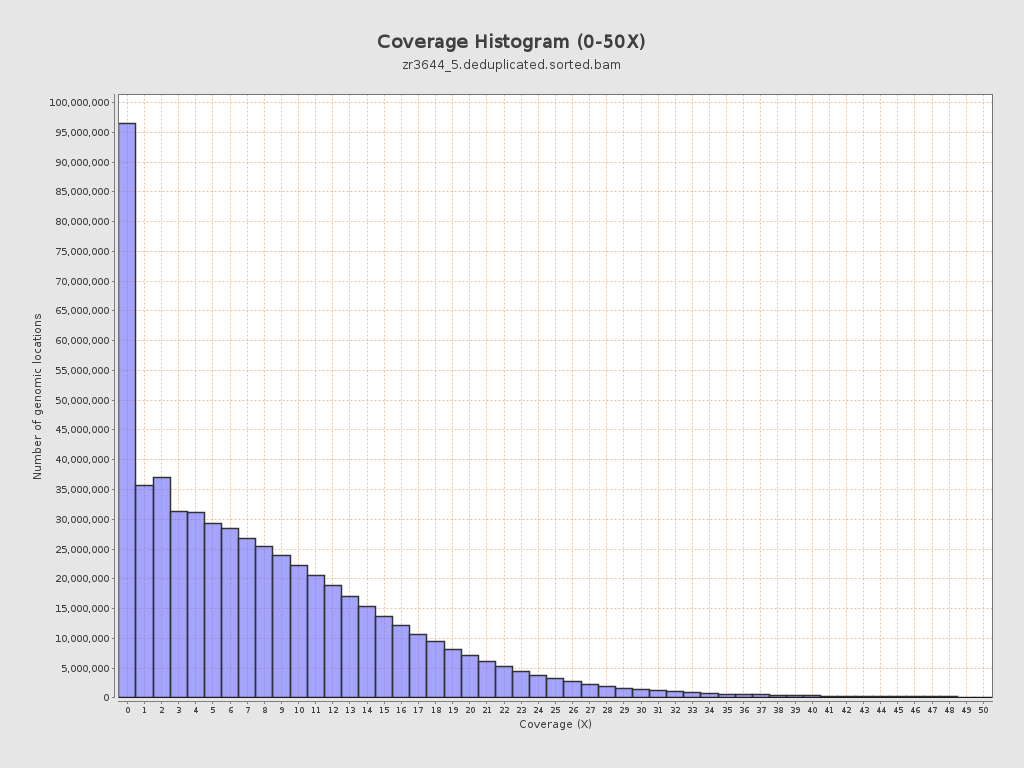
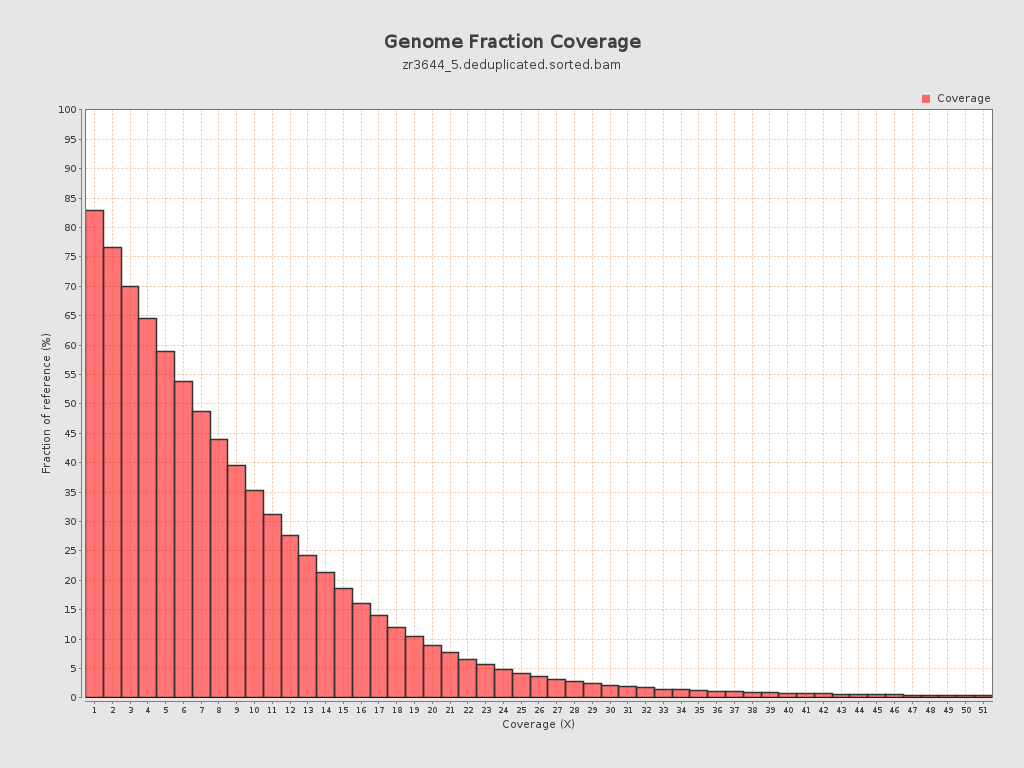
Coverage
| Mean | 8.3153 |
| Standard Deviation | 9.0706 |
| Mean (paired-end reads overlap ignored) | 5.95 |
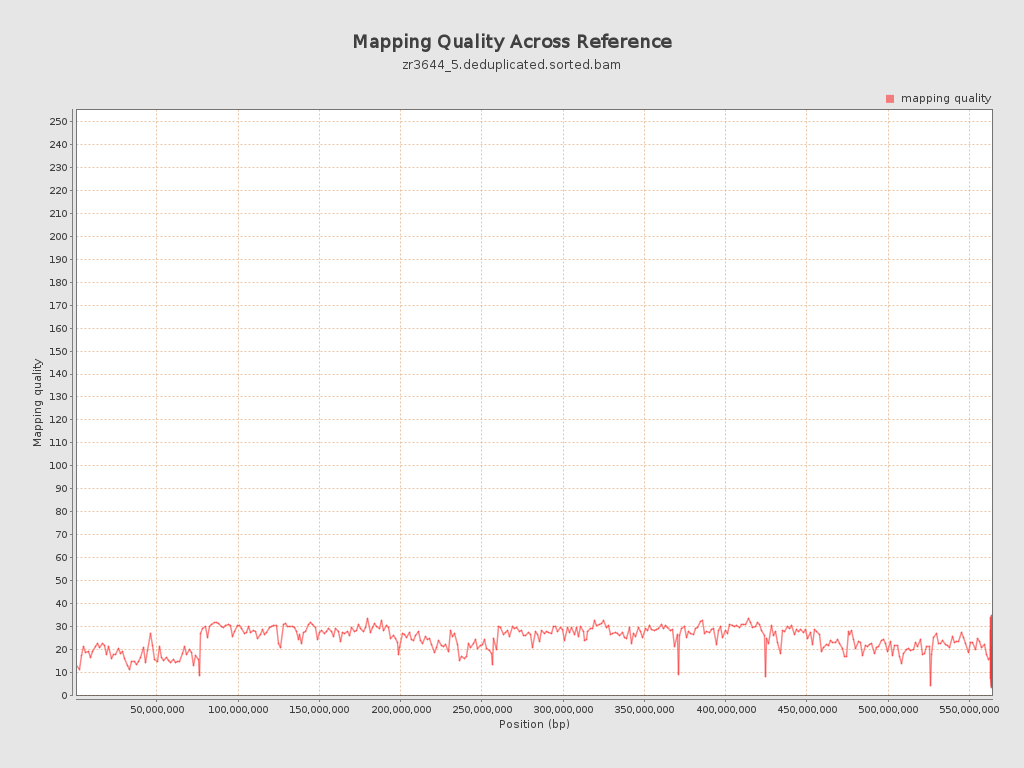
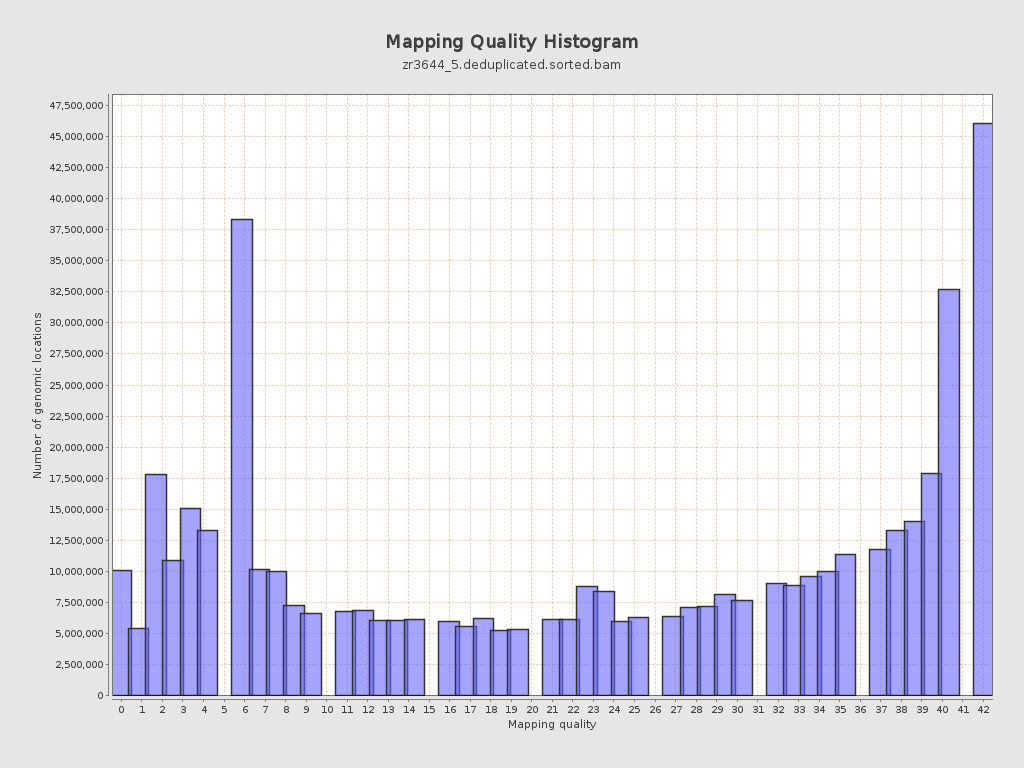
Mapping Quality
| Mean Mapping Quality | 24.26 |
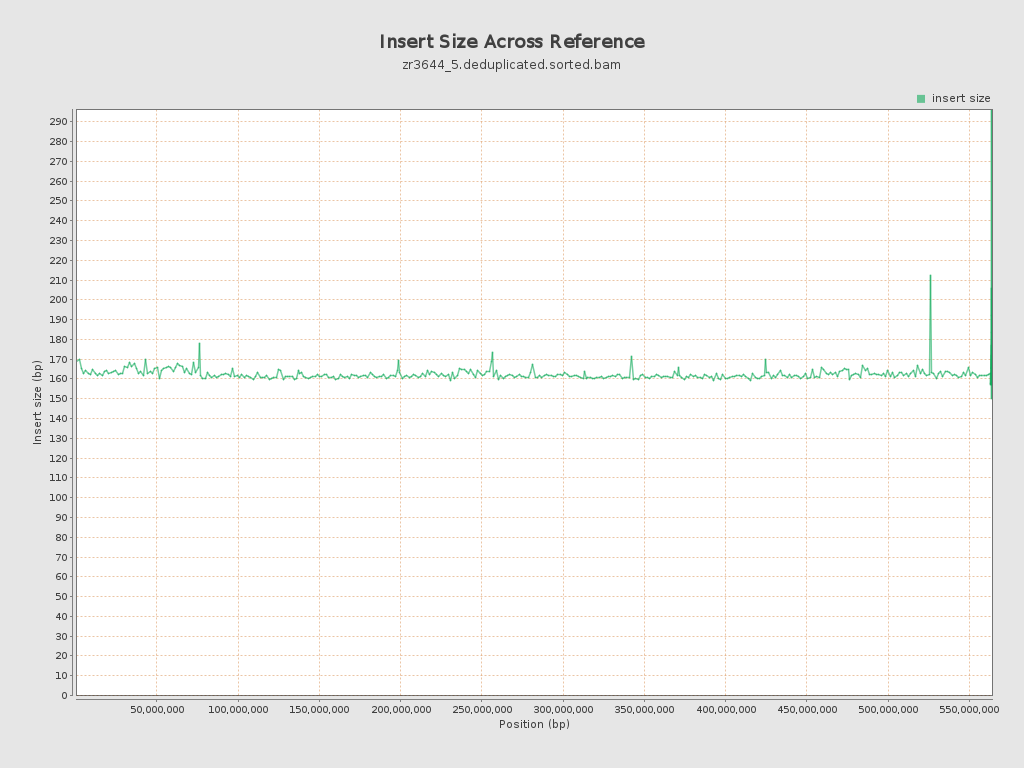
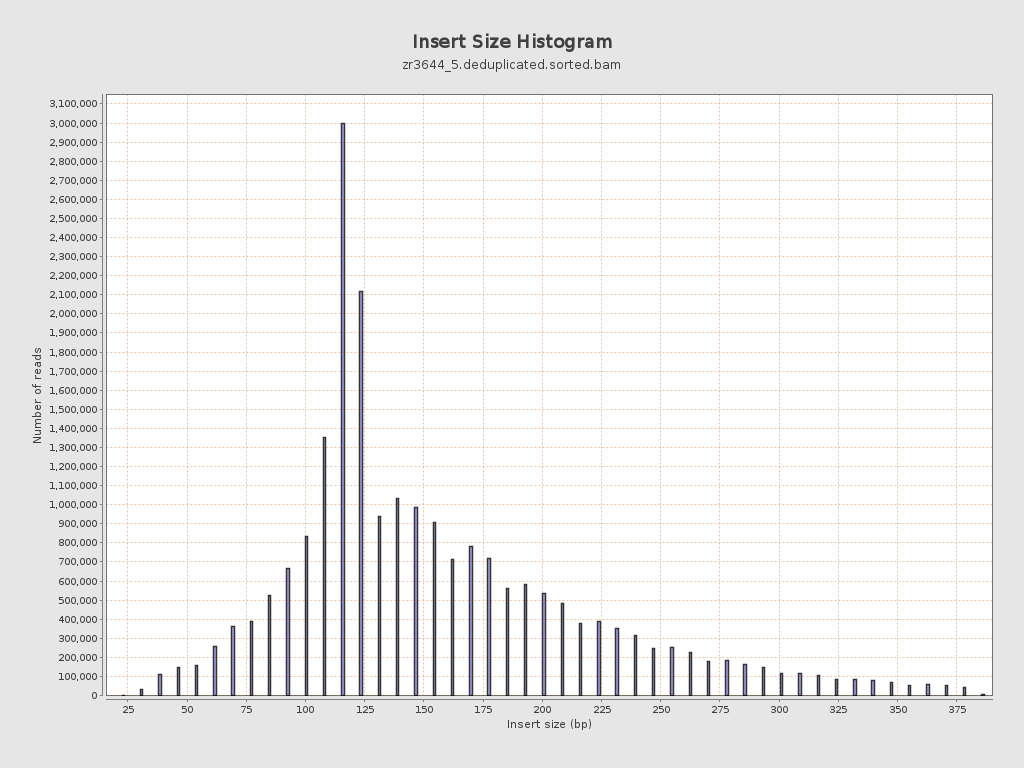
Insert size
| Mean | 162.06 |
| Standard Deviation | 71.32 |
| P25/Median/P75 | 117 / 140 / 193 |
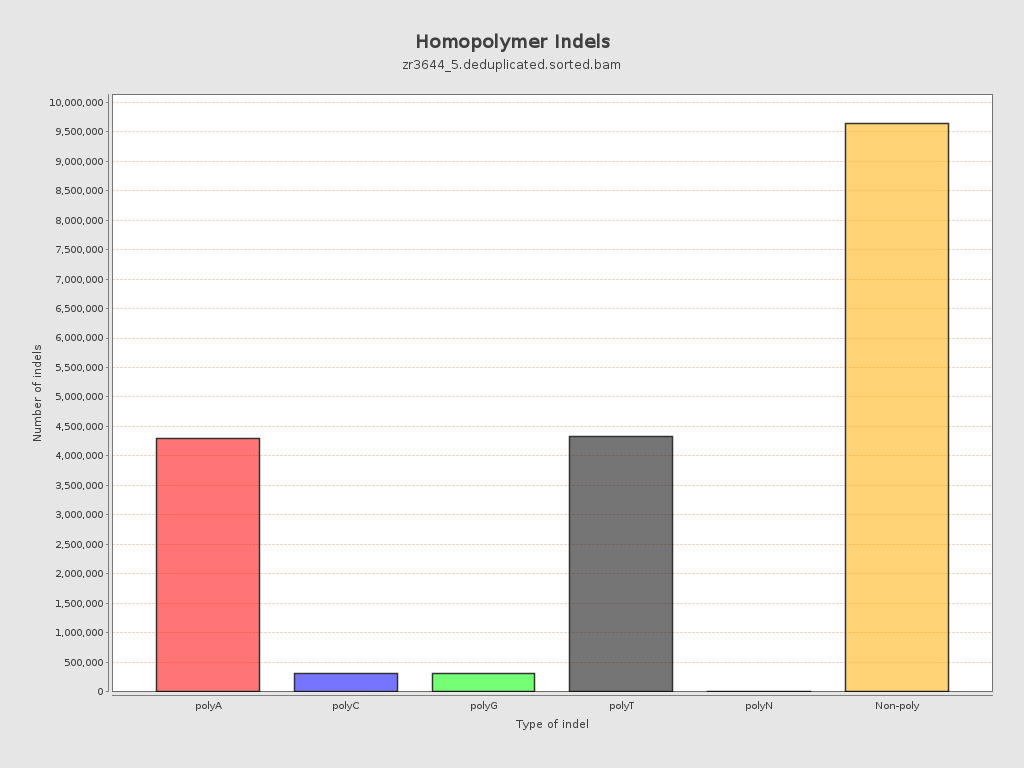
Mismatches and indels
| General error rate | 19.52% |
| Mismatches | 888,363,435 |
| Insertions | 9,955,772 |
| Mapped reads with at least one insertion | 16.98% |
| Deletions | 8,907,166 |
| Mapped reads with at least one deletion | 16.61% |
| Homopolymer indels | 48.88% |
Chromosome stats
| Name | Length | Mapped bases | Mean coverage | Standard deviation |
| NC_088853.1 | 76070991 | 483841706 | 6.3604 | 10.2441 |
| NC_088854.1 | 61469542 | 579477946 | 9.4271 | 8.7789 |
| NC_088855.1 | 61039741 | 576017931 | 9.4368 | 8.5977 |
| NC_088856.1 | 57946171 | 432974161 | 7.472 | 9.0538 |
| NC_088857.1 | 57274926 | 520923802 | 9.0951 | 8.6161 |
| NC_088858.1 | 56905015 | 538254309 | 9.4588 | 8.5197 |
| NC_088859.1 | 53672946 | 525523740 | 9.7912 | 8.9986 |
| NC_088860.1 | 51133819 | 435577065 | 8.5184 | 9.1278 |
| NC_088861.1 | 50364239 | 322687155 | 6.4071 | 8.3928 |
| NC_088862.1 | 37310742 | 271664532 | 7.2811 | 8.8149 |
| NW_027062568.1 | 15579 | 112019 | 7.1904 | 6.5192 |
| NW_027062569.1 | 16498 | 107773 | 6.5325 | 13.6327 |
| NW_027062570.1 | 4000 | 47886 | 11.9715 | 13.306 |
| NW_027062571.1 | 36893 | 5105 | 0.1384 | 0.6623 |
| NW_027062572.1 | 51000 | 32435 | 0.636 | 1.5746 |
| NW_027062573.1 | 2000 | 41872 | 20.936 | 11.7938 |
| NW_027062574.1 | 37061 | 3022 | 0.0815 | 0.4576 |
| NW_027062575.1 | 49428 | 319048 | 6.4548 | 11.4059 |
| NW_027062576.1 | 49232 | 152538 | 3.0984 | 5.7944 |
| NW_027062577.1 | 17087 | 117835 | 6.8962 | 4.8307 |
| NW_027062578.1 | 34507 | 408199 | 11.8295 | 6.7818 |
| NW_027062579.1 | 64000 | 341096 | 5.3296 | 7.4917 |
| NW_027062580.1 | 24229 | 187521 | 7.7395 | 7.2382 |
| NW_027062581.1 | 5000 | 13661 | 2.7322 | 6.7826 |
| NW_027062582.1 | 18808 | 31839 | 1.6928 | 3.1178 |
| NW_027062583.1 | 1000 | 229 | 0.229 | 0.4202 |
| NW_027062584.1 | 74000 | 16881 | 0.2281 | 1.4129 |
| NW_027062585.1 | 39334 | 185141 | 4.7069 | 4.5753 |
| NW_027062586.1 | 258015 | 645869 | 2.5032 | 5.1862 |