Input data and parameters
QualiMap command line
| qualimap bamqc -bam zr3644_4.deduplicated.sorted.bam -nw 400 -hm 3 |
Alignment
| Command line: | "bismark -1 zr3644_4_R1_val_1_val_1_val_1.fq.gz -2 zr3644_4_R2_val_2_val_2_val_2.fq.gz --genome BismarkIndex --bam --score_min L,0,-0.8 --non_directional --prefix zr3644_4 --multicore 2" |
| Draw chromosome limits: | no |
| Analyze overlapping paired-end reads: | yes |
| Program: | Bismark (v0.24.2) |
| Analysis date: | Wed Apr 16 03:01:44 GMT 2025 |
| Size of a homopolymer: | 3 |
| Skip duplicate alignments: | no |
| Number of windows: | 400 |
| BAM file: | zr3644_4.deduplicated.sorted.bam |
Summary
Globals
| Reference size | 563,985,803 |
| Number of reads | 49,284,630 |
| Mapped reads | 49,284,630 / 100% |
| Unmapped reads | 0 / 0% |
| Mapped paired reads | 49,284,630 / 100% |
| Mapped reads, first in pair | 24,642,315 / 50% |
| Mapped reads, second in pair | 24,642,315 / 50% |
| Mapped reads, both in pair | 49,284,630 / 100% |
| Mapped reads, singletons | 0 / 0% |
| Secondary alignments | 0 |
| Read min/max/mean length | 20 / 115 / 105.69 |
| Overlapping read pairs | 20,915,757 / 84.88% |
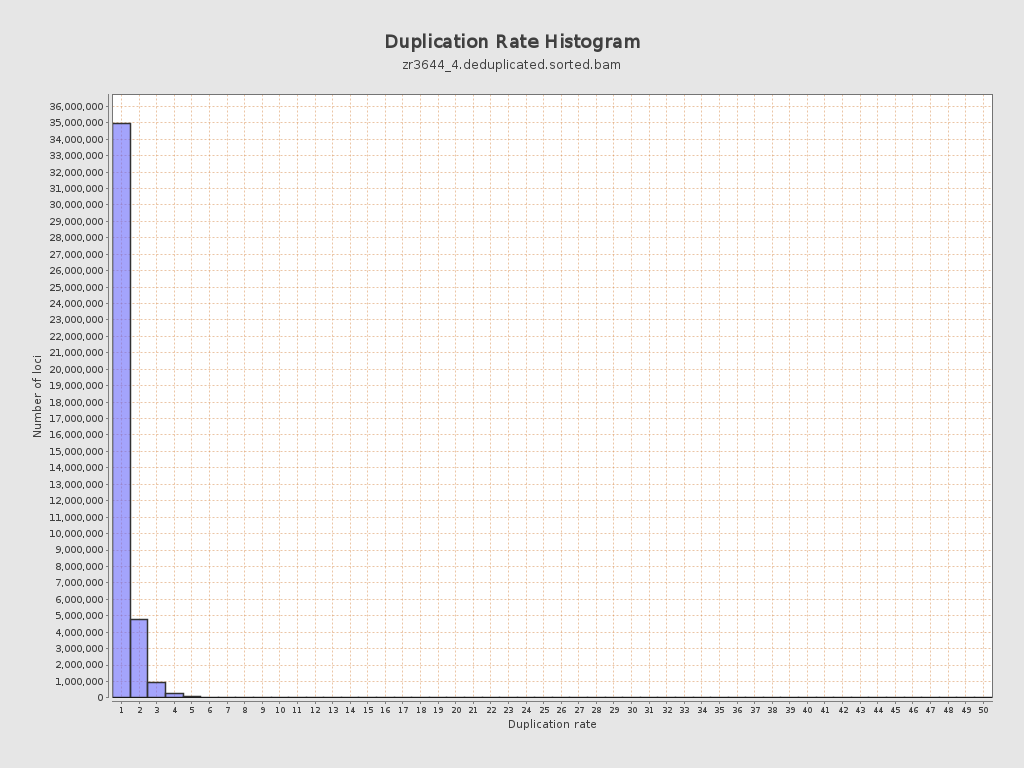
| Duplicated reads (estimated) | 8,196,375 / 16.63% |
| Duplication rate | 14.94% |
| Clipped reads | 0 / 0% |
ACGT Content
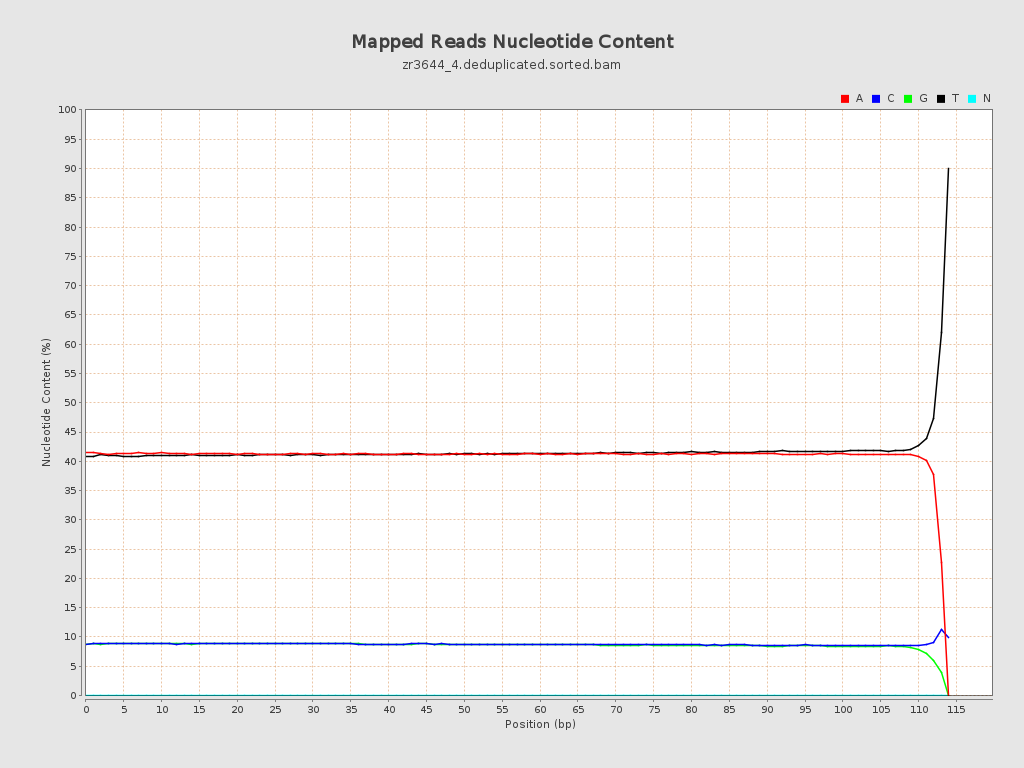
| Number/percentage of A's | 2,127,870,825 / 41.09% |
| Number/percentage of C's | 453,469,611 / 8.76% |
| Number/percentage of T's | 2,149,363,579 / 41.51% |
| Number/percentage of G's | 447,232,847 / 8.64% |
| Number/percentage of N's | 36,789 / 0% |
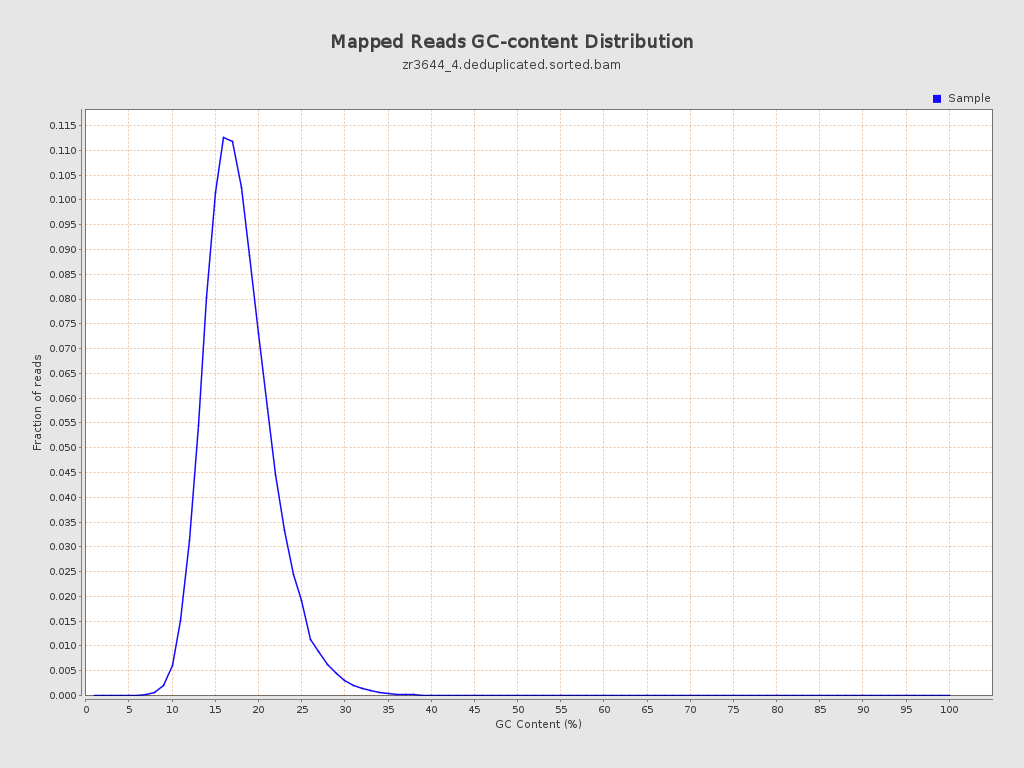
| GC Percentage | 17.39% |
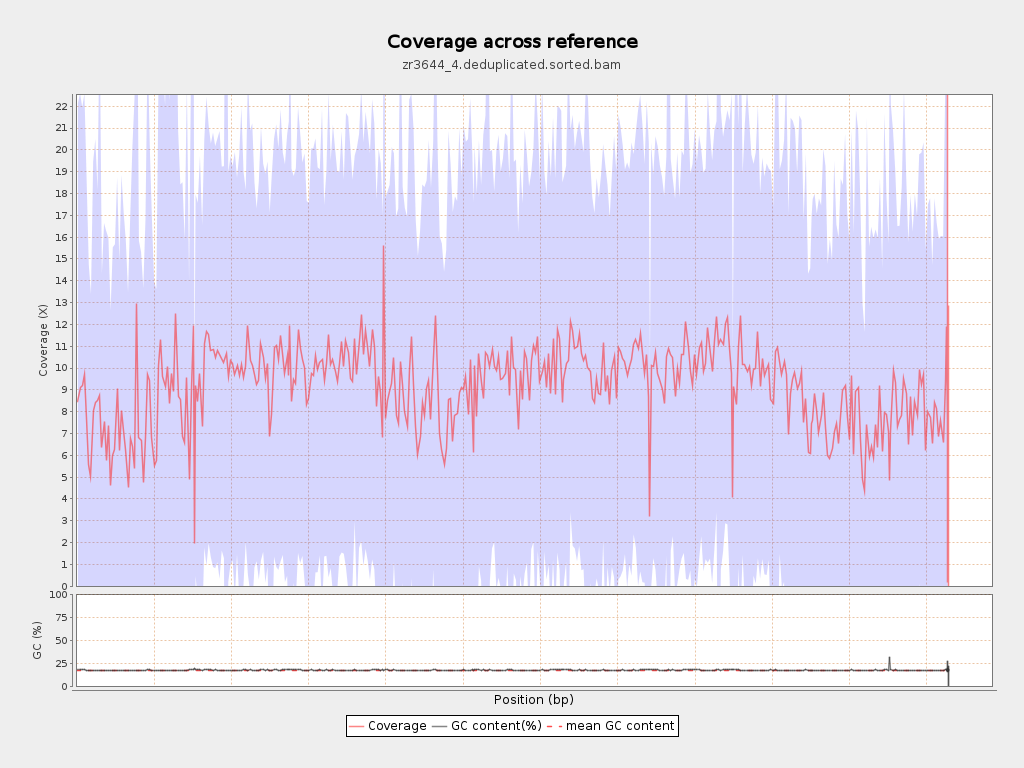
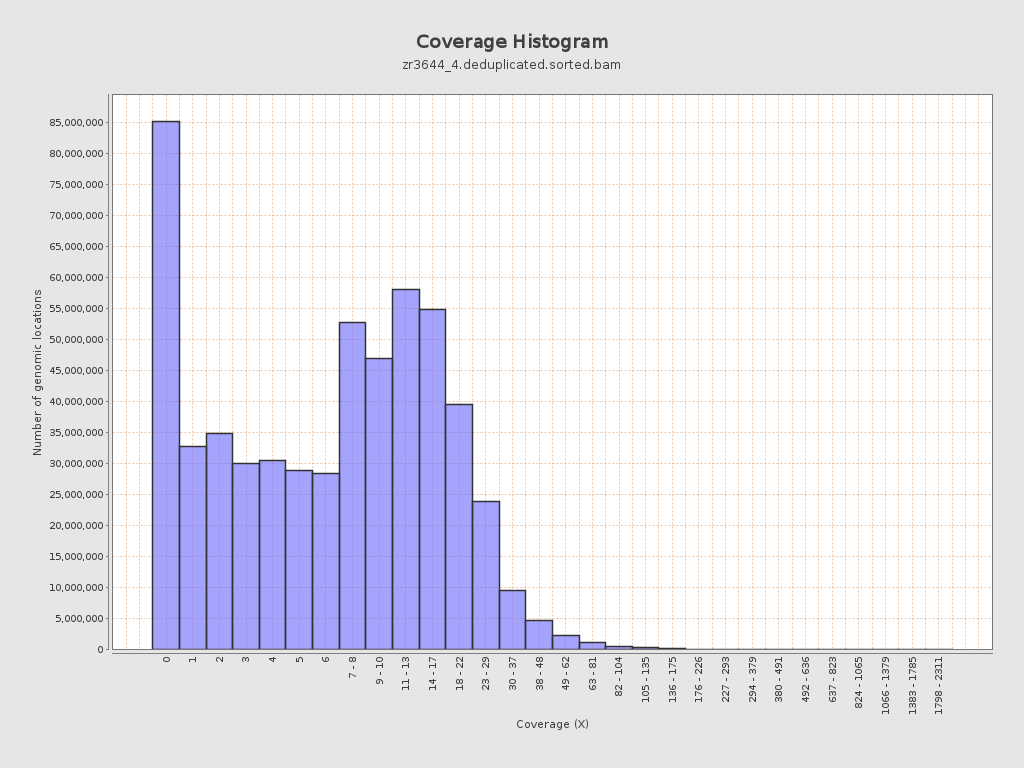
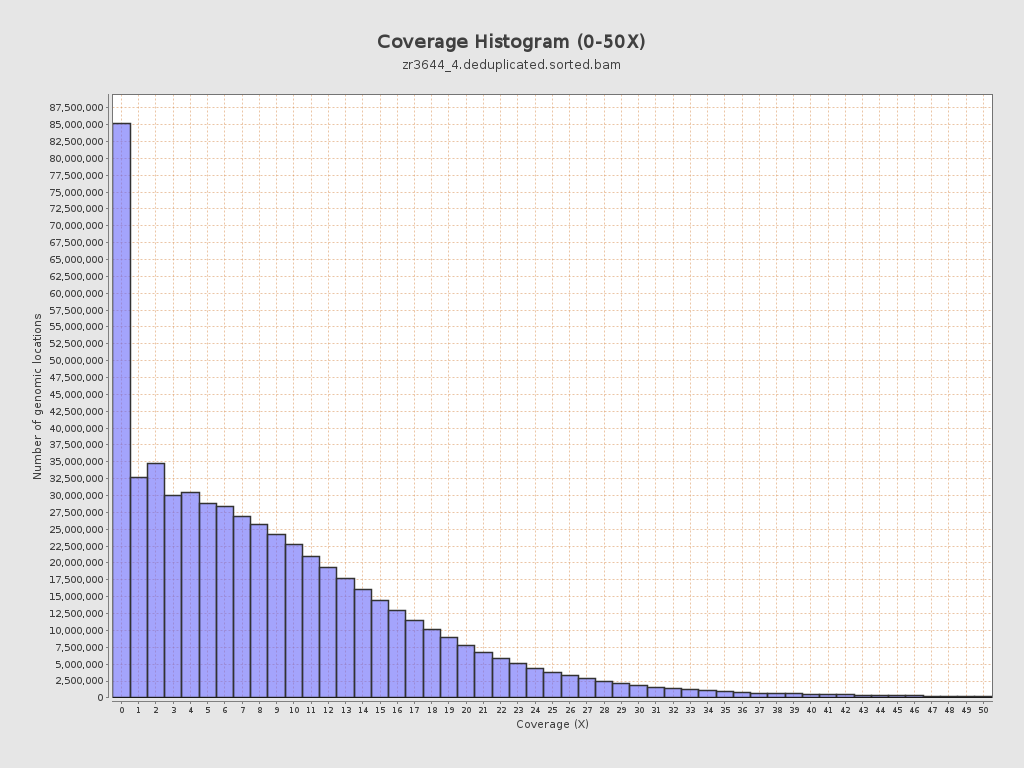
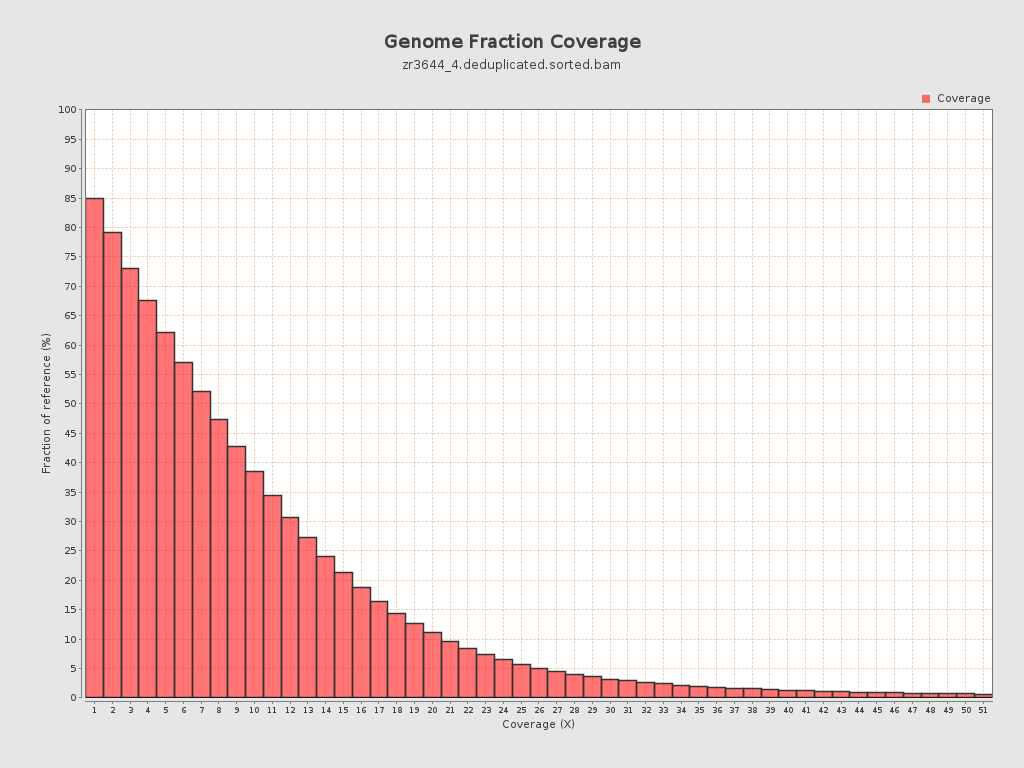
Coverage
| Mean | 9.2231 |
| Standard Deviation | 10.3268 |
| Mean (paired-end reads overlap ignored) | 6.56 |
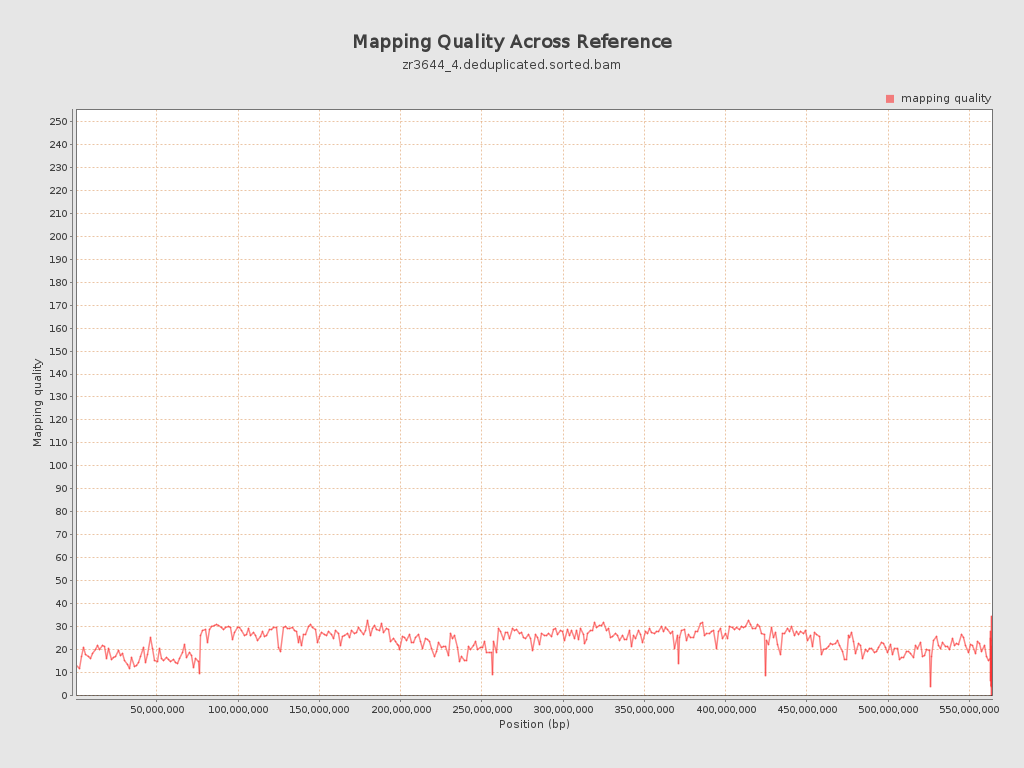
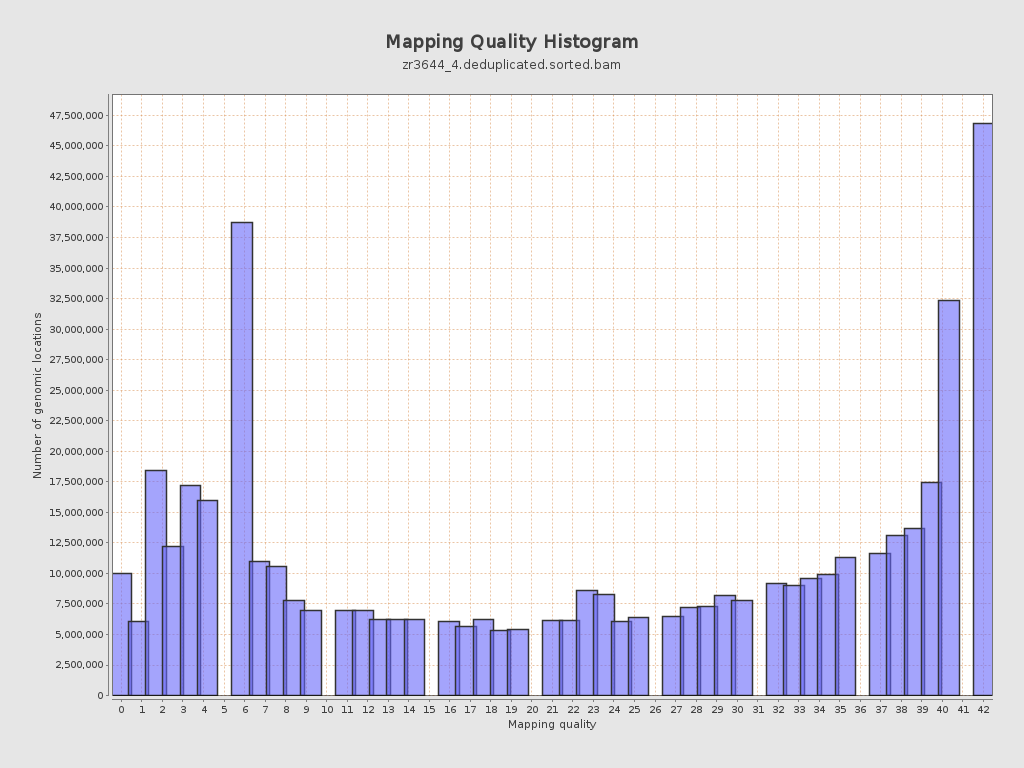
Mapping Quality
| Mean Mapping Quality | 23.27 |
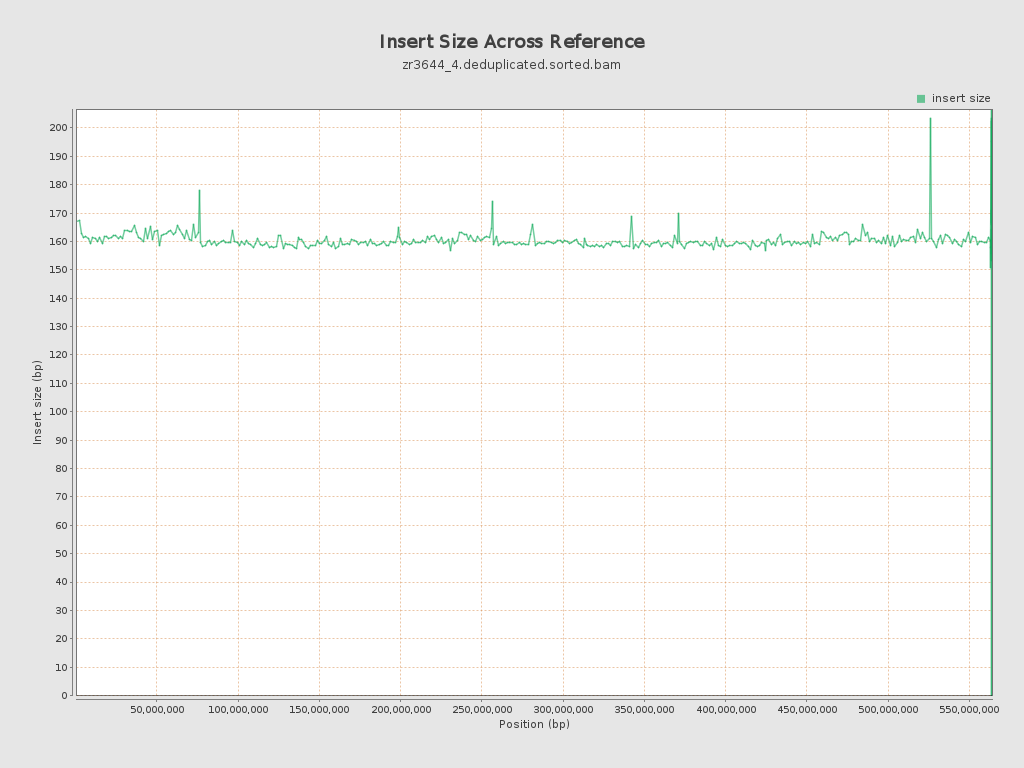
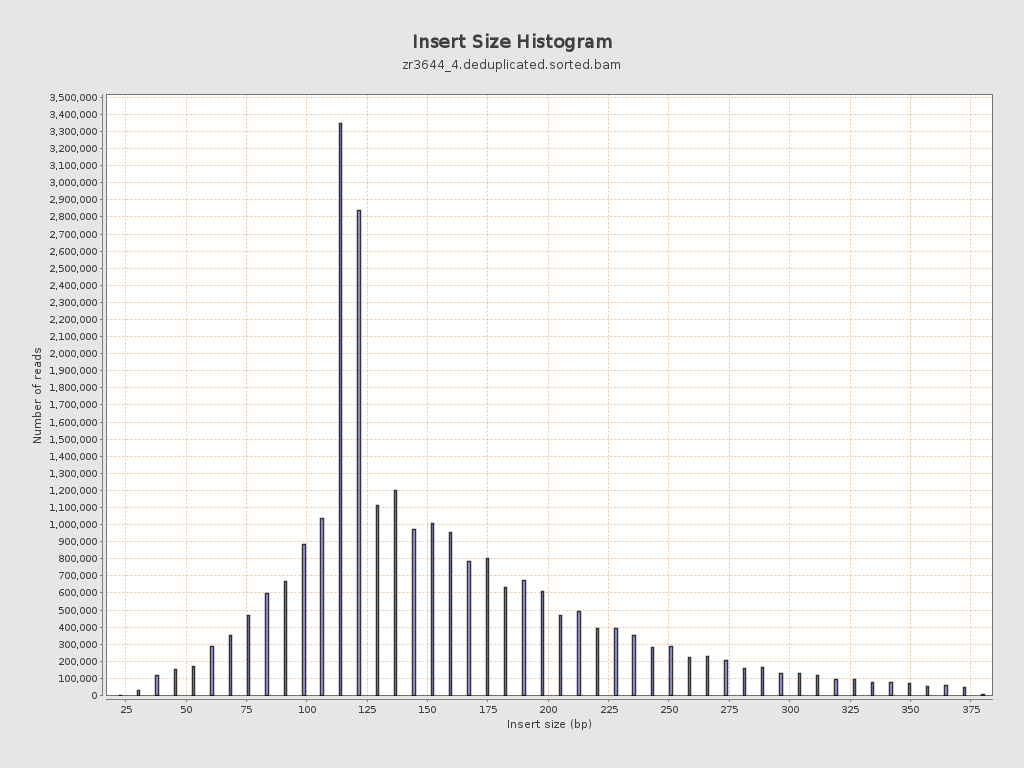
Insert size
| Mean | 160.12 |
| Standard Deviation | 70.09 |
| P25/Median/P75 | 117 / 138 / 190 |
Mismatches and indels
| General error rate | 19.65% |
| Mismatches | 991,563,859 |
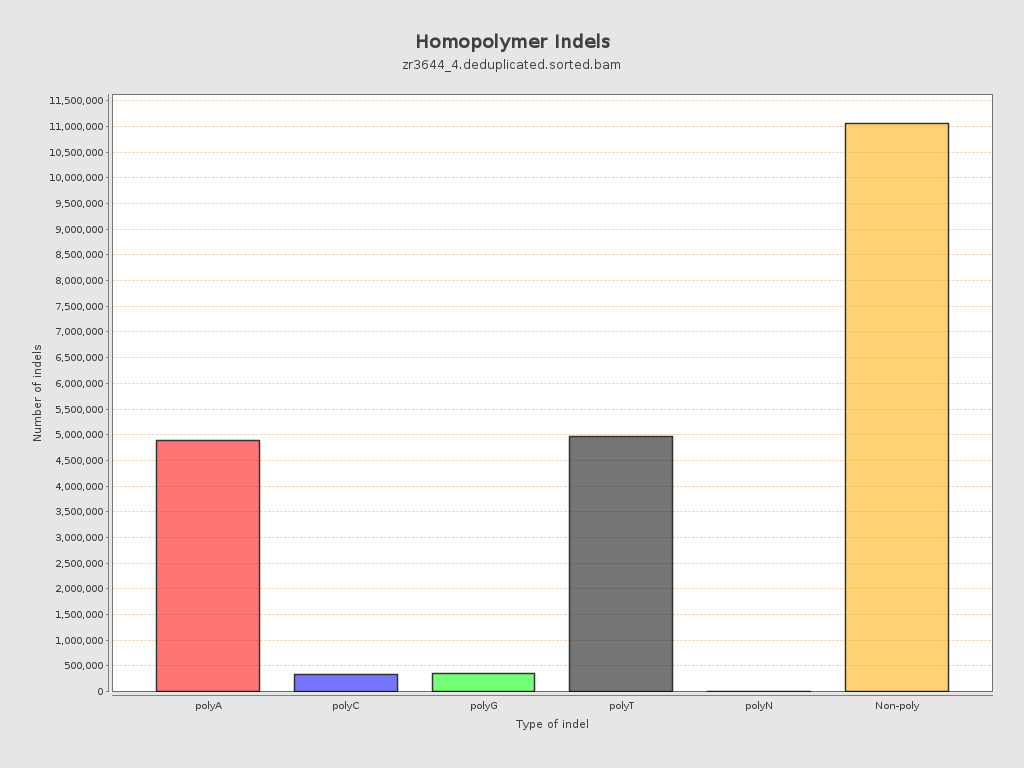
| Insertions | 11,475,610 |
| Mapped reads with at least one insertion | 17.53% |
| Deletions | 10,131,201 |
| Mapped reads with at least one deletion | 16.96% |
| Homopolymer indels | 48.8% |
Chromosome stats
| Name | Length | Mapped bases | Mean coverage | Standard deviation |
| NC_088853.1 | 76070991 | 596328908 | 7.8391 | 11.9567 |
| NC_088854.1 | 61469542 | 621155808 | 10.1051 | 9.8541 |
| NC_088855.1 | 61039741 | 620242516 | 10.1613 | 9.4788 |
| NC_088856.1 | 57946171 | 493855590 | 8.5227 | 10.407 |
| NC_088857.1 | 57274926 | 570715381 | 9.9645 | 9.9679 |
| NC_088858.1 | 56905015 | 578466120 | 10.1655 | 9.5329 |
| NC_088859.1 | 53672946 | 562264425 | 10.4758 | 10.1696 |
| NC_088860.1 | 51133819 | 484171471 | 9.4687 | 10.5348 |
| NC_088861.1 | 50364239 | 367231902 | 7.2915 | 9.9705 |
| NC_088862.1 | 37310742 | 303938160 | 8.1461 | 9.9378 |
| NW_027062568.1 | 15579 | 116846 | 7.5002 | 5.7945 |
| NW_027062569.1 | 16498 | 108265 | 6.5623 | 10.8744 |
| NW_027062570.1 | 4000 | 200903 | 50.2257 | 44.3377 |
| NW_027062571.1 | 36893 | 17765 | 0.4815 | 1.2867 |
| NW_027062572.1 | 51000 | 70173 | 1.3759 | 2.5987 |
| NW_027062573.1 | 2000 | 104659 | 52.3295 | 42.823 |
| NW_027062574.1 | 37061 | 6398 | 0.1726 | 0.6004 |
| NW_027062575.1 | 49428 | 283757 | 5.7408 | 11.1849 |
| NW_027062576.1 | 49232 | 160473 | 3.2595 | 5.5031 |
| NW_027062577.1 | 17087 | 116980 | 6.8461 | 5.7043 |
| NW_027062578.1 | 34507 | 412753 | 11.9614 | 8.3513 |
| NW_027062579.1 | 64000 | 440668 | 6.8854 | 10.1985 |
| NW_027062580.1 | 24229 | 139026 | 5.738 | 6.2922 |
| NW_027062581.1 | 5000 | 19814 | 3.9628 | 10.6895 |
| NW_027062582.1 | 18808 | 242293 | 12.8824 | 10.3263 |
| NW_027062583.1 | 1000 | 0 | 0 | 0 |
| NW_027062584.1 | 74000 | 9993 | 0.135 | 0.5073 |
| NW_027062585.1 | 39334 | 253428 | 6.443 | 5.6207 |
| NW_027062586.1 | 258015 | 631227 | 2.4465 | 6.4904 |