Input data and parameters
QualiMap command line
| qualimap bamqc -bam zr3644_3.deduplicated.sorted.bam -nw 400 -hm 3 |
Alignment
| Command line: | "bismark -1 zr3644_3_R1_val_1_val_1_val_1.fq.gz -2 zr3644_3_R2_val_2_val_2_val_2.fq.gz --genome BismarkIndex --bam --score_min L,0,-0.8 --non_directional --prefix zr3644_3 --multicore 2" |
| Draw chromosome limits: | no |
| Analyze overlapping paired-end reads: | yes |
| Program: | Bismark (v0.24.2) |
| Analysis date: | Wed Apr 16 02:12:05 GMT 2025 |
| Size of a homopolymer: | 3 |
| Skip duplicate alignments: | no |
| Number of windows: | 400 |
| BAM file: | zr3644_3.deduplicated.sorted.bam |
Summary
Globals
| Reference size | 563,985,803 |
| Number of reads | 41,394,998 |
| Mapped reads | 41,394,998 / 100% |
| Unmapped reads | 0 / 0% |
| Mapped paired reads | 41,394,998 / 100% |
| Mapped reads, first in pair | 20,697,499 / 50% |
| Mapped reads, second in pair | 20,697,499 / 50% |
| Mapped reads, both in pair | 41,394,998 / 100% |
| Mapped reads, singletons | 0 / 0% |
| Secondary alignments | 0 |
| Read min/max/mean length | 20 / 115 / 105.83 |
| Overlapping read pairs | 17,406,575 / 84.1% |
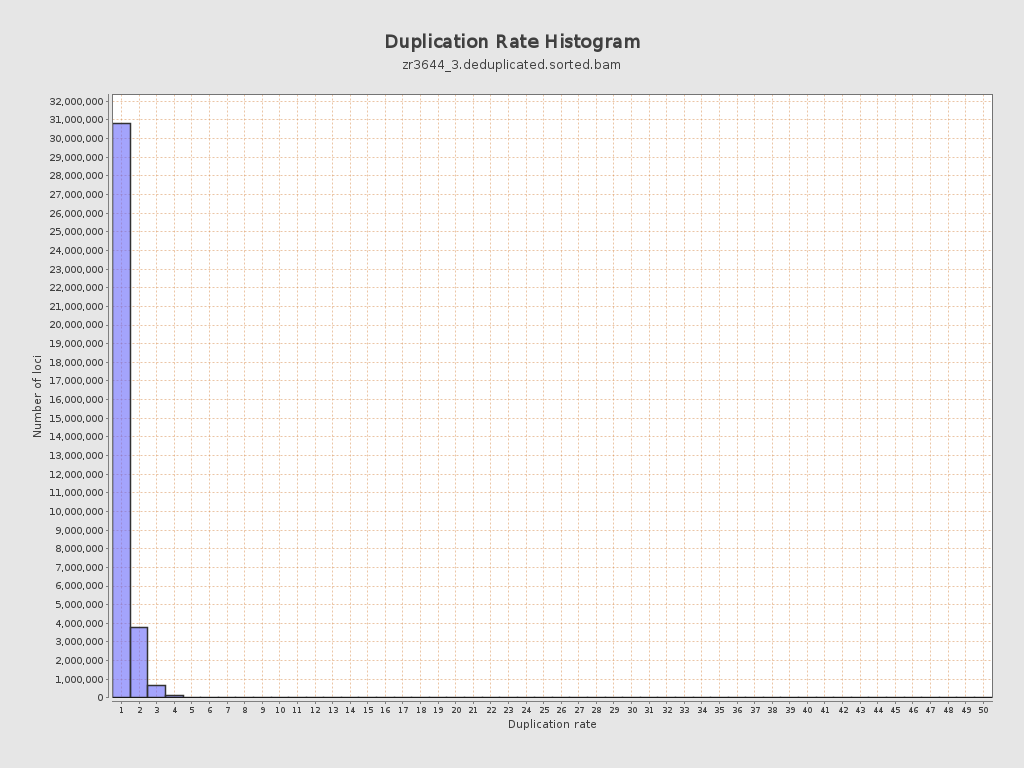
| Duplicated reads (estimated) | 5,950,460 / 14.37% |
| Duplication rate | 13.1% |
| Clipped reads | 0 / 0% |
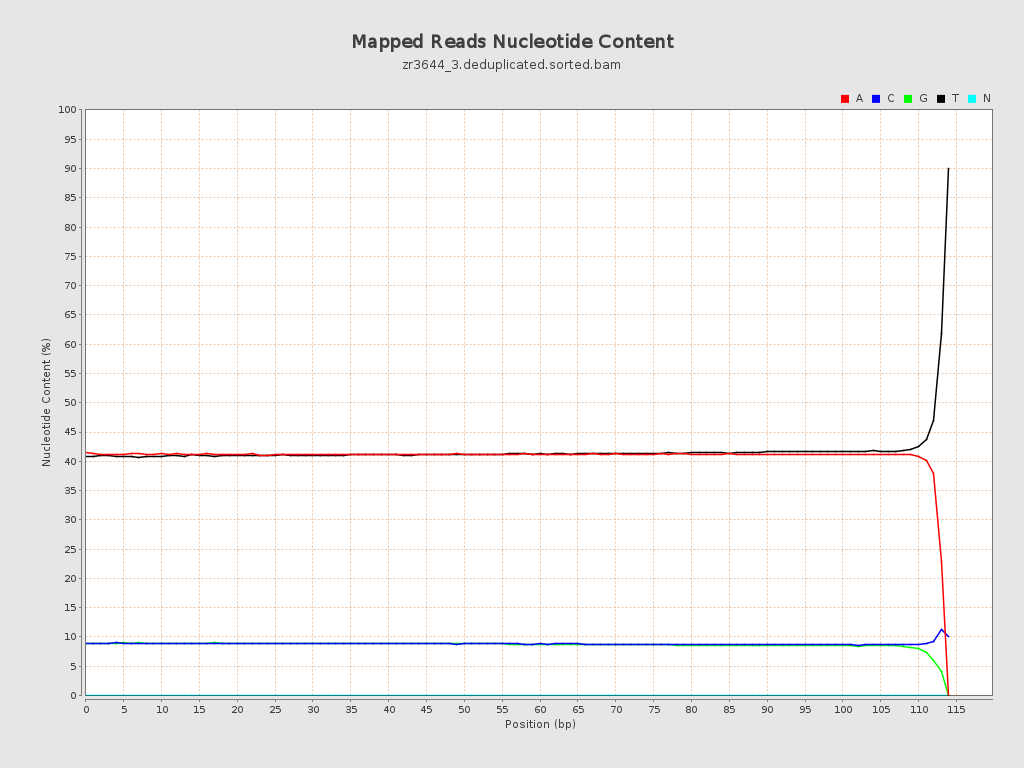
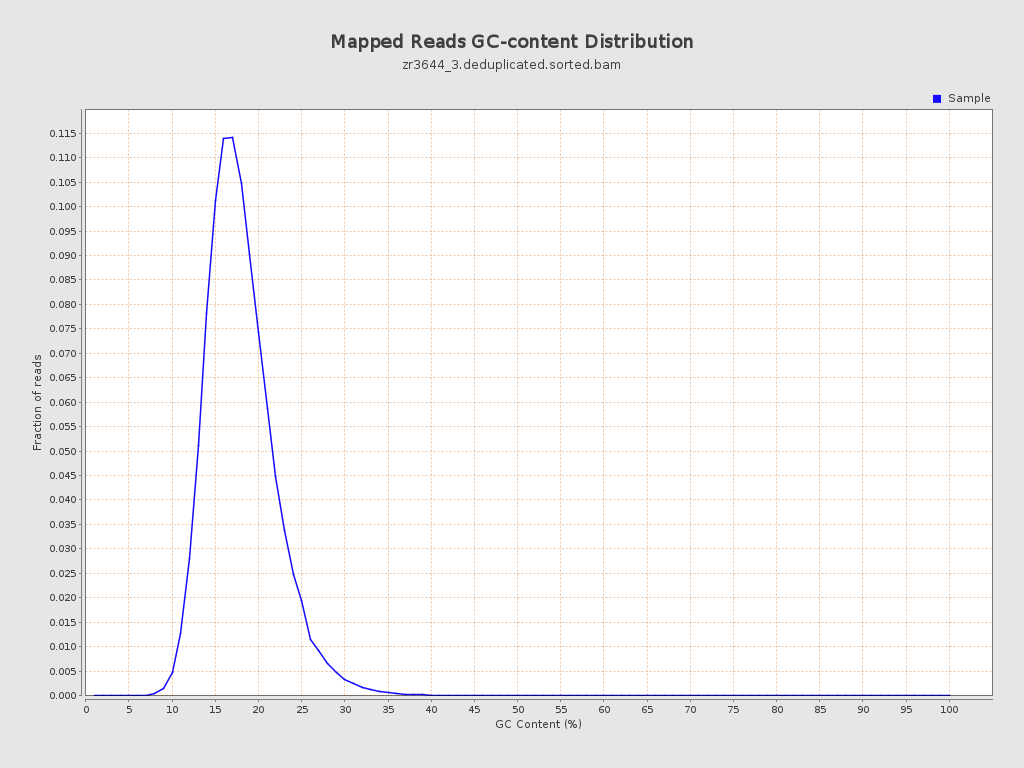
ACGT Content
| Number/percentage of A's | 1,786,741,220 / 41.03% |
| Number/percentage of C's | 384,454,251 / 8.83% |
| Number/percentage of T's | 1,804,968,934 / 41.44% |
| Number/percentage of G's | 378,920,994 / 8.7% |
| Number/percentage of N's | 32,307 / 0% |
| GC Percentage | 17.53% |
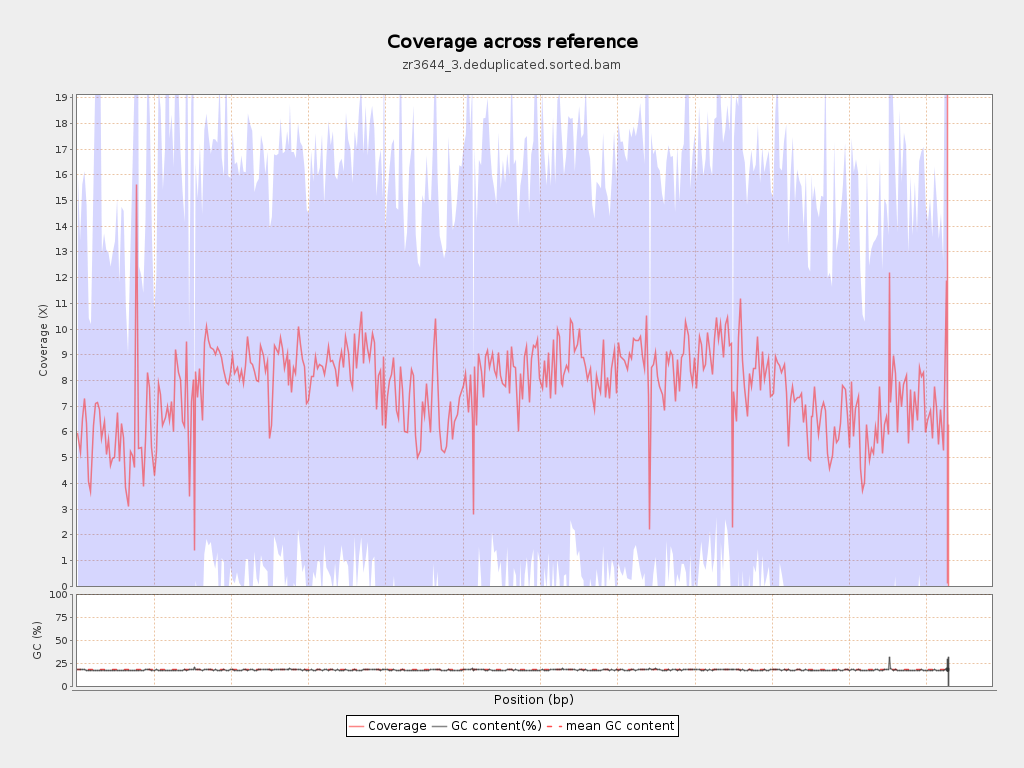
Coverage
| Mean | 7.7571 |
| Standard Deviation | 8.5893 |
| Mean (paired-end reads overlap ignored) | 5.55 |
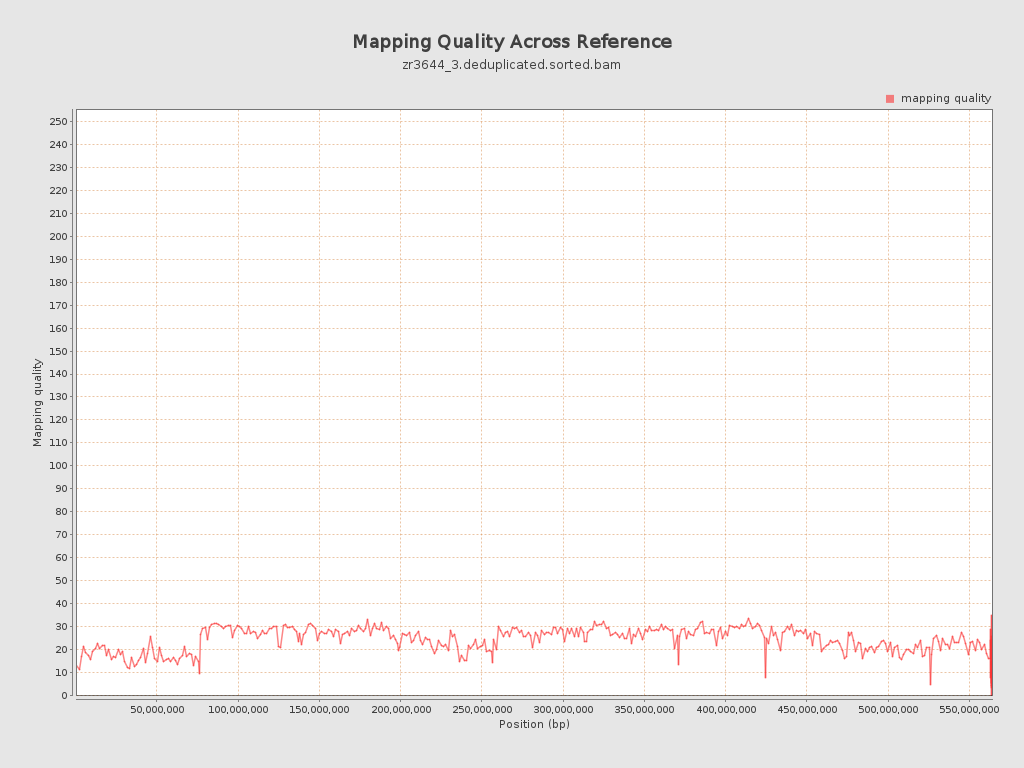
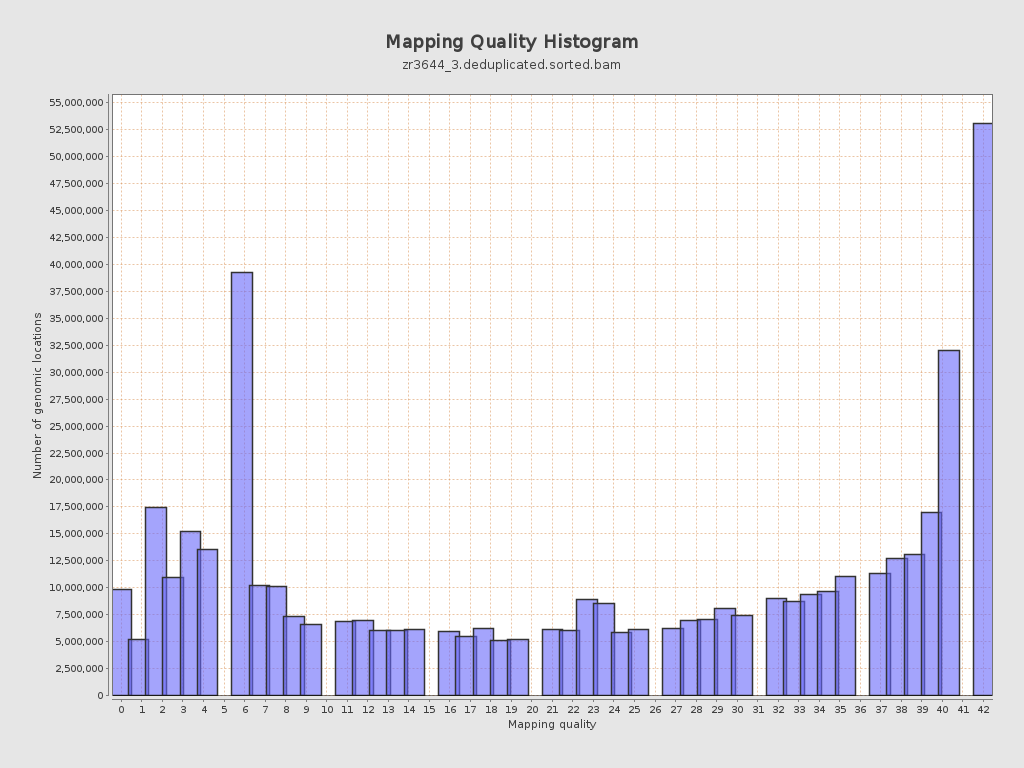
Mapping Quality
| Mean Mapping Quality | 23.93 |
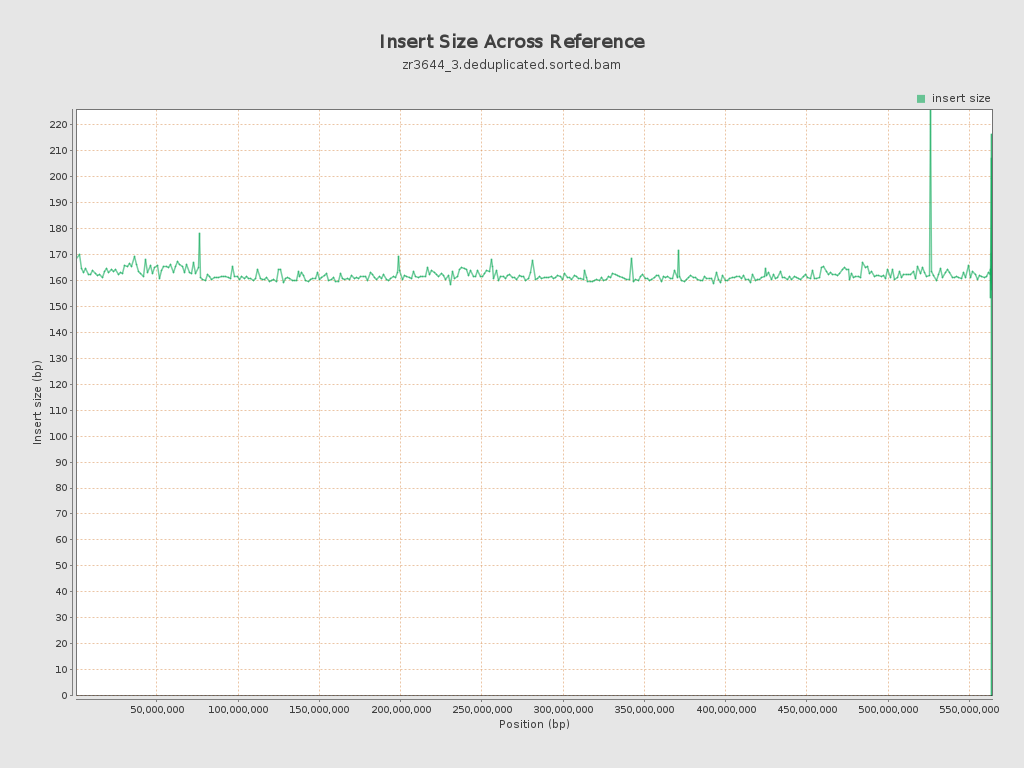
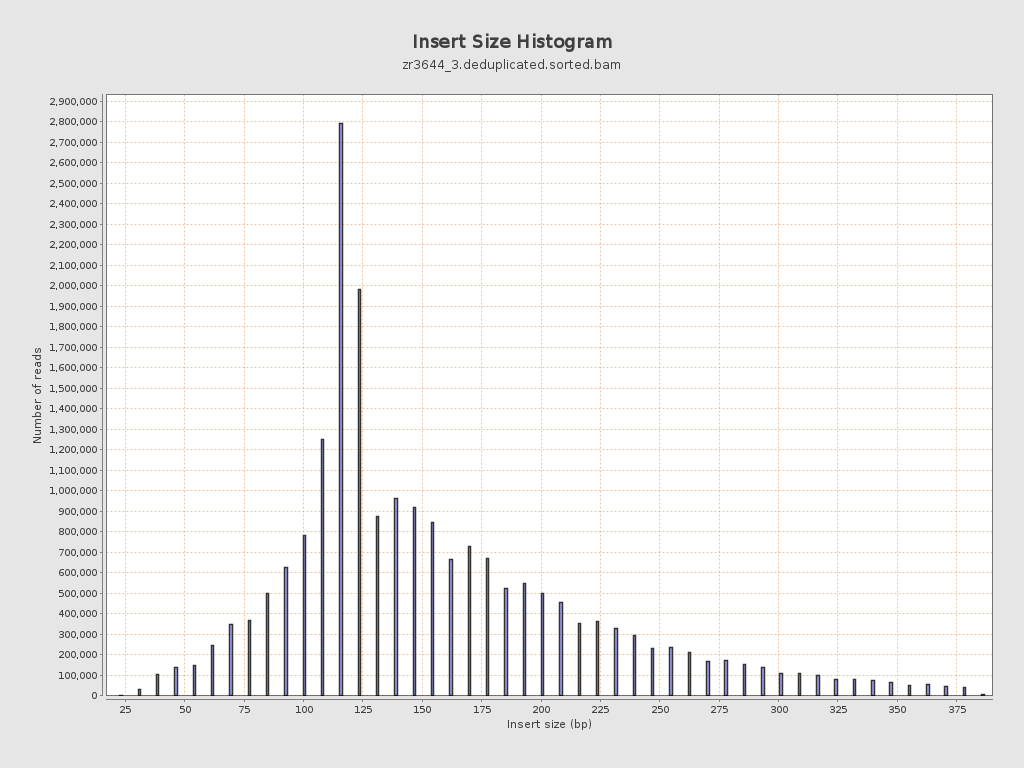
Insert size
| Mean | 161.85 |
| Standard Deviation | 71.11 |
| P25/Median/P75 | 117 / 140 / 193 |
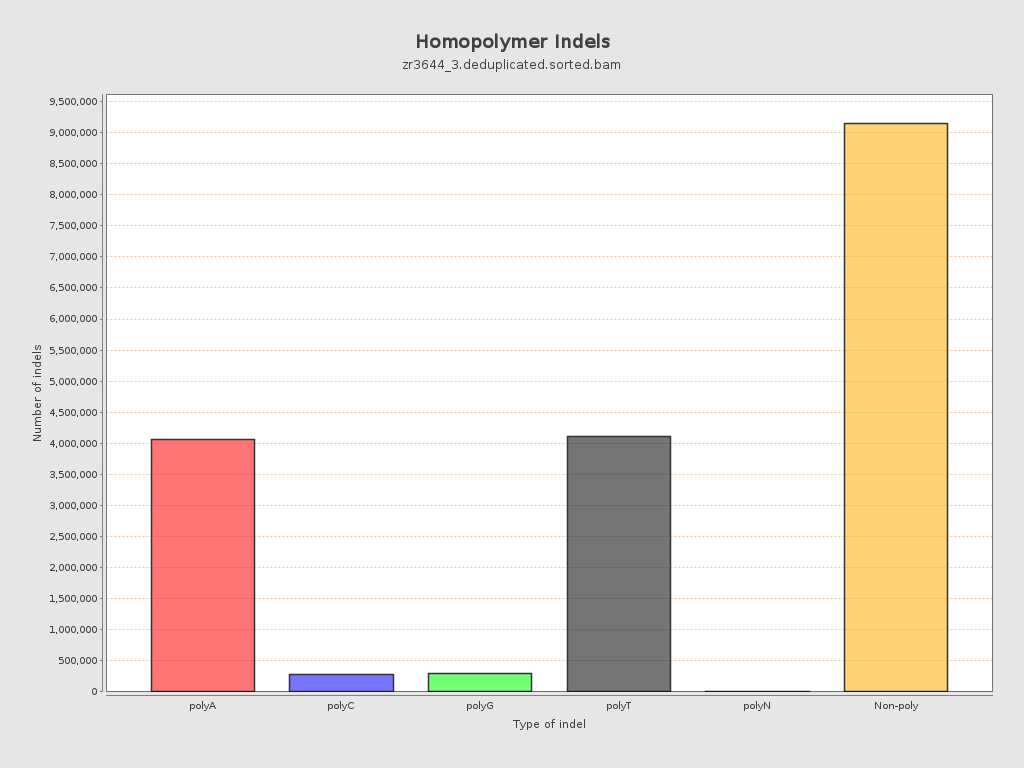
Mismatches and indels
| General error rate | 19.52% |
| Mismatches | 828,210,297 |
| Insertions | 9,454,545 |
| Mapped reads with at least one insertion | 17.21% |
| Deletions | 8,418,166 |
| Mapped reads with at least one deletion | 16.8% |
| Homopolymer indels | 48.8% |
Chromosome stats
| Name | Length | Mapped bases | Mean coverage | Standard deviation |
| NC_088853.1 | 76070991 | 475684170 | 6.2532 | 10.2341 |
| NC_088854.1 | 61469542 | 525760873 | 8.5532 | 7.8932 |
| NC_088855.1 | 61039741 | 528477216 | 8.6579 | 7.795 |
| NC_088856.1 | 57946171 | 410290646 | 7.0805 | 8.6562 |
| NC_088857.1 | 57274926 | 481901357 | 8.4138 | 8.1656 |
| NC_088858.1 | 56905015 | 495519399 | 8.7078 | 8.0538 |
| NC_088859.1 | 53672946 | 477427780 | 8.8951 | 8.1244 |
| NC_088860.1 | 51133819 | 399281042 | 7.8086 | 8.4837 |
| NC_088861.1 | 50364239 | 307021496 | 6.096 | 8.1391 |
| NC_088862.1 | 37310742 | 270898811 | 7.2606 | 9.0515 |
| NW_027062568.1 | 15579 | 103484 | 6.6425 | 5.3051 |
| NW_027062569.1 | 16498 | 105840 | 6.4153 | 11.8308 |
| NW_027062570.1 | 4000 | 153647 | 38.4117 | 35.263 |
| NW_027062571.1 | 36893 | 9956 | 0.2699 | 1.2913 |
| NW_027062572.1 | 51000 | 52949 | 1.0382 | 1.8133 |
| NW_027062573.1 | 2000 | 73499 | 36.7495 | 32.7332 |
| NW_027062574.1 | 37061 | 3244 | 0.0875 | 0.4265 |
| NW_027062575.1 | 49428 | 222926 | 4.5101 | 8.5185 |
| NW_027062576.1 | 49232 | 148066 | 3.0075 | 4.9405 |
| NW_027062577.1 | 17087 | 109408 | 6.403 | 4.874 |
| NW_027062578.1 | 34507 | 394952 | 11.4456 | 6.6736 |
| NW_027062579.1 | 64000 | 328116 | 5.1268 | 7.0929 |
| NW_027062580.1 | 24229 | 177913 | 7.343 | 7.4105 |
| NW_027062581.1 | 5000 | 20194 | 4.0388 | 6.7379 |
| NW_027062582.1 | 18808 | 53430 | 2.8408 | 3.4667 |
| NW_027062583.1 | 1000 | 0 | 0 | 0 |
| NW_027062584.1 | 74000 | 9400 | 0.127 | 0.7383 |
| NW_027062585.1 | 39334 | 247058 | 6.281 | 5.8487 |
| NW_027062586.1 | 258015 | 440574 | 1.7076 | 4.5261 |