Input data and parameters
QualiMap command line
| qualimap bamqc -bam zr3644_24.deduplicated.sorted.bam -nw 400 -hm 3 |
Alignment
| Command line: | "bismark -1 zr3644_24_R1_val_1_val_1_val_1.fq.gz -2 zr3644_24_R2_val_2_val_2_val_2.fq.gz --genome BismarkIndex --bam --score_min L,0,-0.8 --non_directional --prefix zr3644_24 --multicore 3" |
| Draw chromosome limits: | no |
| Analyze overlapping paired-end reads: | yes |
| Program: | Bismark (v0.24.2) |
| Analysis date: | Wed Apr 16 07:39:25 GMT 2025 |
| Size of a homopolymer: | 3 |
| Skip duplicate alignments: | no |
| Number of windows: | 400 |
| BAM file: | zr3644_24.deduplicated.sorted.bam |
Summary
Globals
| Reference size | 563,985,803 |
| Number of reads | 58,963,892 |
| Mapped reads | 58,963,892 / 100% |
| Unmapped reads | 0 / 0% |
| Mapped paired reads | 58,963,892 / 100% |
| Mapped reads, first in pair | 29,481,946 / 50% |
| Mapped reads, second in pair | 29,481,946 / 50% |
| Mapped reads, both in pair | 58,963,892 / 100% |
| Mapped reads, singletons | 0 / 0% |
| Secondary alignments | 0 |
| Read min/max/mean length | 20 / 115 / 105.73 |
| Overlapping read pairs | 24,893,548 / 84.44% |
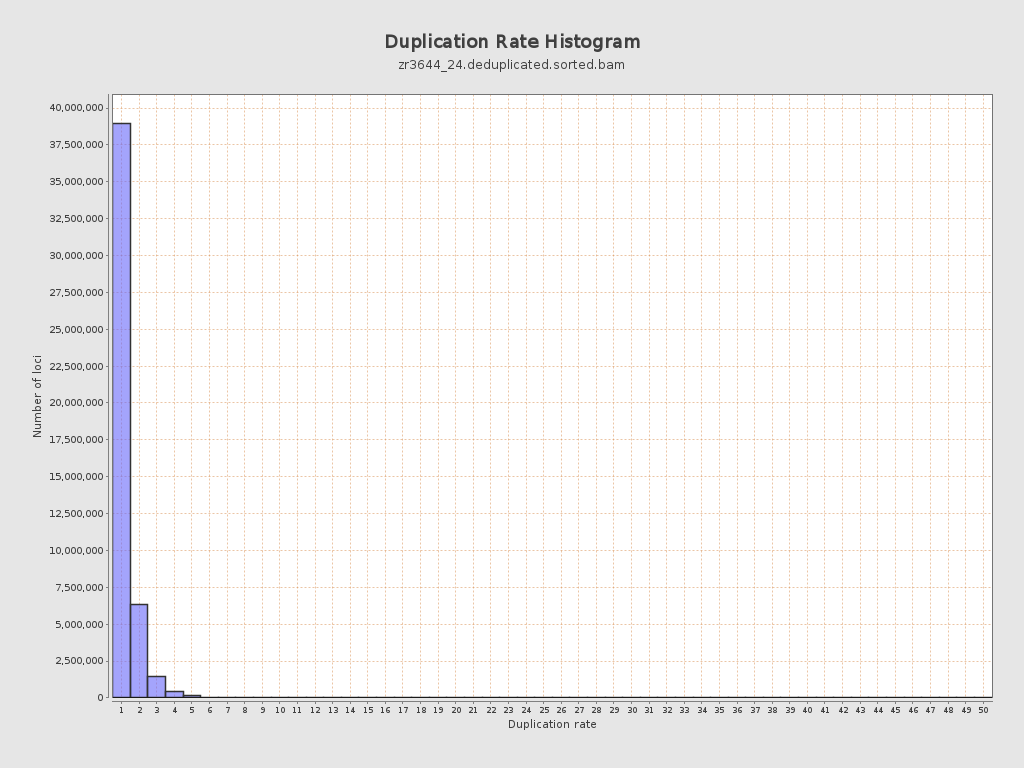
| Duplicated reads (estimated) | 11,644,815 / 19.75% |
| Duplication rate | 17.71% |
| Clipped reads | 0 / 0% |
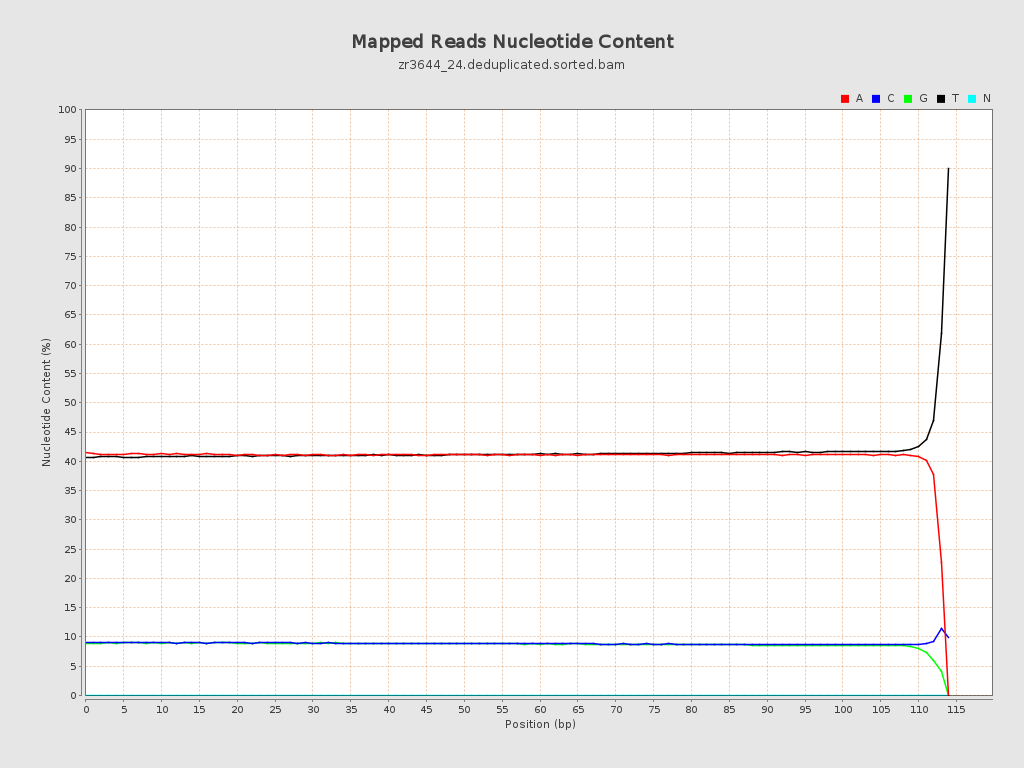
ACGT Content
| Number/percentage of A's | 2,540,018,021 / 40.98% |
| Number/percentage of C's | 551,050,922 / 8.89% |
| Number/percentage of T's | 2,564,984,424 / 41.38% |
| Number/percentage of G's | 542,619,100 / 8.75% |
| Number/percentage of N's | 46,526 / 0% |
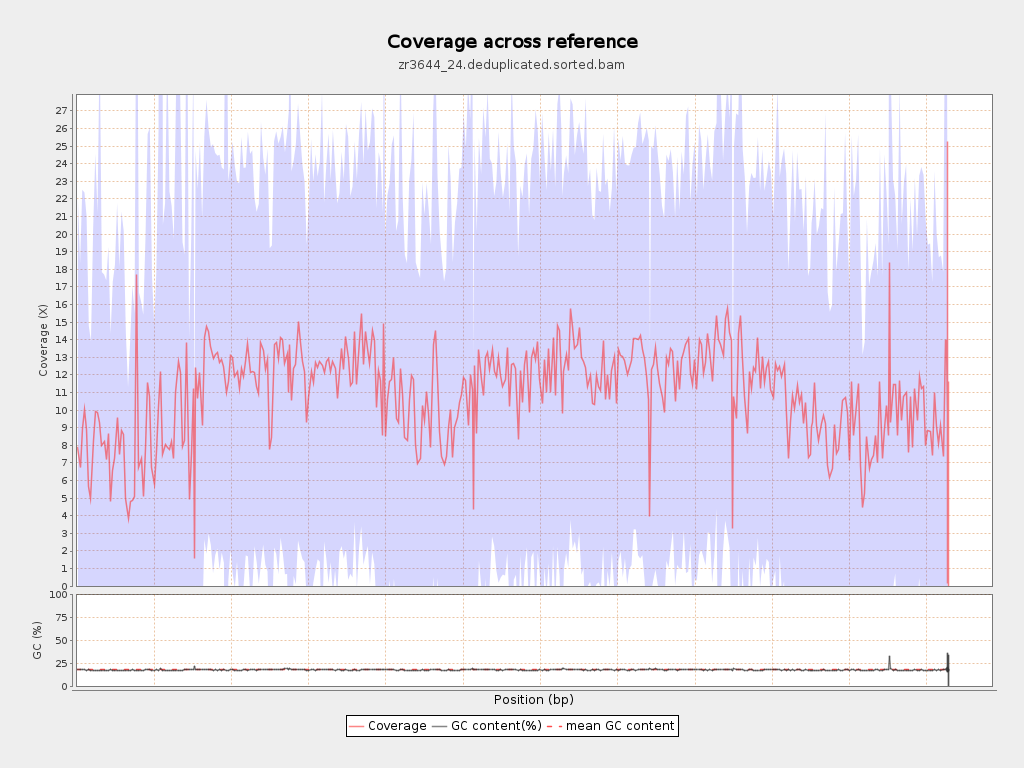
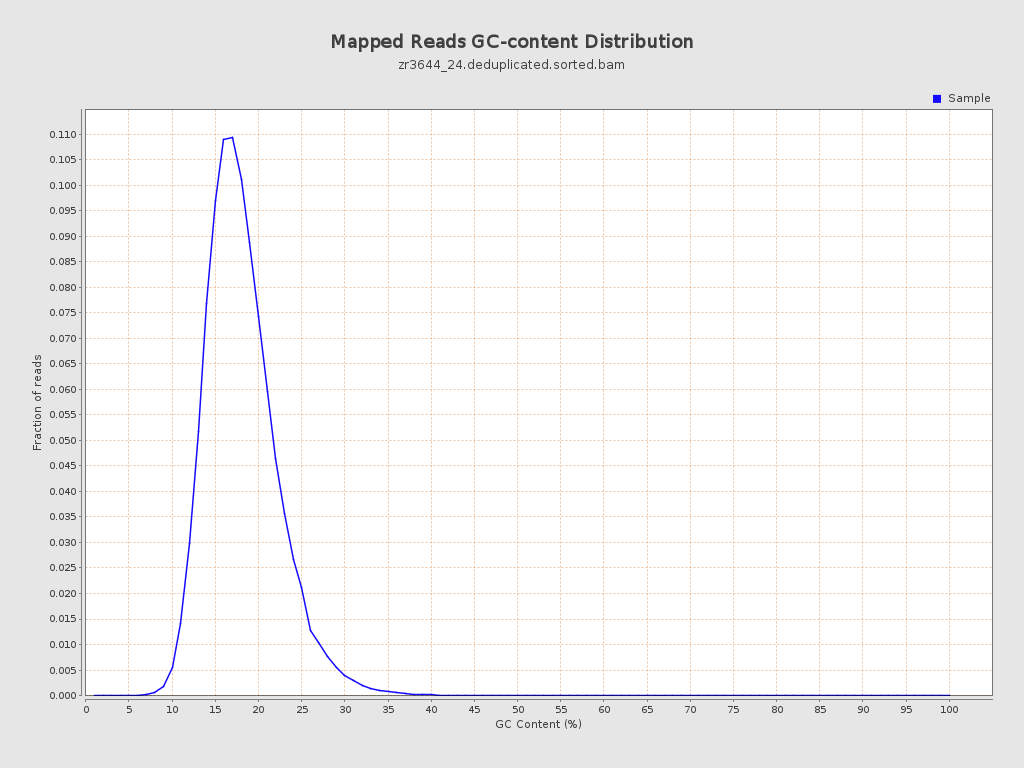
| GC Percentage | 17.64% |
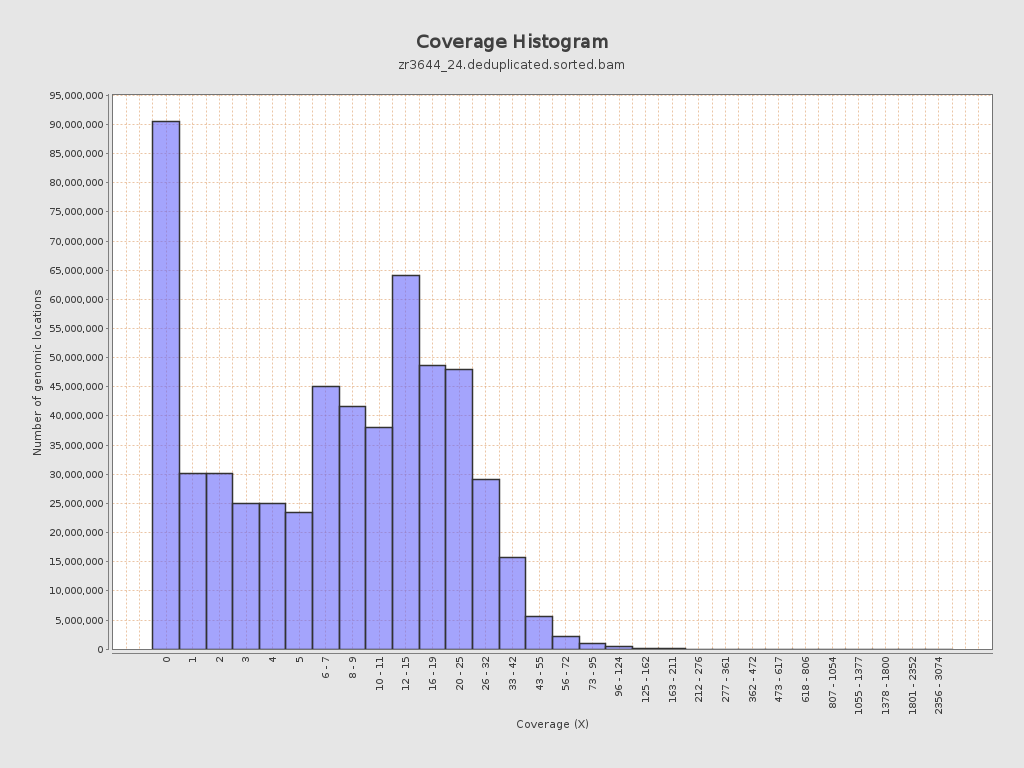
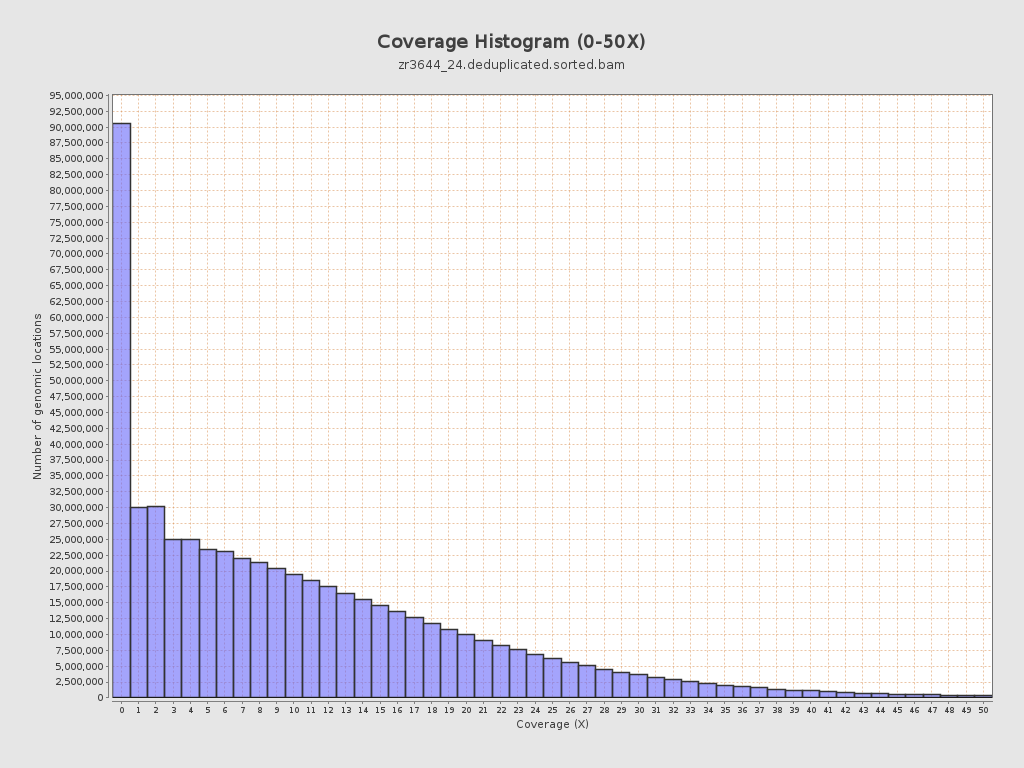
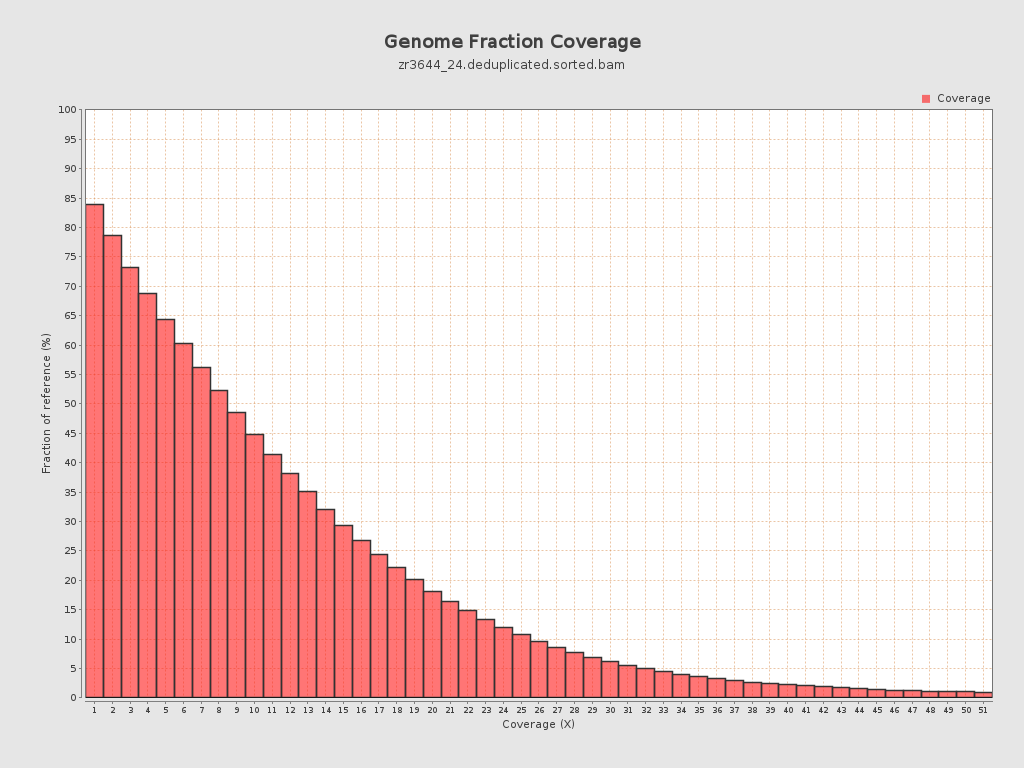
Coverage
| Mean | 11.0389 |
| Standard Deviation | 13.0511 |
| Mean (paired-end reads overlap ignored) | 7.88 |
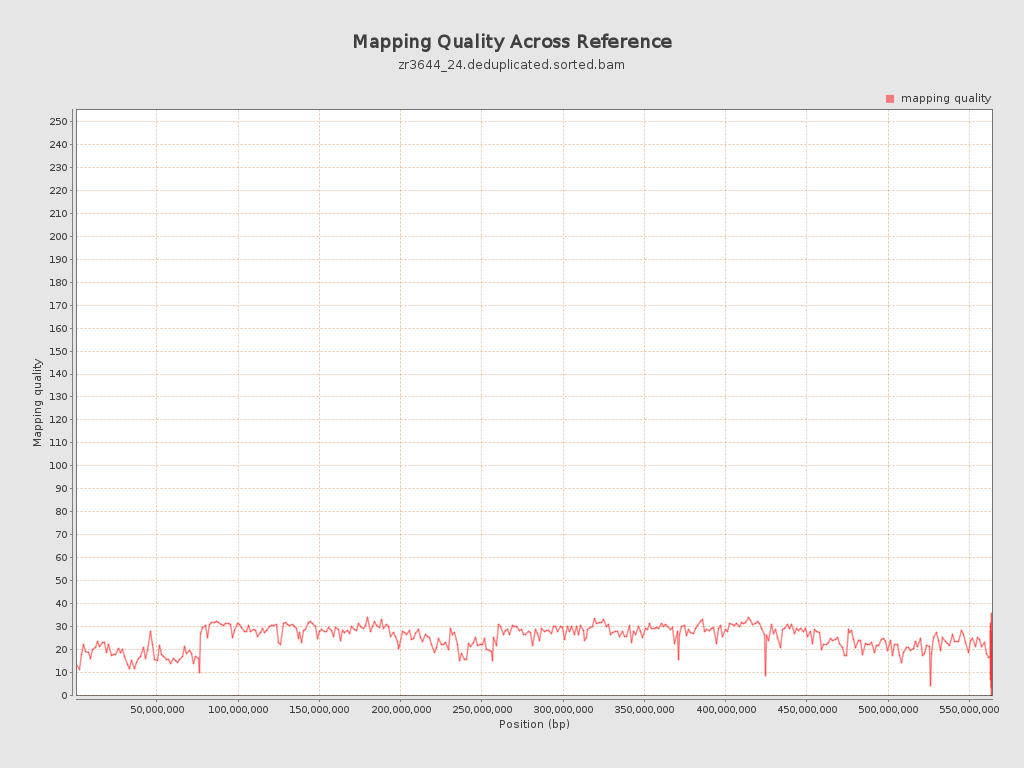
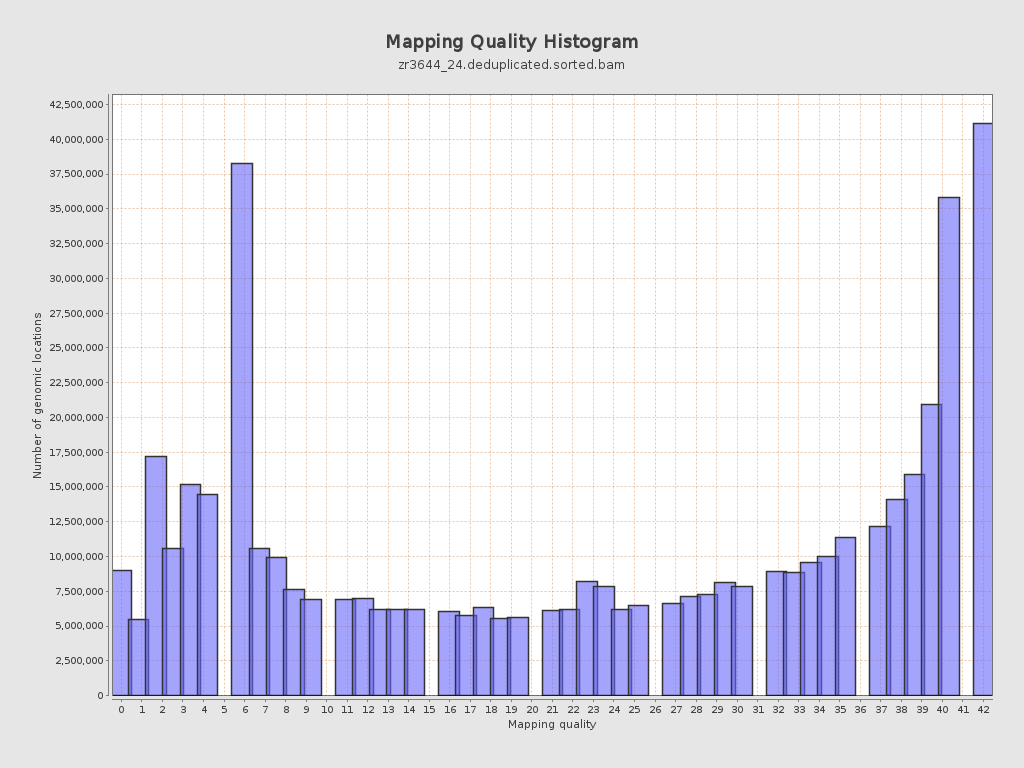
Mapping Quality
| Mean Mapping Quality | 24.85 |
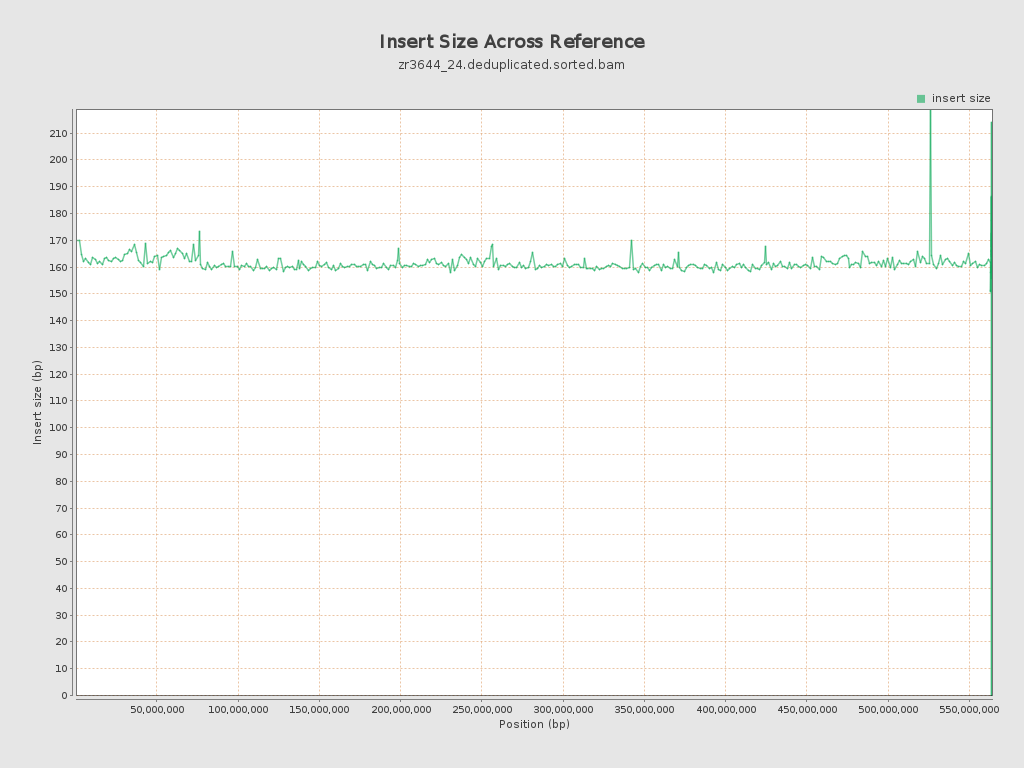
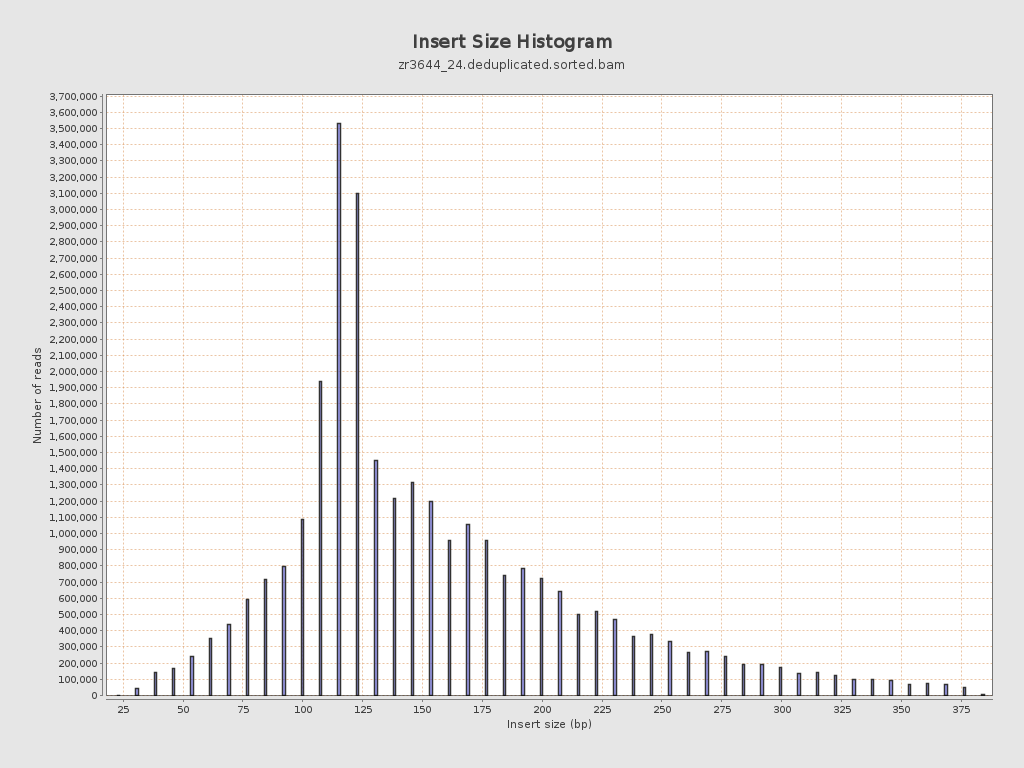
Insert size
| Mean | 161.04 |
| Standard Deviation | 70.59 |
| P25/Median/P75 | 117 / 139 / 192 |
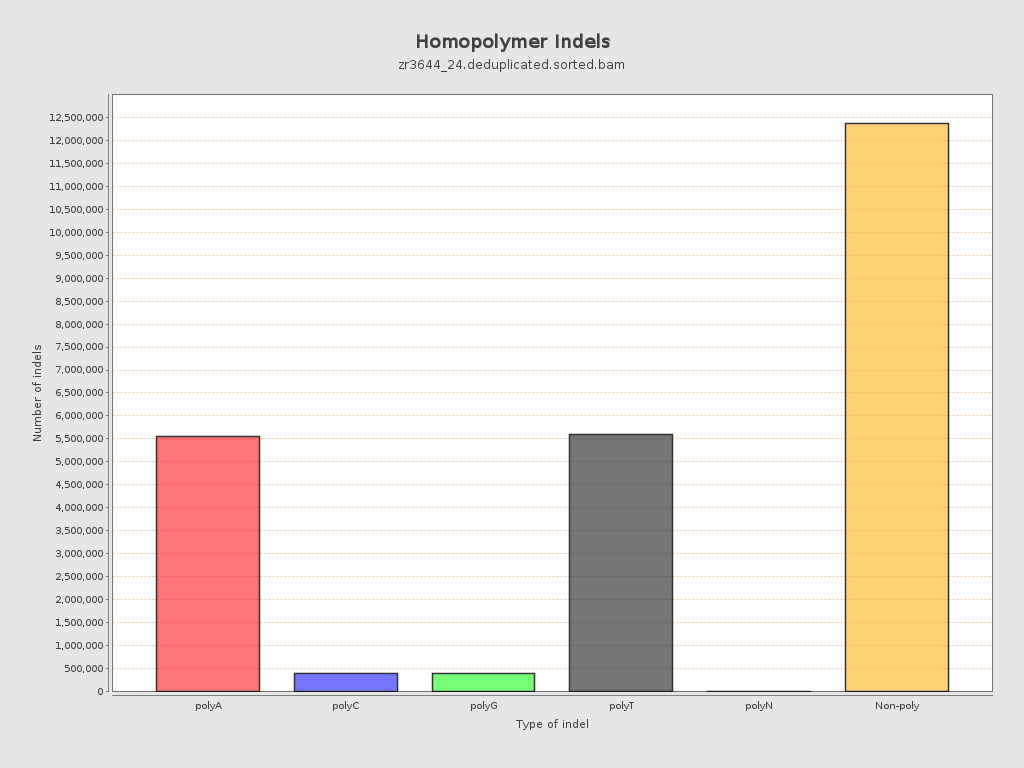
Mismatches and indels
| General error rate | 19.49% |
| Mismatches | 1,178,210,732 |
| Insertions | 12,997,487 |
| Mapped reads with at least one insertion | 16.71% |
| Deletions | 11,286,578 |
| Mapped reads with at least one deletion | 15.83% |
| Homopolymer indels | 49.06% |
Chromosome stats
| Name | Length | Mapped bases | Mean coverage | Standard deviation |
| NC_088853.1 | 76070991 | 626888047 | 8.2408 | 18.2574 |
| NC_088854.1 | 61469542 | 763654043 | 12.4233 | 11.9537 |
| NC_088855.1 | 61039741 | 764243908 | 12.5204 | 11.4712 |
| NC_088856.1 | 57946171 | 583604386 | 10.0715 | 12.656 |
| NC_088857.1 | 57274926 | 697259021 | 12.1739 | 11.8147 |
| NC_088858.1 | 56905015 | 716529472 | 12.5917 | 11.3846 |
| NC_088859.1 | 53672946 | 694824770 | 12.9455 | 11.6928 |
| NC_088860.1 | 51133819 | 572534959 | 11.1968 | 12.0162 |
| NC_088861.1 | 50364239 | 430951622 | 8.5567 | 11.7483 |
| NC_088862.1 | 37310742 | 371393050 | 9.9541 | 12.484 |
| NW_027062568.1 | 15579 | 151816 | 9.7449 | 8.2282 |
| NW_027062569.1 | 16498 | 130623 | 7.9175 | 15.1315 |
| NW_027062570.1 | 4000 | 68658 | 17.1645 | 17.4584 |
| NW_027062571.1 | 36893 | 8411 | 0.228 | 0.7713 |
| NW_027062572.1 | 51000 | 47159 | 0.9247 | 3.289 |
| NW_027062573.1 | 2000 | 50513 | 25.2565 | 13.8465 |
| NW_027062574.1 | 37061 | 5982 | 0.1614 | 1.1354 |
| NW_027062575.1 | 49428 | 405284 | 8.1995 | 16.8307 |
| NW_027062576.1 | 49232 | 190325 | 3.8659 | 8.8517 |
| NW_027062577.1 | 17087 | 165555 | 9.6889 | 7.2876 |
| NW_027062578.1 | 34507 | 604844 | 17.5282 | 10.4546 |
| NW_027062579.1 | 64000 | 519368 | 8.1151 | 9.4959 |
| NW_027062580.1 | 24229 | 259509 | 10.7107 | 10.5448 |
| NW_027062581.1 | 5000 | 58219 | 11.6438 | 13.8743 |
| NW_027062582.1 | 18808 | 185099 | 9.8415 | 7.7641 |
| NW_027062583.1 | 1000 | 0 | 0 | 0 |
| NW_027062584.1 | 74000 | 15749 | 0.2128 | 1.2679 |
| NW_027062585.1 | 39334 | 350659 | 8.9149 | 9.1013 |
| NW_027062586.1 | 258015 | 704739 | 2.7314 | 6.2723 |