Input data and parameters
QualiMap command line
| qualimap bamqc -bam zr3644_23.deduplicated.sorted.bam -nw 400 -hm 3 |
Alignment
| Command line: | "bismark -1 zr3644_23_R1_val_1_val_1_val_1.fq.gz -2 zr3644_23_R2_val_2_val_2_val_2.fq.gz --genome BismarkIndex --bam --score_min L,0,-0.8 --non_directional --prefix zr3644_23 --multicore 2" |
| Draw chromosome limits: | no |
| Analyze overlapping paired-end reads: | yes |
| Program: | Bismark (v0.24.2) |
| Analysis date: | Wed Apr 16 02:20:23 GMT 2025 |
| Size of a homopolymer: | 3 |
| Skip duplicate alignments: | no |
| Number of windows: | 400 |
| BAM file: | zr3644_23.deduplicated.sorted.bam |
Summary
Globals
| Reference size | 563,985,803 |
| Number of reads | 45,049,882 |
| Mapped reads | 45,049,882 / 100% |
| Unmapped reads | 0 / 0% |
| Mapped paired reads | 45,049,882 / 100% |
| Mapped reads, first in pair | 22,524,941 / 50% |
| Mapped reads, second in pair | 22,524,941 / 50% |
| Mapped reads, both in pair | 45,049,882 / 100% |
| Mapped reads, singletons | 0 / 0% |
| Secondary alignments | 0 |
| Read min/max/mean length | 20 / 115 / 105.04 |
| Overlapping read pairs | 19,256,117 / 85.49% |
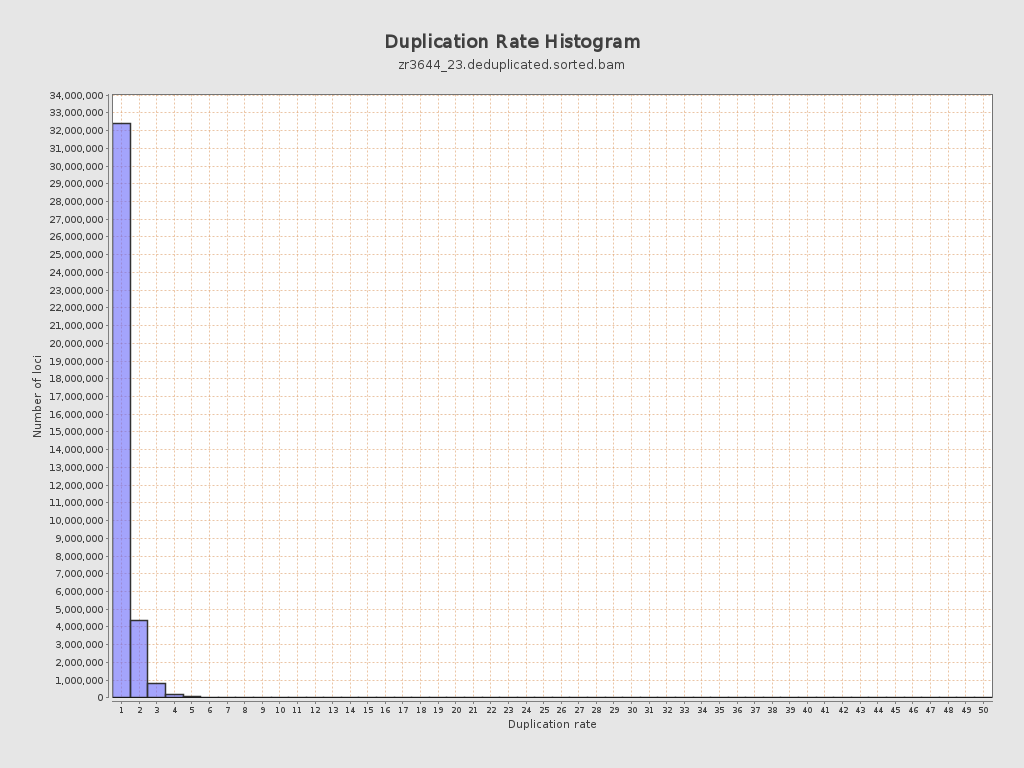
| Duplicated reads (estimated) | 7,167,940 / 15.91% |
| Duplication rate | 14.49% |
| Clipped reads | 0 / 0% |
ACGT Content
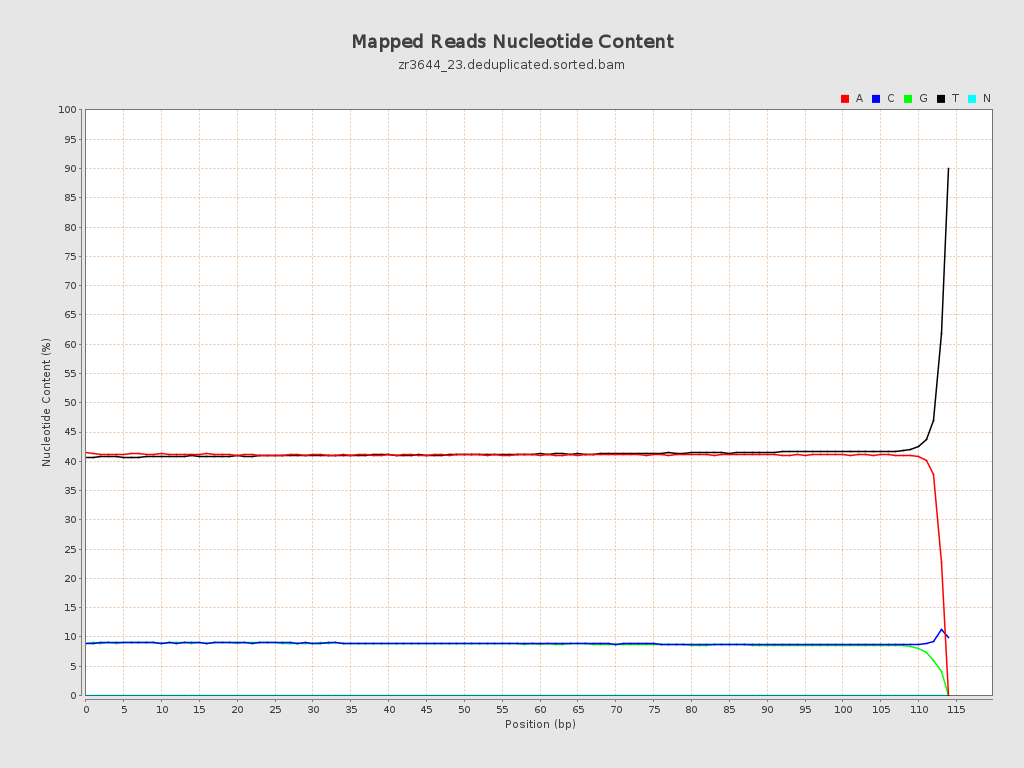
| Number/percentage of A's | 1,927,607,288 / 40.97% |
| Number/percentage of C's | 418,380,790 / 8.89% |
| Number/percentage of T's | 1,947,315,432 / 41.38% |
| Number/percentage of G's | 412,078,644 / 8.76% |
| Number/percentage of N's | 35,955 / 0% |
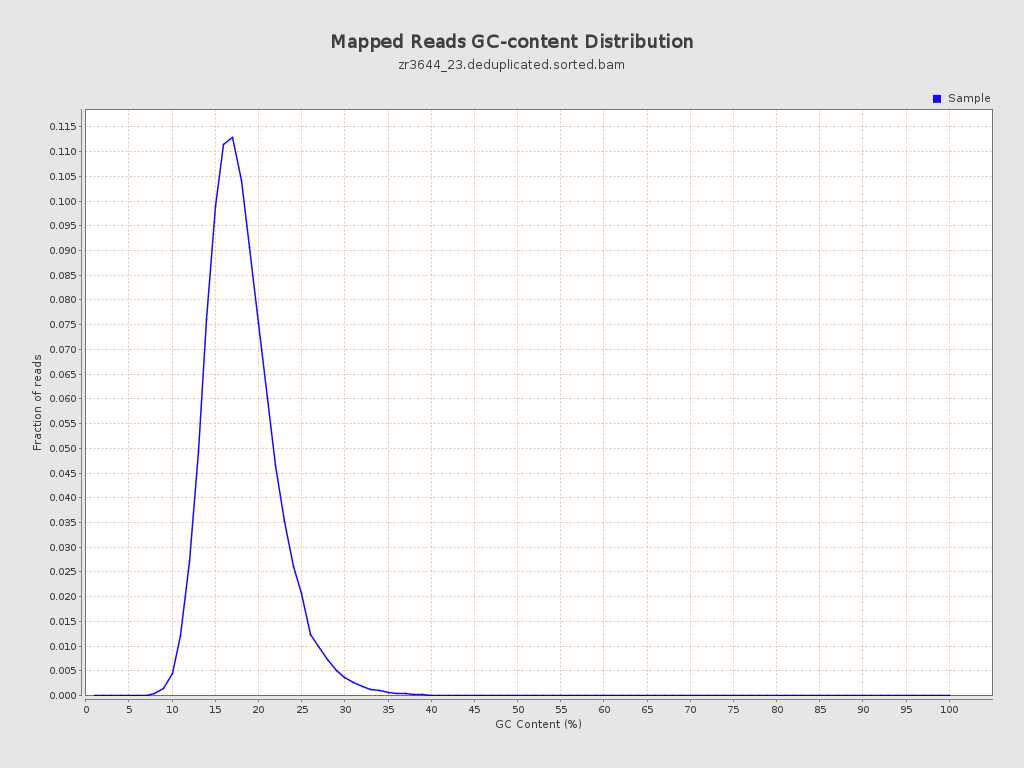
| GC Percentage | 17.65% |
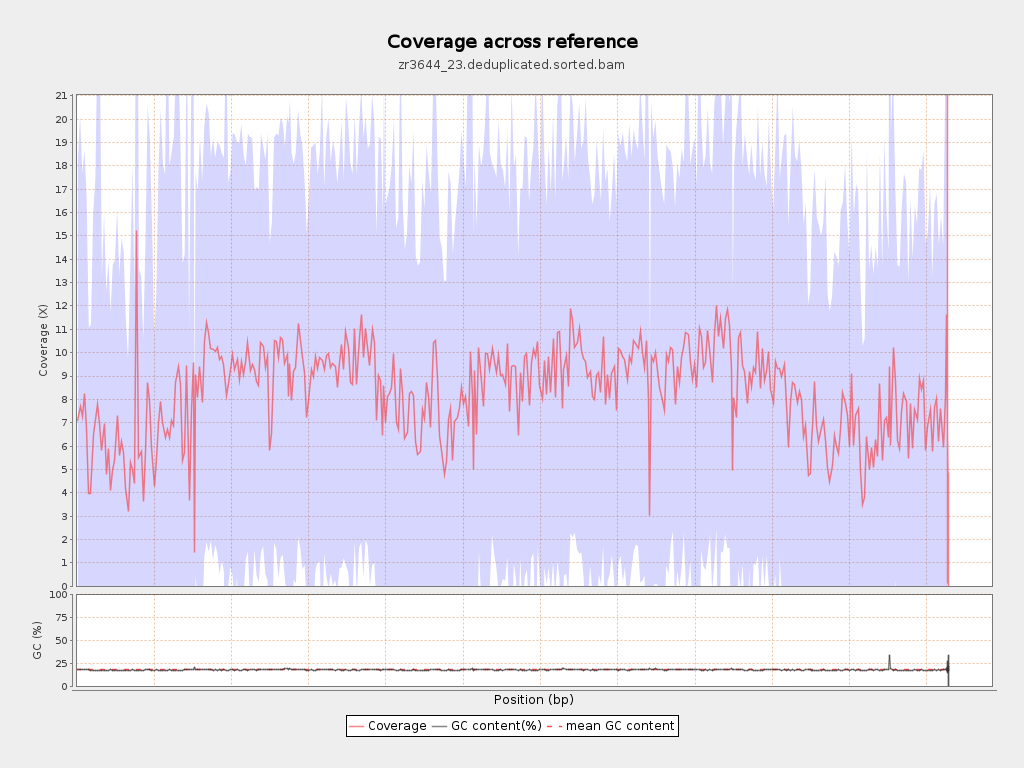
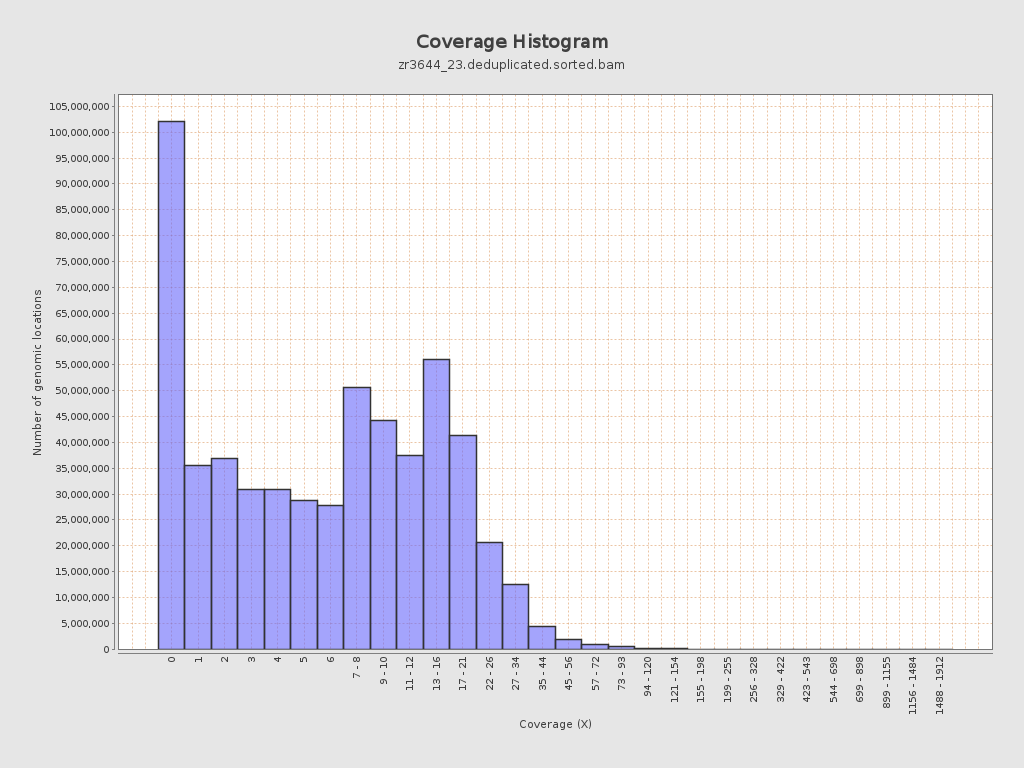
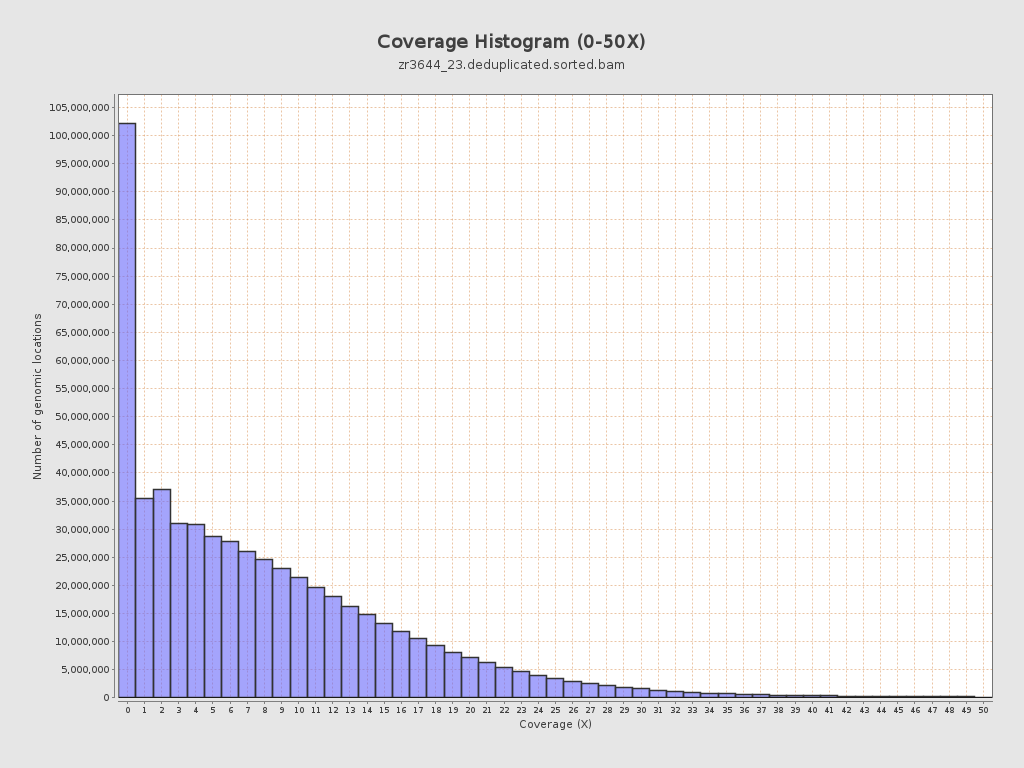
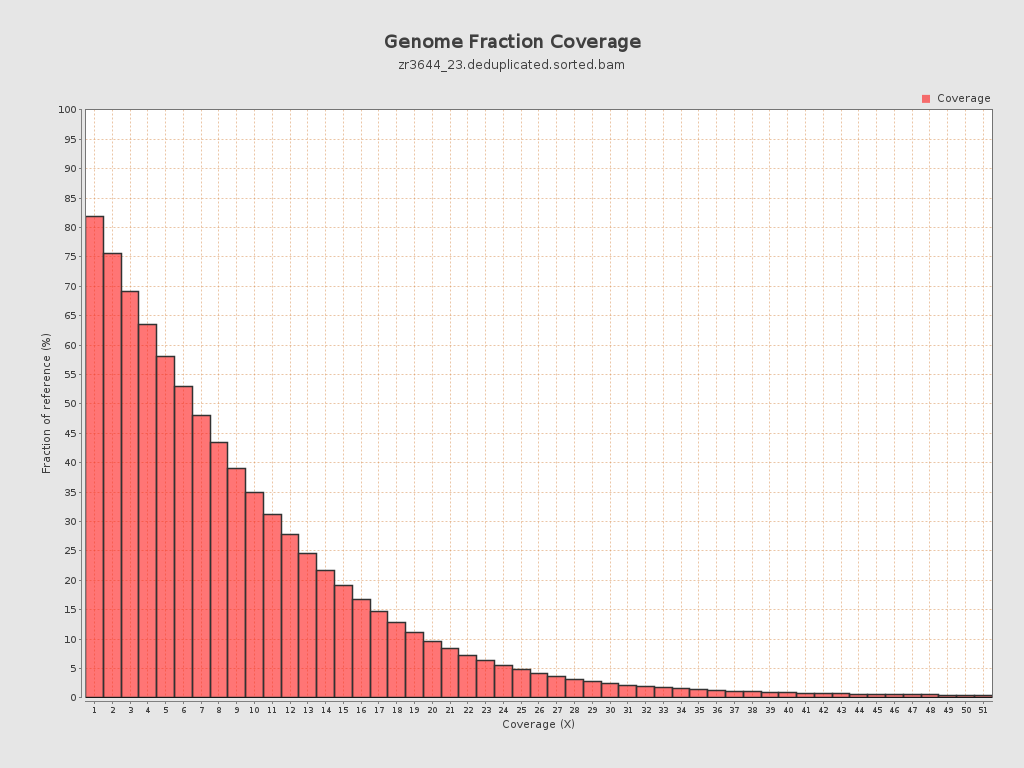
Coverage
| Mean | 8.3799 |
| Standard Deviation | 9.418 |
| Mean (paired-end reads overlap ignored) | 5.93 |
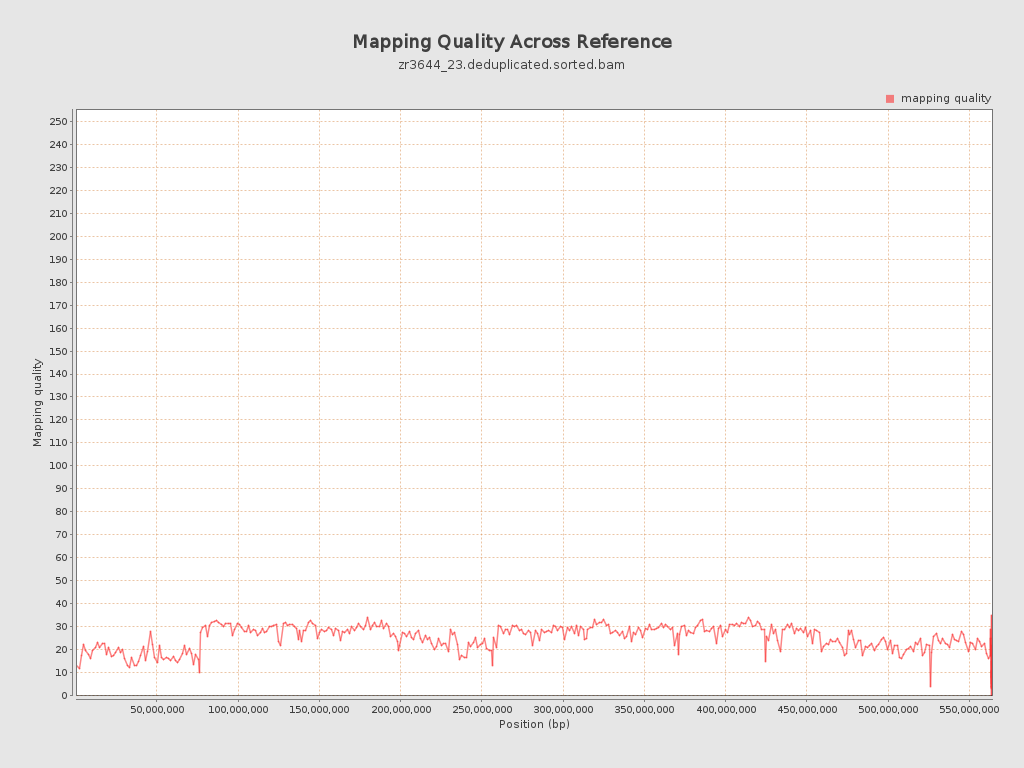
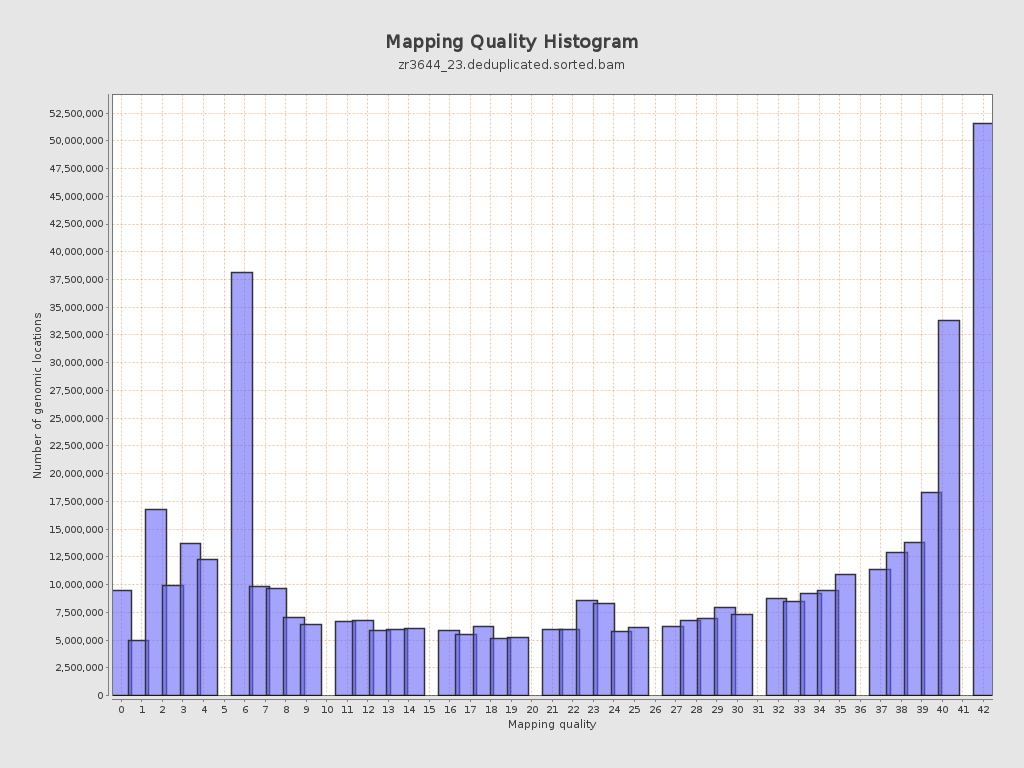
Mapping Quality
| Mean Mapping Quality | 24.75 |
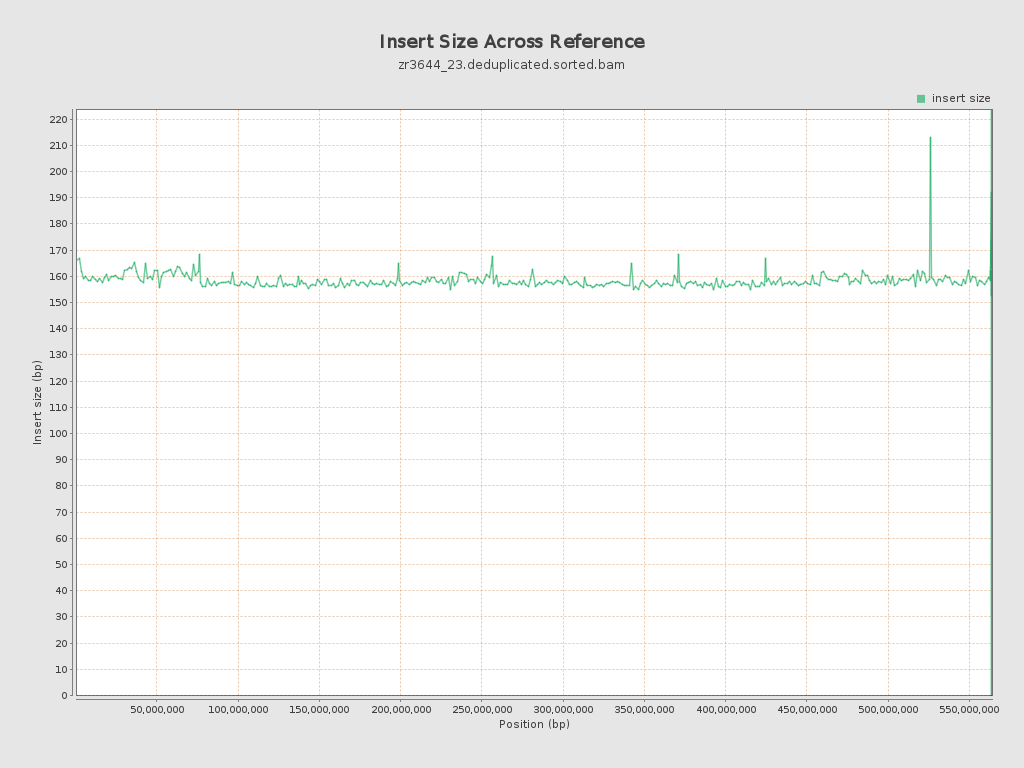
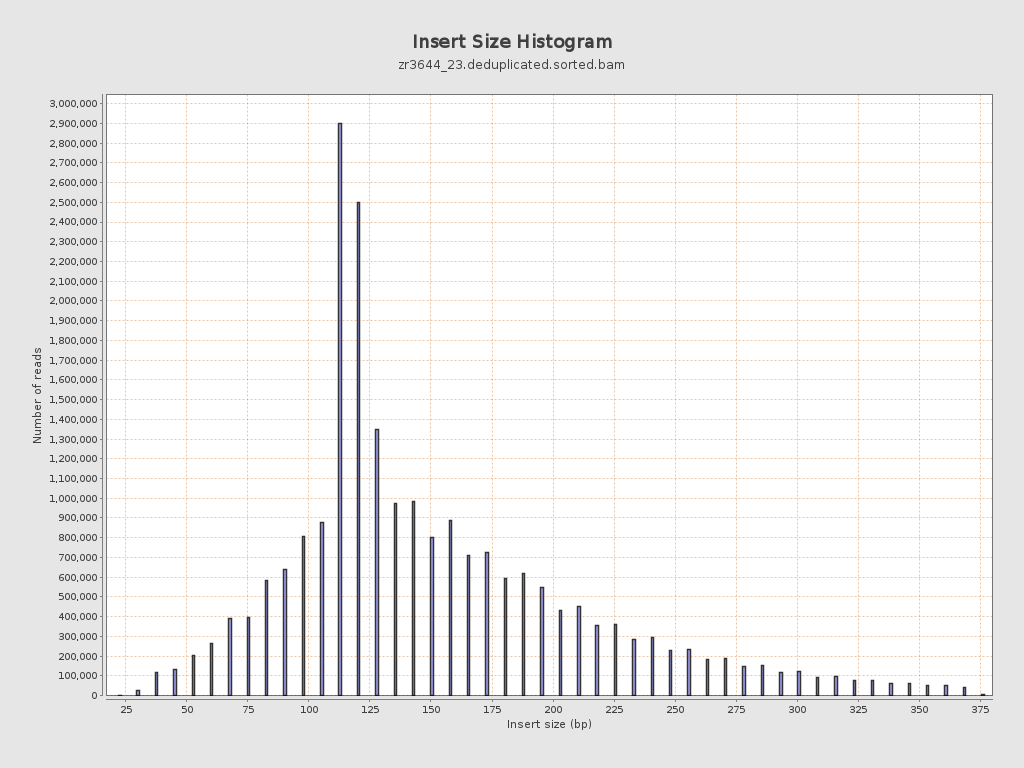
Insert size
| Mean | 157.99 |
| Standard Deviation | 69.4 |
| P25/Median/P75 | 116 / 136 / 188 |
Mismatches and indels
| General error rate | 19.49% |
| Mismatches | 894,237,969 |
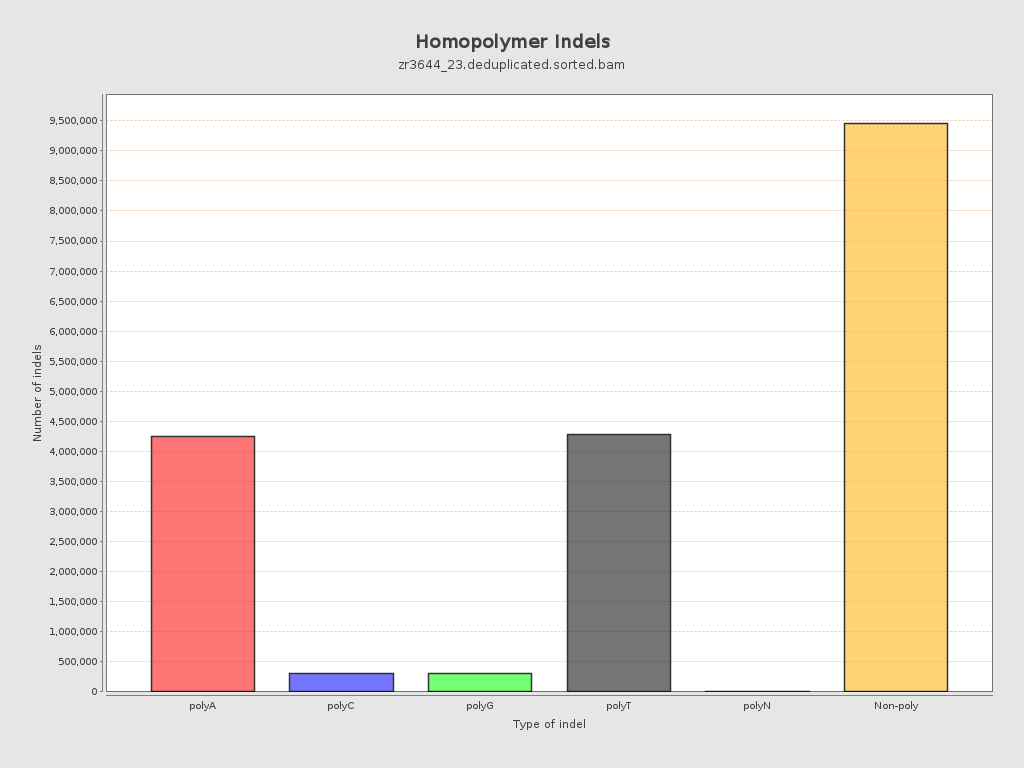
| Insertions | 9,852,939 |
| Mapped reads with at least one insertion | 16.59% |
| Deletions | 8,710,703 |
| Mapped reads with at least one deletion | 16.02% |
| Homopolymer indels | 49.05% |
Chromosome stats
| Name | Length | Mapped bases | Mean coverage | Standard deviation |
| NC_088853.1 | 76070991 | 492818336 | 6.4784 | 10.7474 |
| NC_088854.1 | 61469542 | 582135698 | 9.4703 | 8.9508 |
| NC_088855.1 | 61039741 | 580120476 | 9.504 | 8.8156 |
| NC_088856.1 | 57946171 | 439281213 | 7.5808 | 9.7464 |
| NC_088857.1 | 57274926 | 525441325 | 9.174 | 9.044 |
| NC_088858.1 | 56905015 | 542946236 | 9.5413 | 8.834 |
| NC_088859.1 | 53672946 | 530126753 | 9.877 | 9.2323 |
| NC_088860.1 | 51133819 | 433952472 | 8.4866 | 9.3316 |
| NC_088861.1 | 50364239 | 320230802 | 6.3583 | 8.6667 |
| NC_088862.1 | 37310742 | 275923420 | 7.3953 | 9.1441 |
| NW_027062568.1 | 15579 | 102562 | 6.5833 | 5.9326 |
| NW_027062569.1 | 16498 | 183119 | 11.0995 | 14.3229 |
| NW_027062570.1 | 4000 | 201229 | 50.3073 | 44.1292 |
| NW_027062571.1 | 36893 | 8750 | 0.2372 | 1.2347 |
| NW_027062572.1 | 51000 | 17456 | 0.3423 | 0.8089 |
| NW_027062573.1 | 2000 | 107438 | 53.719 | 44.7752 |
| NW_027062574.1 | 37061 | 4883 | 0.1318 | 0.6544 |
| NW_027062575.1 | 49428 | 249397 | 5.0457 | 10.0146 |
| NW_027062576.1 | 49232 | 144054 | 2.926 | 6.8351 |
| NW_027062577.1 | 17087 | 108741 | 6.364 | 5.6126 |
| NW_027062578.1 | 34507 | 449628 | 13.0301 | 8.1345 |
| NW_027062579.1 | 64000 | 497608 | 7.7751 | 8.9981 |
| NW_027062580.1 | 24229 | 159215 | 6.5713 | 7.3676 |
| NW_027062581.1 | 5000 | 15165 | 3.033 | 6.1914 |
| NW_027062582.1 | 18808 | 38367 | 2.0399 | 3.9235 |
| NW_027062583.1 | 1000 | 0 | 0 | 0 |
| NW_027062584.1 | 74000 | 8685 | 0.1174 | 0.752 |
| NW_027062585.1 | 39334 | 191029 | 4.8566 | 4.89 |
| NW_027062586.1 | 258015 | 656489 | 2.5444 | 4.8616 |