Input data and parameters
QualiMap command line
| qualimap bamqc -bam zr3644_22.deduplicated.sorted.bam -nw 400 -hm 3 |
Alignment
| Command line: | "bismark -1 zr3644_22_R1_val_1_val_1_val_1.fq.gz -2 zr3644_22_R2_val_2_val_2_val_2.fq.gz --genome BismarkIndex --bam --score_min L,0,-0.8 --non_directional --prefix zr3644_22 --multicore 3" |
| Draw chromosome limits: | no |
| Analyze overlapping paired-end reads: | yes |
| Program: | Bismark (v0.24.2) |
| Analysis date: | Wed Apr 16 06:42:27 GMT 2025 |
| Size of a homopolymer: | 3 |
| Skip duplicate alignments: | no |
| Number of windows: | 400 |
| BAM file: | zr3644_22.deduplicated.sorted.bam |
Summary
Globals
| Reference size | 563,985,803 |
| Number of reads | 53,155,204 |
| Mapped reads | 53,155,204 / 100% |
| Unmapped reads | 0 / 0% |
| Mapped paired reads | 53,155,204 / 100% |
| Mapped reads, first in pair | 26,577,602 / 50% |
| Mapped reads, second in pair | 26,577,602 / 50% |
| Mapped reads, both in pair | 53,155,204 / 100% |
| Mapped reads, singletons | 0 / 0% |
| Secondary alignments | 0 |
| Read min/max/mean length | 20 / 115 / 105.55 |
| Overlapping read pairs | 22,363,317 / 84.14% |
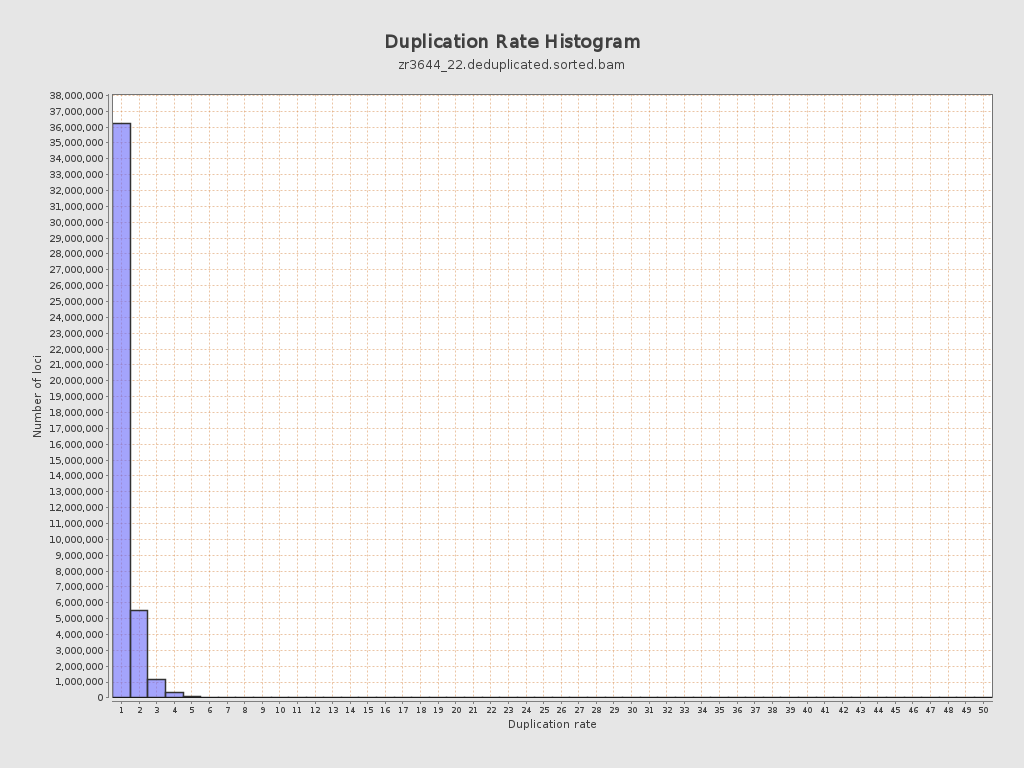
| Duplicated reads (estimated) | 9,749,365 / 18.34% |
| Duplication rate | 16.56% |
| Clipped reads | 0 / 0% |
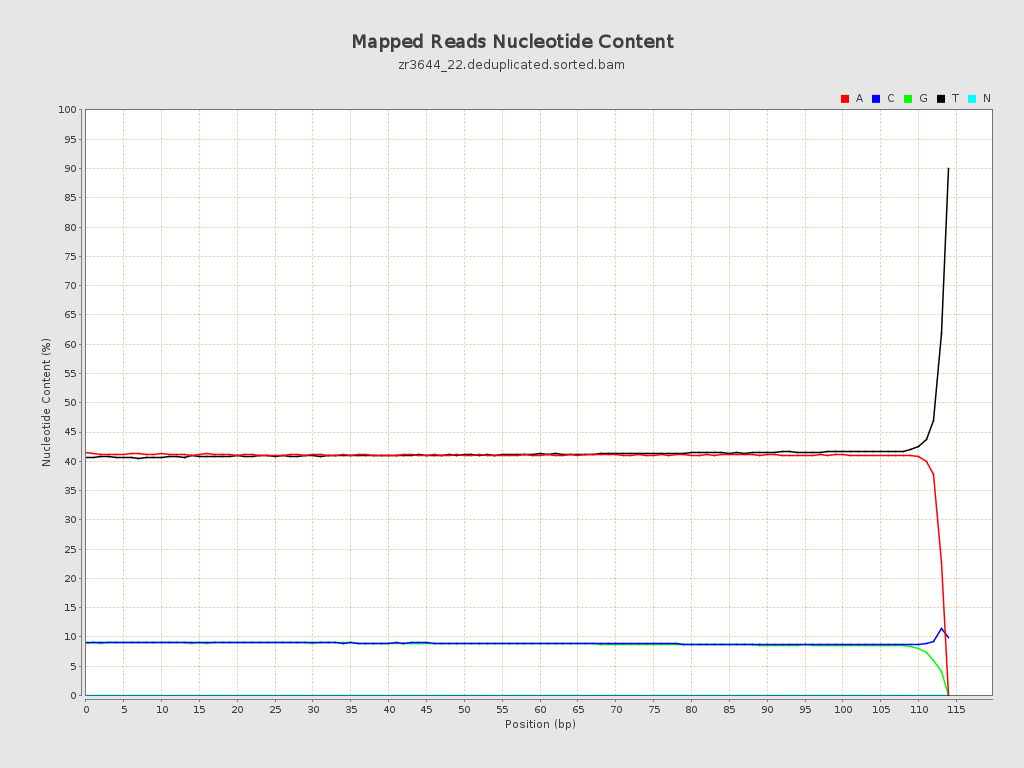
ACGT Content
| Number/percentage of A's | 2,283,514,013 / 40.93% |
| Number/percentage of C's | 498,027,521 / 8.93% |
| Number/percentage of T's | 2,306,528,889 / 41.35% |
| Number/percentage of G's | 490,583,448 / 8.79% |
| Number/percentage of N's | 42,100 / 0% |
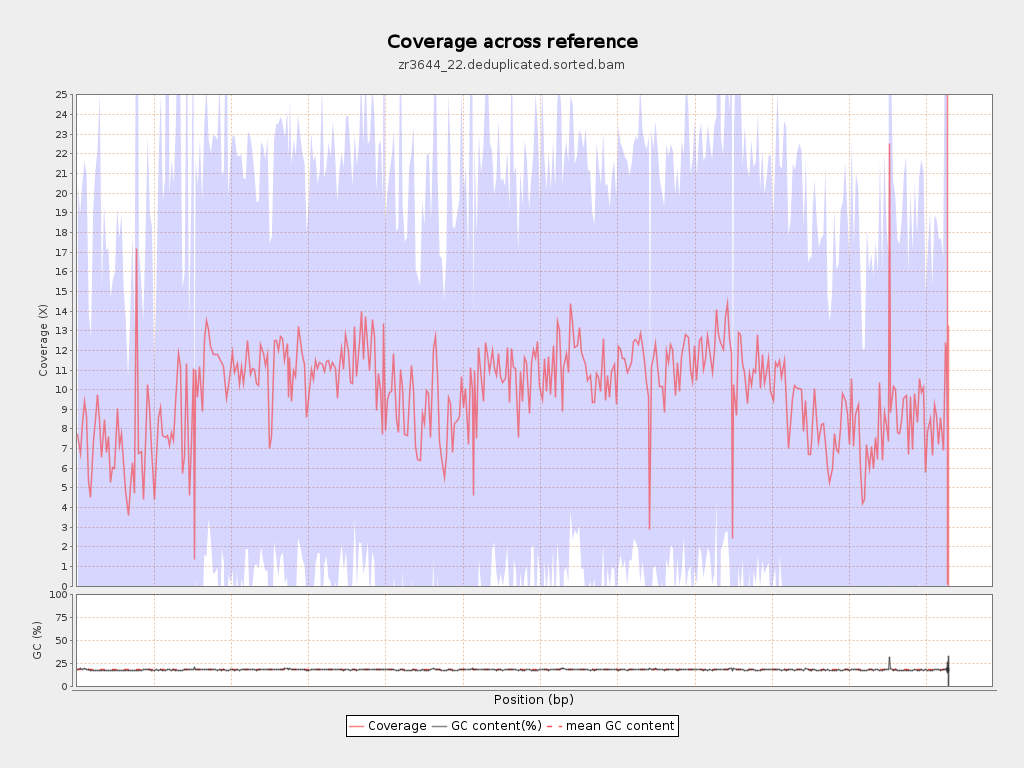
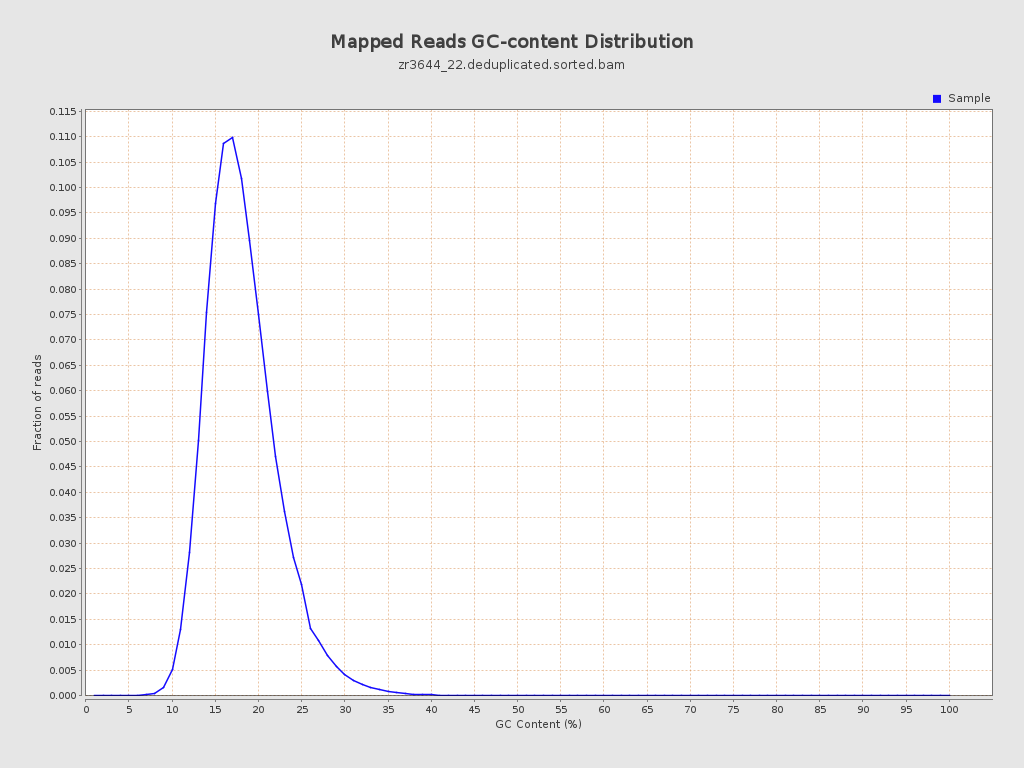
| GC Percentage | 17.72% |
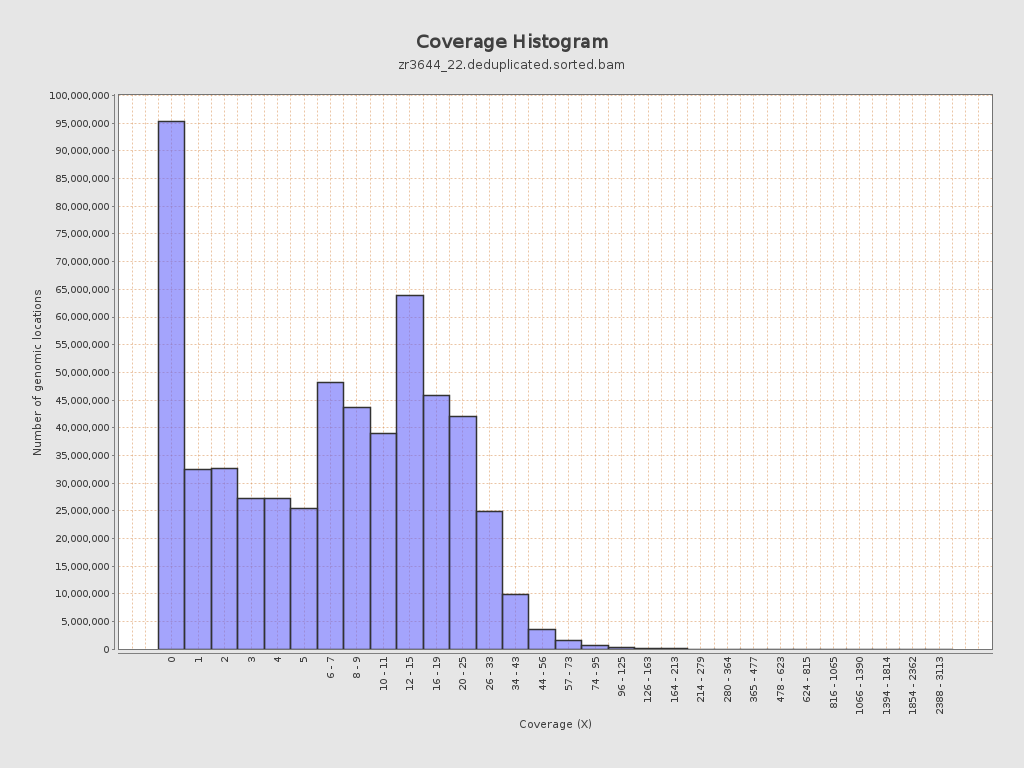
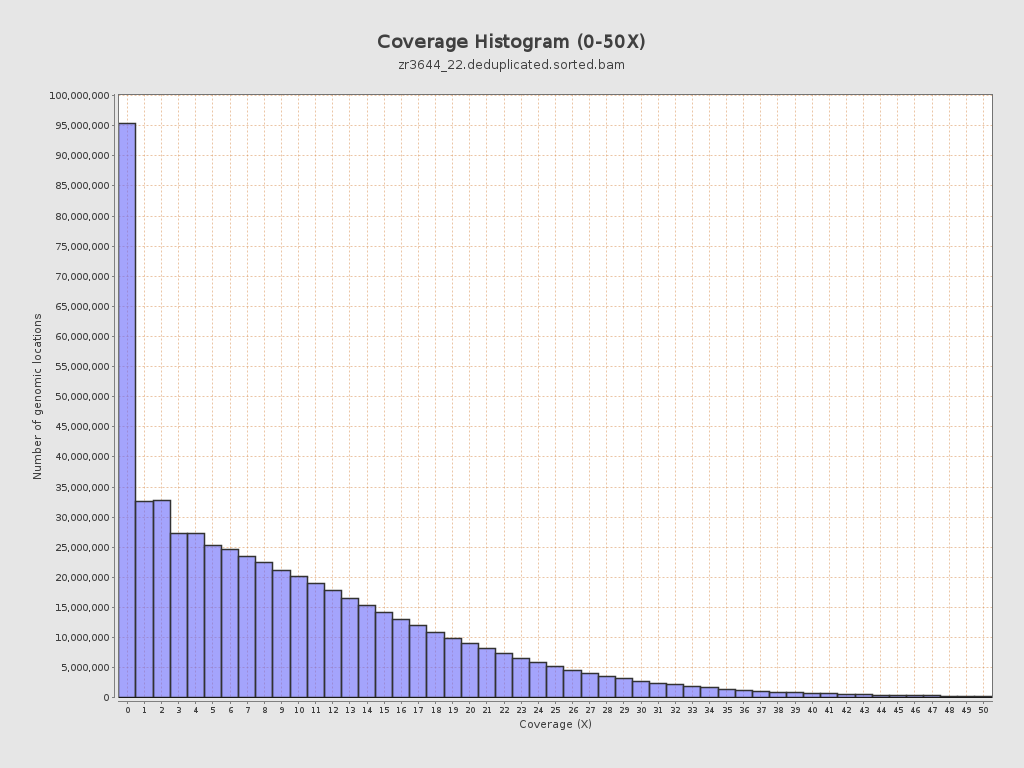
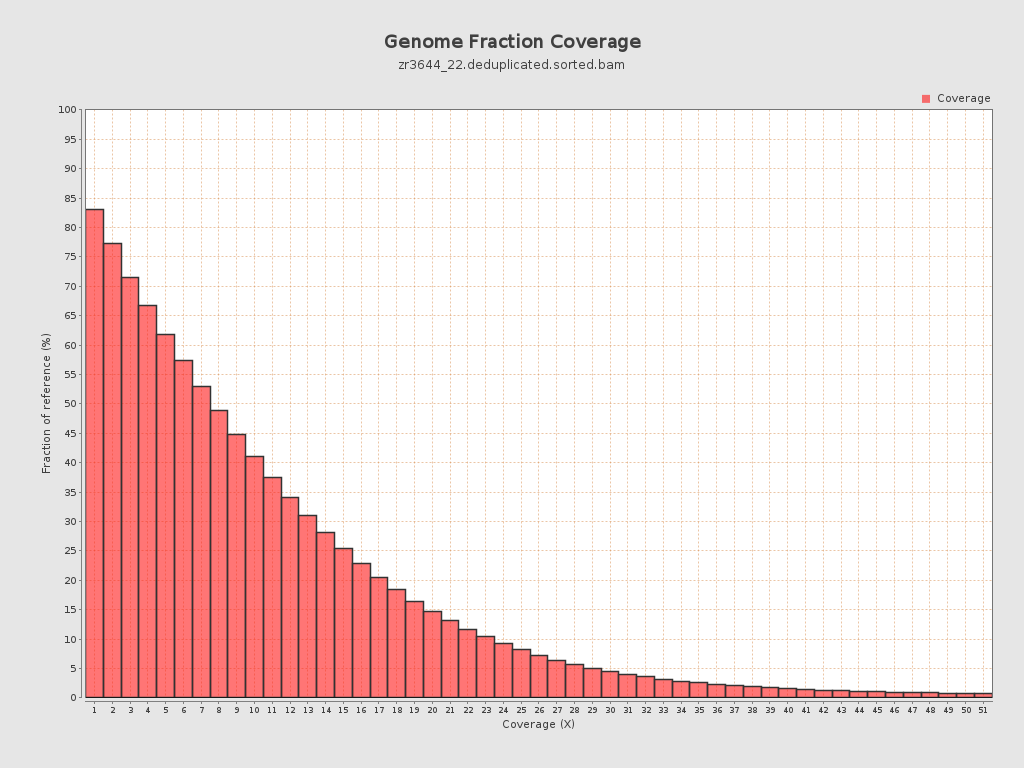
Coverage
| Mean | 9.9349 |
| Standard Deviation | 11.2036 |
| Mean (paired-end reads overlap ignored) | 7.11 |
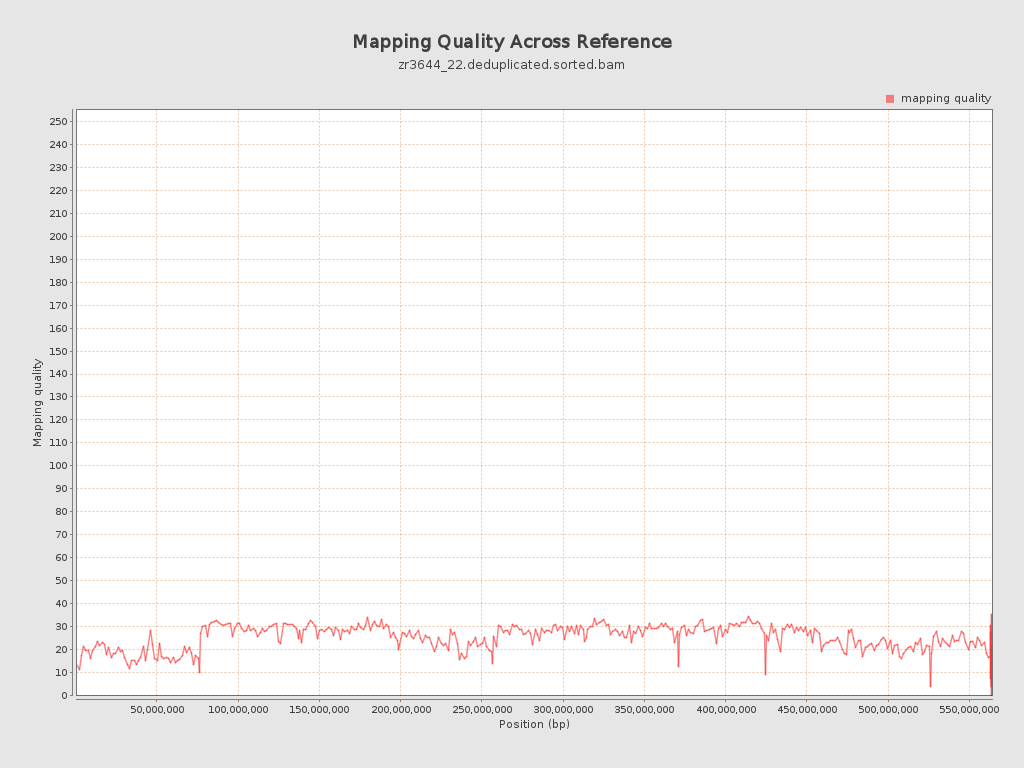
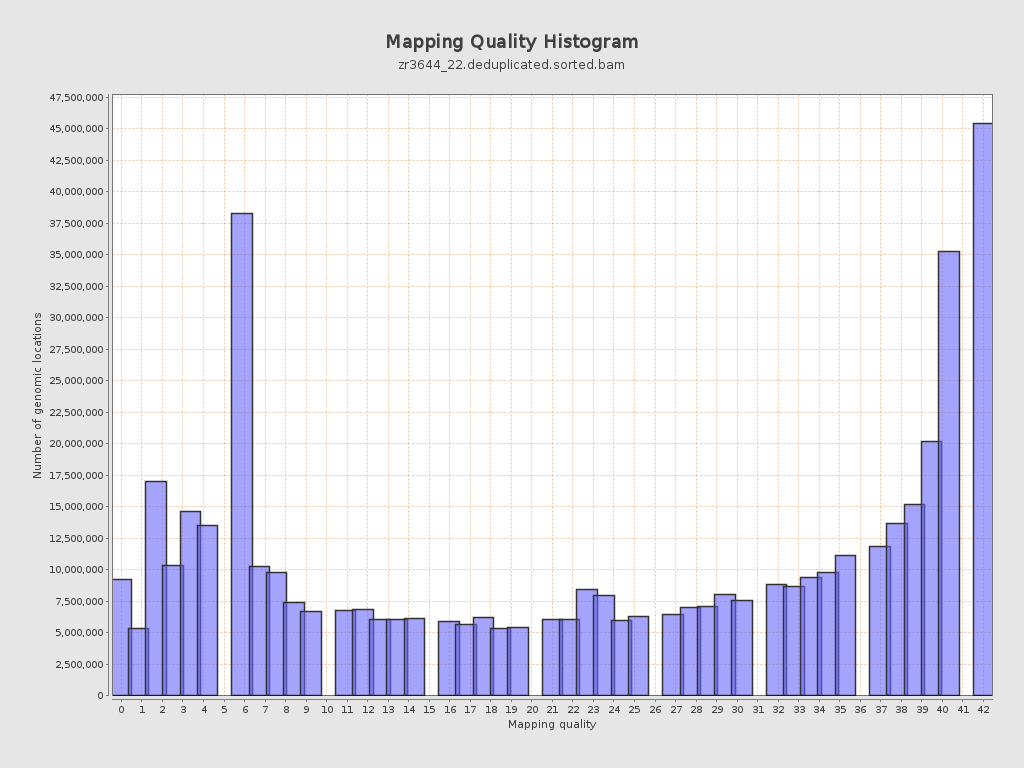
Mapping Quality
| Mean Mapping Quality | 24.85 |
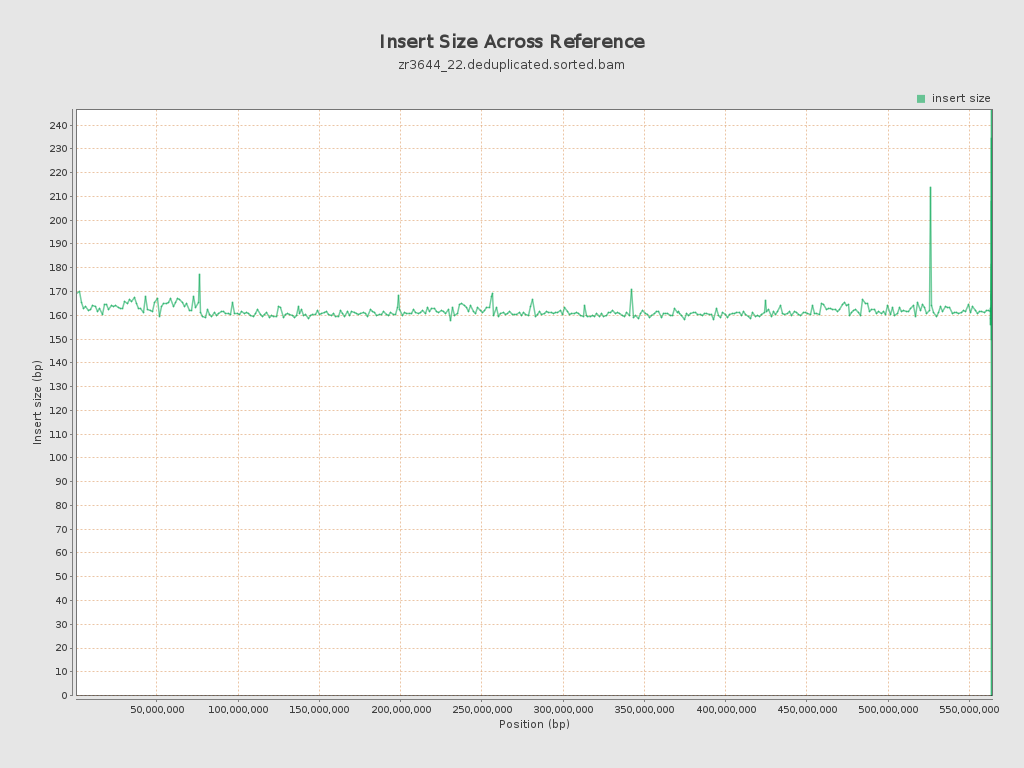
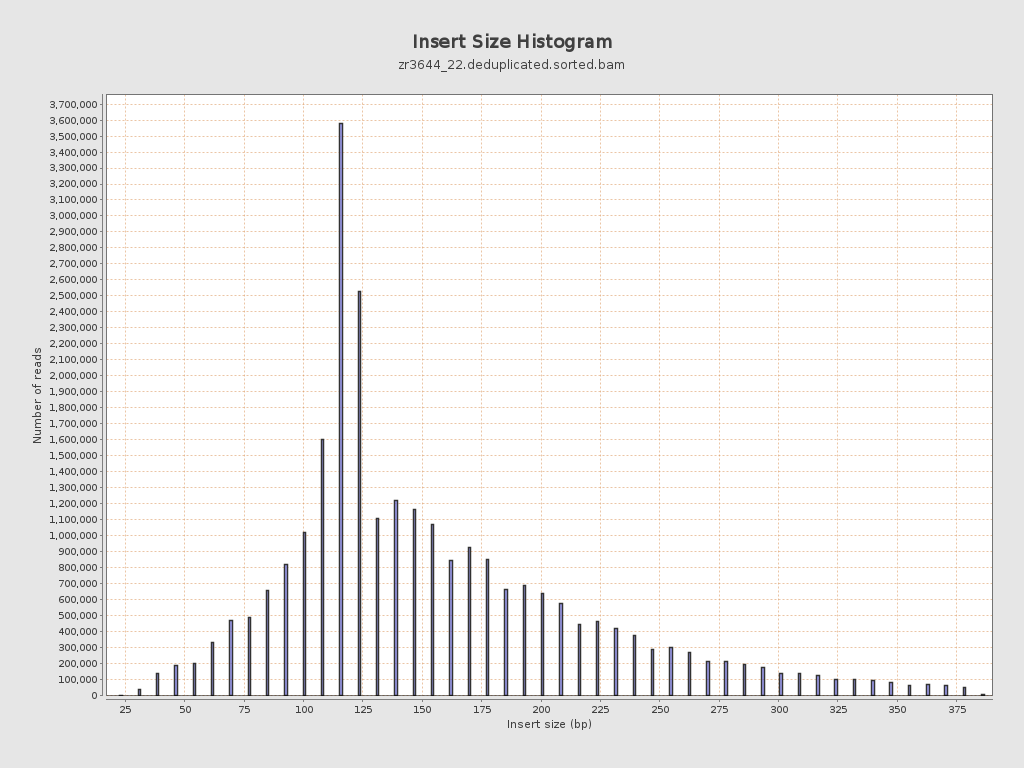
Insert size
| Mean | 161.46 |
| Standard Deviation | 71.63 |
| P25/Median/P75 | 117 / 139 / 193 |
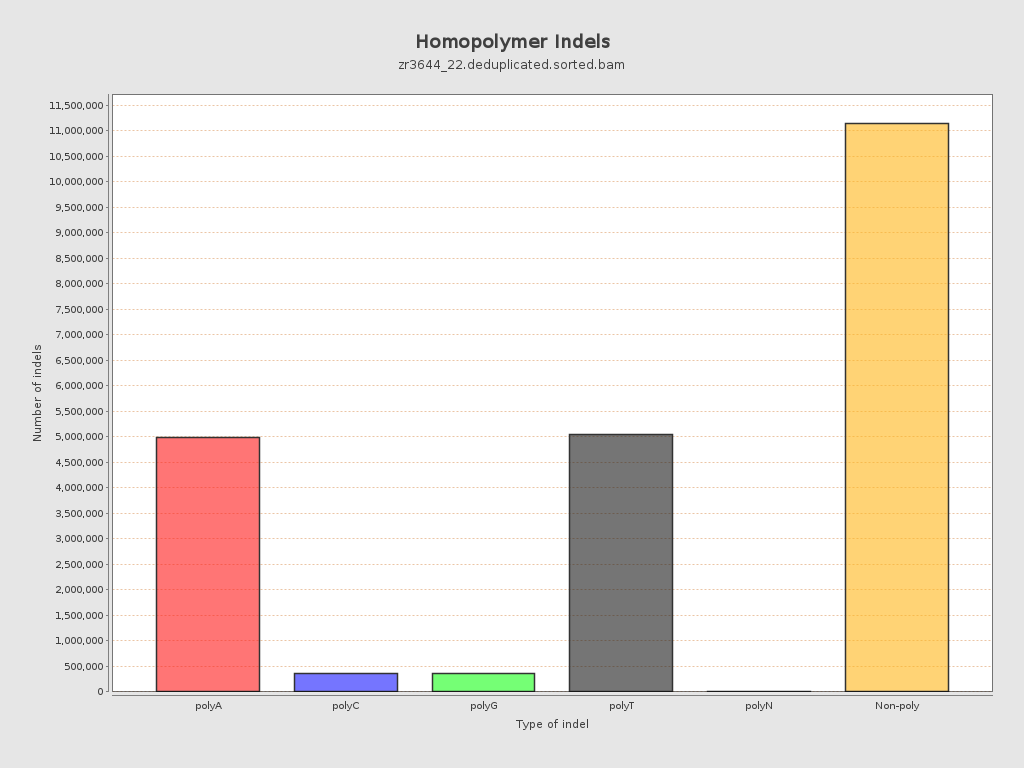
Mismatches and indels
| General error rate | 19.5% |
| Mismatches | 1,061,106,867 |
| Insertions | 11,620,550 |
| Mapped reads with at least one insertion | 16.57% |
| Deletions | 10,264,765 |
| Mapped reads with at least one deletion | 15.98% |
| Homopolymer indels | 49.05% |
Chromosome stats
| Name | Length | Mapped bases | Mean coverage | Standard deviation |
| NC_088853.1 | 76070991 | 574441191 | 7.5514 | 12.7243 |
| NC_088854.1 | 61469542 | 689208197 | 11.2122 | 10.7842 |
| NC_088855.1 | 61039741 | 688238459 | 11.2753 | 10.5787 |
| NC_088856.1 | 57946171 | 521249596 | 8.9954 | 11.378 |
| NC_088857.1 | 57274926 | 624617386 | 10.9056 | 10.731 |
| NC_088858.1 | 56905015 | 644336467 | 11.323 | 10.2588 |
| NC_088859.1 | 53672946 | 630360693 | 11.7445 | 11.0202 |
| NC_088860.1 | 51133819 | 520455375 | 10.1783 | 11.2278 |
| NC_088861.1 | 50364239 | 379960649 | 7.5443 | 10.0959 |
| NC_088862.1 | 37310742 | 327040853 | 8.7653 | 11.424 |
| NW_027062568.1 | 15579 | 118804 | 7.6259 | 6.9879 |
| NW_027062569.1 | 16498 | 110065 | 6.6714 | 13.7697 |
| NW_027062570.1 | 4000 | 51214 | 12.8035 | 13.5564 |
| NW_027062571.1 | 36893 | 9122 | 0.2473 | 1.0015 |
| NW_027062572.1 | 51000 | 38334 | 0.7516 | 1.8785 |
| NW_027062573.1 | 2000 | 51738 | 25.869 | 14.5921 |
| NW_027062574.1 | 37061 | 3712 | 0.1002 | 0.5722 |
| NW_027062575.1 | 49428 | 308737 | 6.2462 | 12.6411 |
| NW_027062576.1 | 49232 | 171363 | 3.4807 | 7.6474 |
| NW_027062577.1 | 17087 | 133373 | 7.8055 | 5.8112 |
| NW_027062578.1 | 34507 | 550936 | 15.9659 | 8.5768 |
| NW_027062579.1 | 64000 | 394256 | 6.1602 | 8.0877 |
| NW_027062580.1 | 24229 | 163217 | 6.7364 | 7.5045 |
| NW_027062581.1 | 5000 | 12720 | 2.544 | 6.9499 |
| NW_027062582.1 | 18808 | 249079 | 13.2432 | 11.2022 |
| NW_027062583.1 | 1000 | 0 | 0 | 0 |
| NW_027062584.1 | 74000 | 11078 | 0.1497 | 0.9049 |
| NW_027062585.1 | 39334 | 240219 | 6.1072 | 6.5348 |
| NW_027062586.1 | 258015 | 636863 | 2.4683 | 5.411 |