Input data and parameters
QualiMap command line
| qualimap bamqc -bam zr3644_21.deduplicated.sorted.bam -nw 400 -hm 3 |
Alignment
| Command line: | "bismark -1 zr3644_21_R1_val_1_val_1_val_1.fq.gz -2 zr3644_21_R2_val_2_val_2_val_2.fq.gz --genome BismarkIndex --bam --score_min L,0,-0.8 --non_directional --prefix zr3644_21 --multicore 3" |
| Draw chromosome limits: | no |
| Analyze overlapping paired-end reads: | yes |
| Program: | Bismark (v0.24.2) |
| Analysis date: | Wed Apr 16 07:30:36 GMT 2025 |
| Size of a homopolymer: | 3 |
| Skip duplicate alignments: | no |
| Number of windows: | 400 |
| BAM file: | zr3644_21.deduplicated.sorted.bam |
Summary
Globals
| Reference size | 563,985,803 |
| Number of reads | 56,662,836 |
| Mapped reads | 56,662,836 / 100% |
| Unmapped reads | 0 / 0% |
| Mapped paired reads | 56,662,836 / 100% |
| Mapped reads, first in pair | 28,331,418 / 50% |
| Mapped reads, second in pair | 28,331,418 / 50% |
| Mapped reads, both in pair | 56,662,836 / 100% |
| Mapped reads, singletons | 0 / 0% |
| Secondary alignments | 0 |
| Read min/max/mean length | 20 / 115 / 105.88 |
| Overlapping read pairs | 23,494,387 / 82.93% |
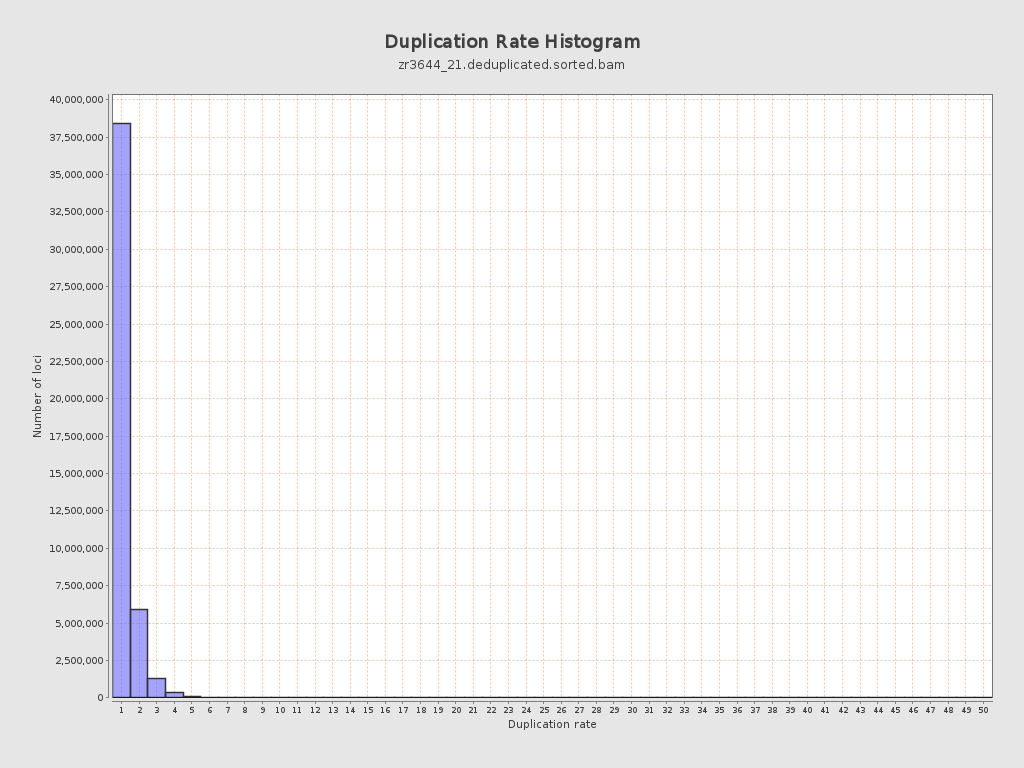
| Duplicated reads (estimated) | 10,522,200 / 18.57% |
| Duplication rate | 16.77% |
| Clipped reads | 0 / 0% |
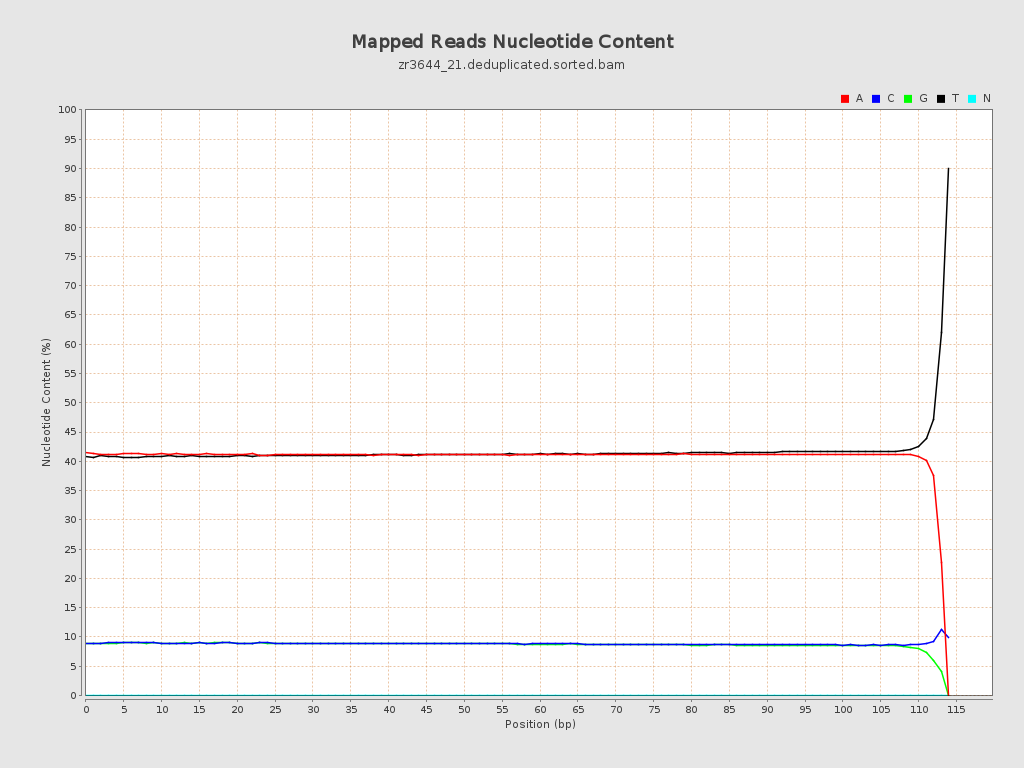
ACGT Content
| Number/percentage of A's | 2,446,360,345 / 41.01% |
| Number/percentage of C's | 527,998,571 / 8.85% |
| Number/percentage of T's | 2,470,107,138 / 41.41% |
| Number/percentage of G's | 520,836,856 / 8.73% |
| Number/percentage of N's | 43,616 / 0% |
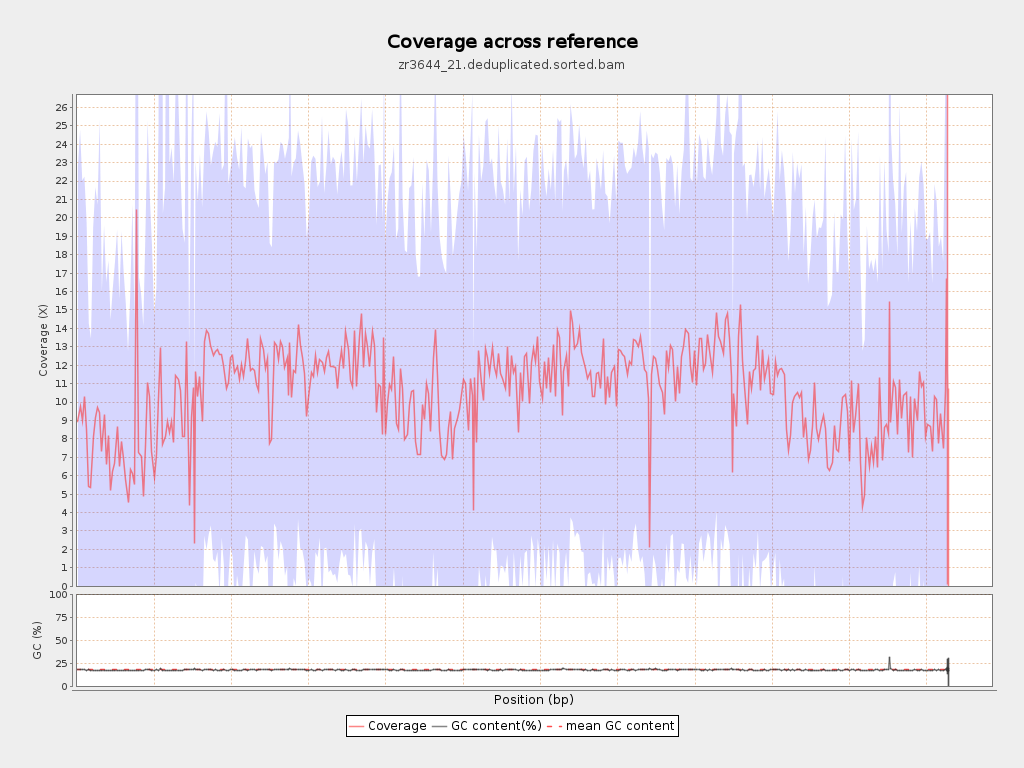
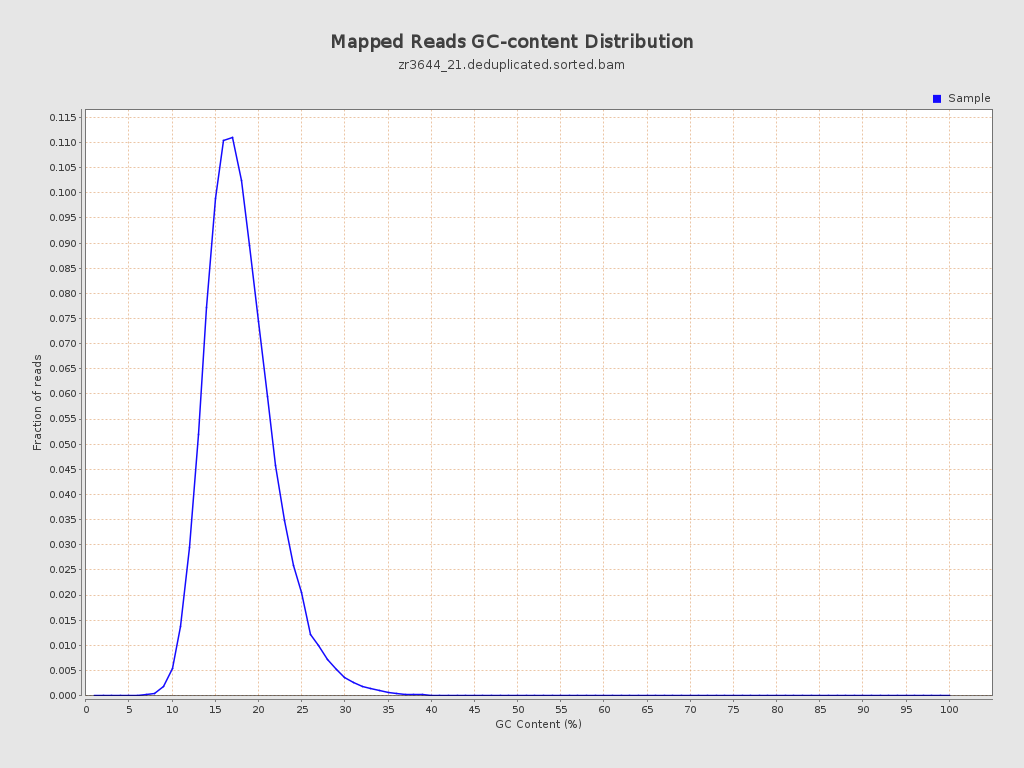
| GC Percentage | 17.58% |
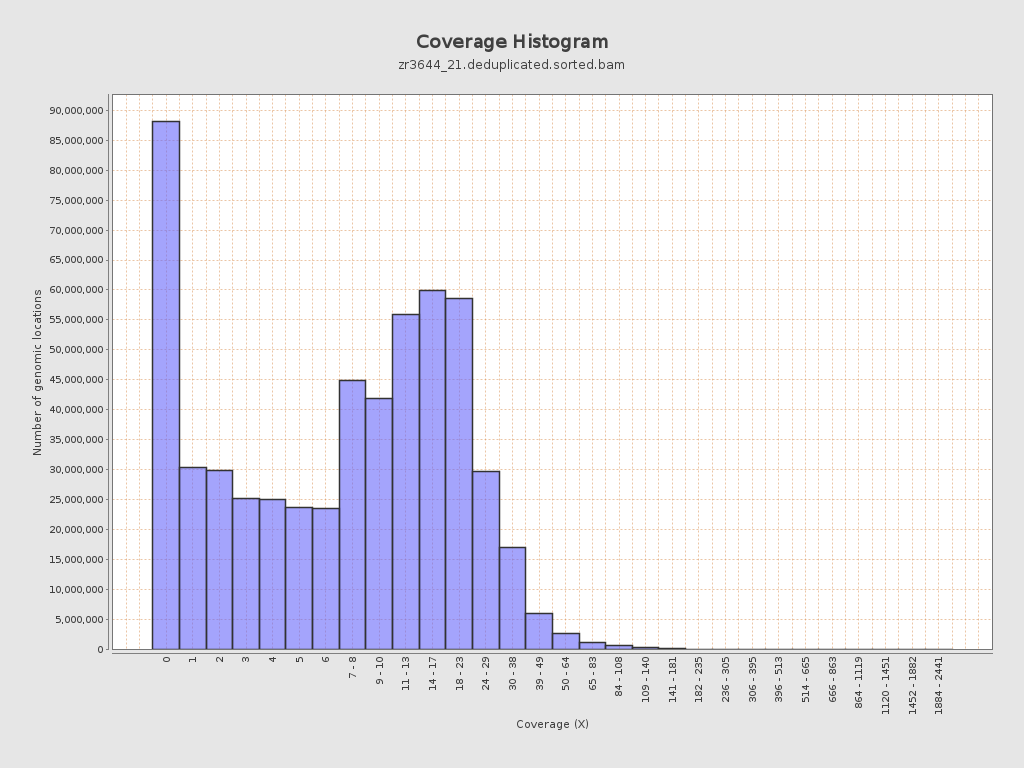
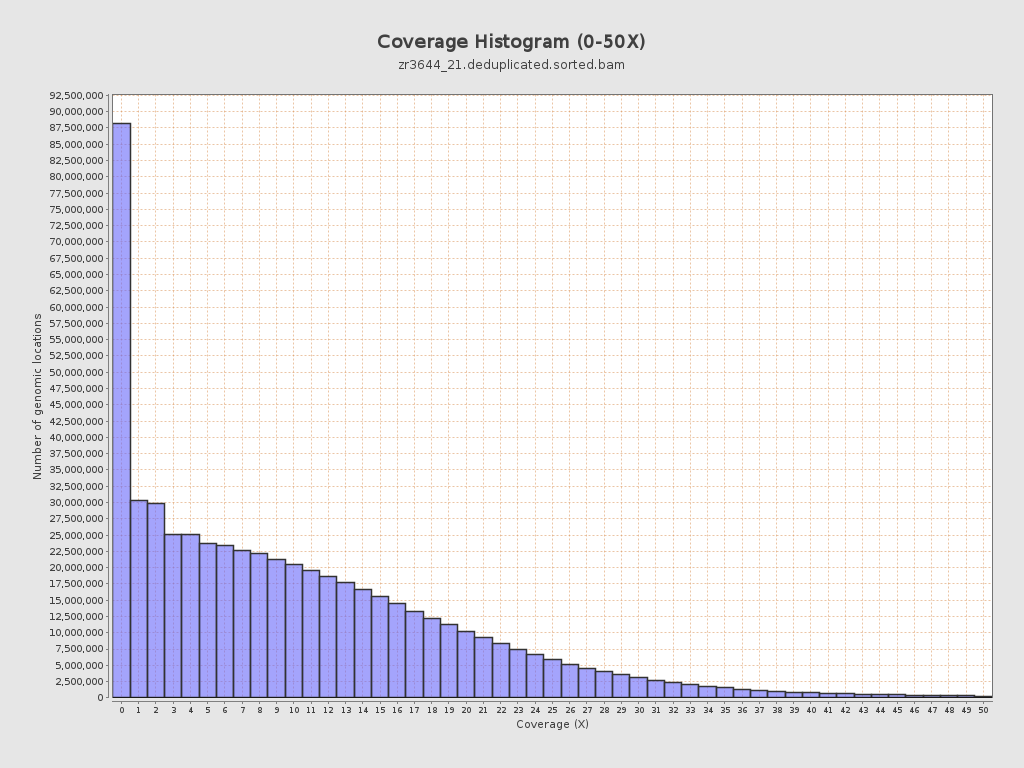
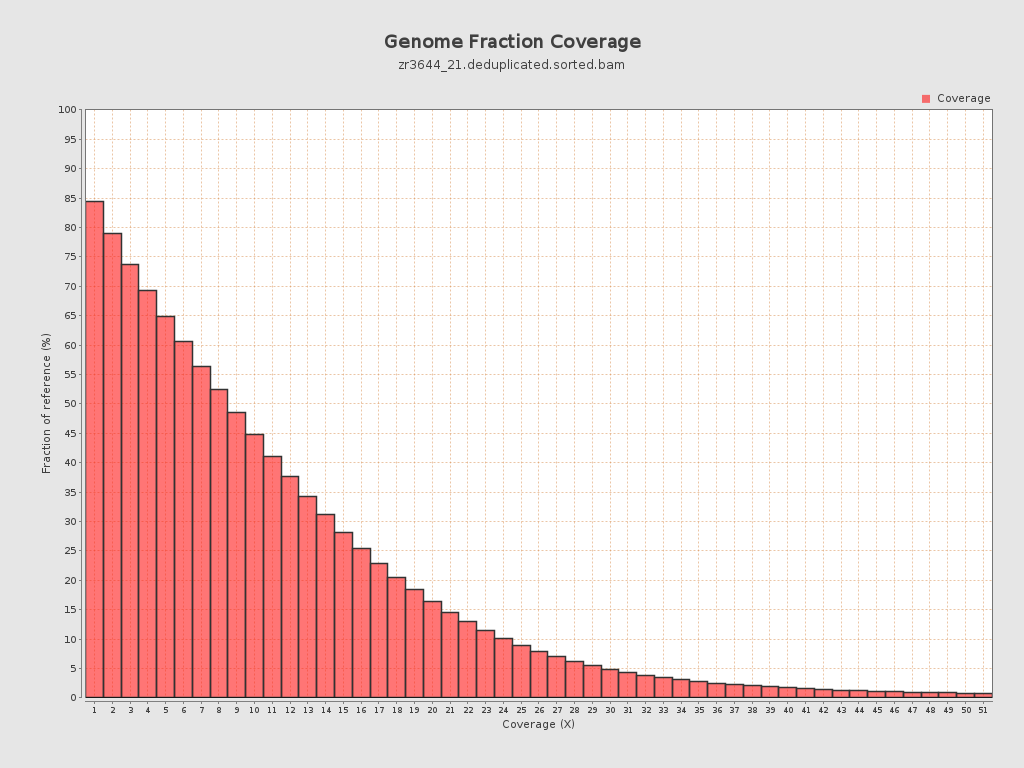
Coverage
| Mean | 10.6244 |
| Standard Deviation | 11.9693 |
| Mean (paired-end reads overlap ignored) | 7.67 |
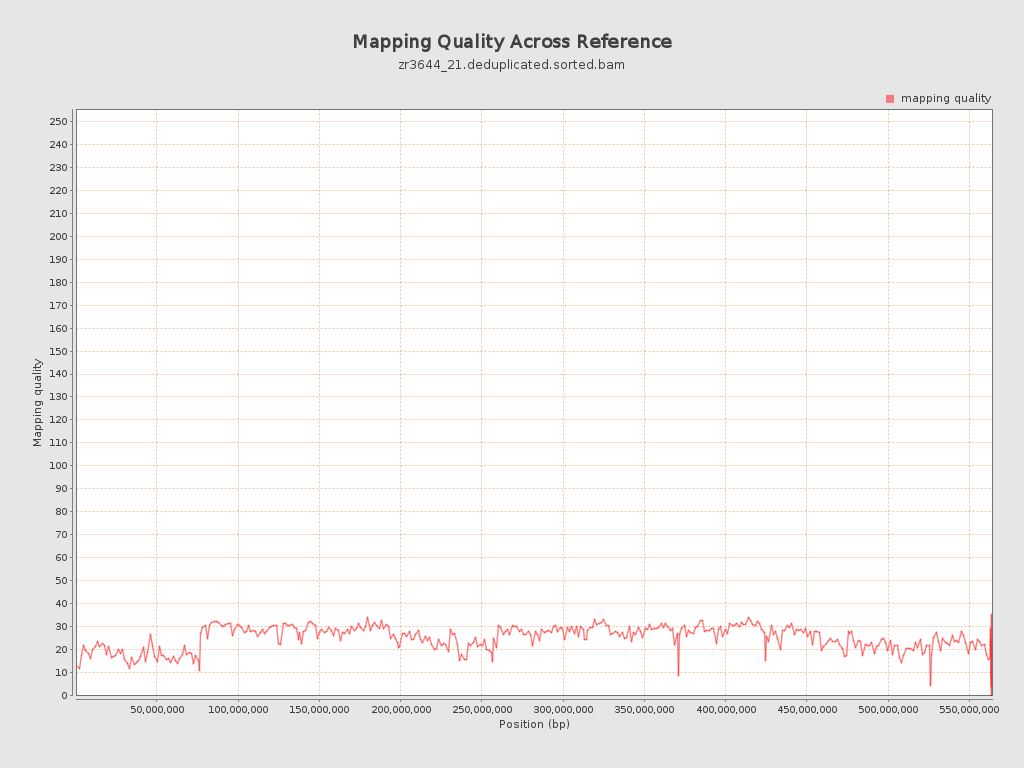
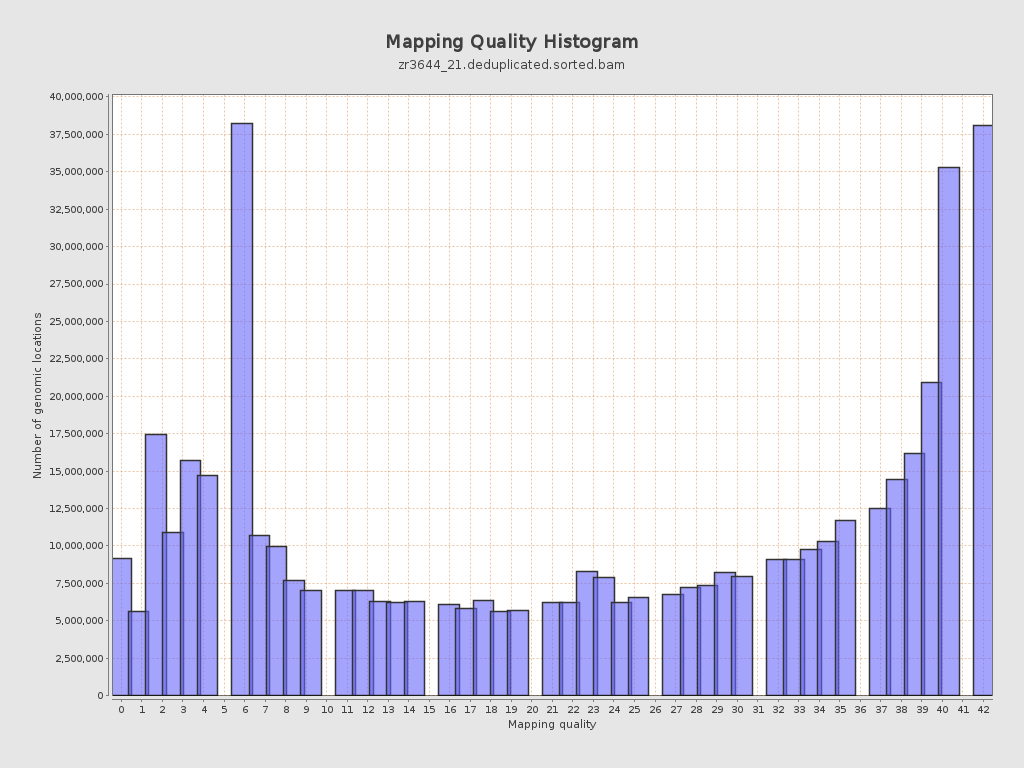
Mapping Quality
| Mean Mapping Quality | 24.63 |
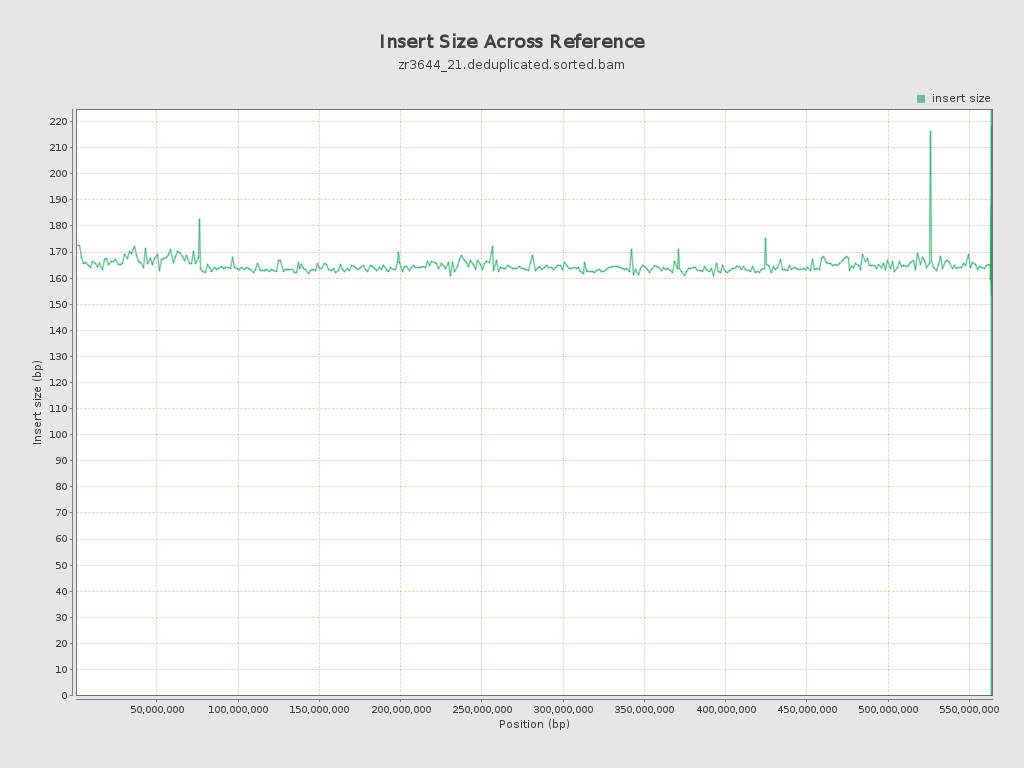
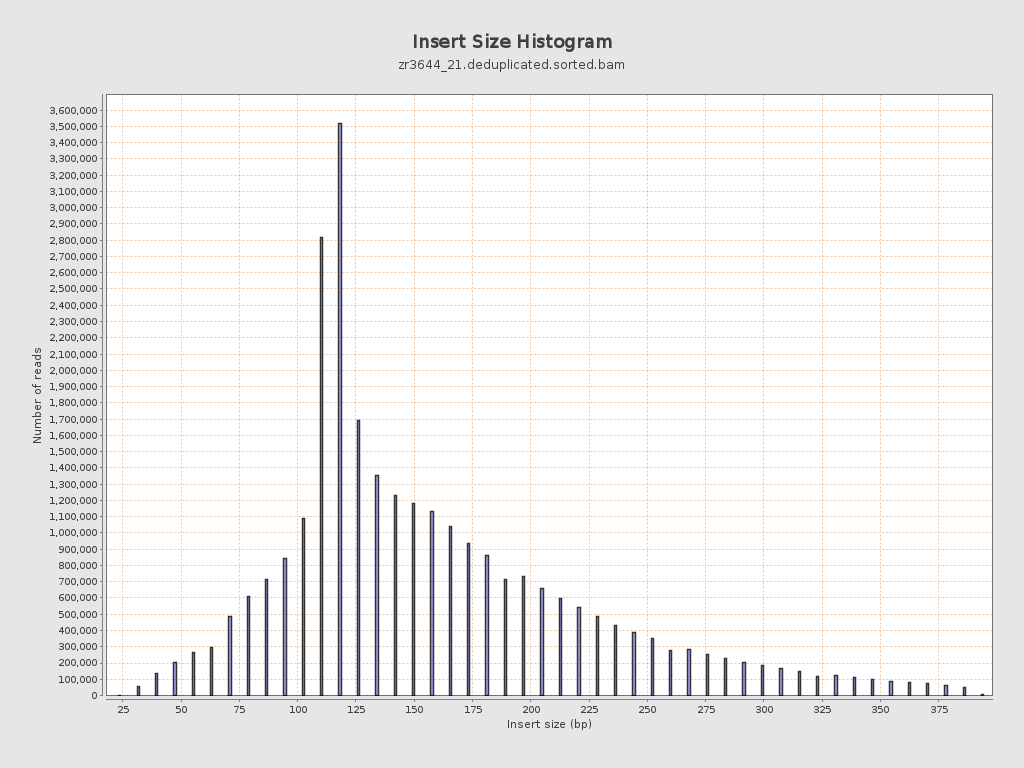
Insert size
| Mean | 164.42 |
| Standard Deviation | 73.36 |
| P25/Median/P75 | 118 / 142 / 197 |
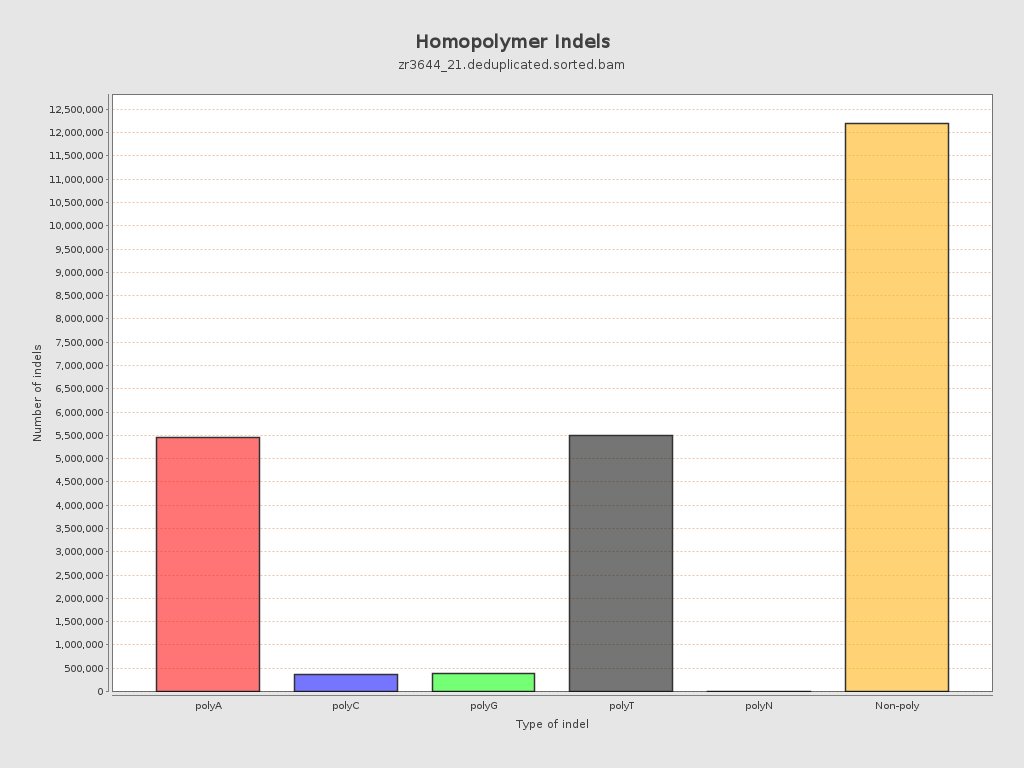
Mismatches and indels
| General error rate | 19.46% |
| Mismatches | 1,132,041,251 |
| Insertions | 12,640,888 |
| Mapped reads with at least one insertion | 16.89% |
| Deletions | 11,279,032 |
| Mapped reads with at least one deletion | 16.47% |
| Homopolymer indels | 48.99% |
Chromosome stats
| Name | Length | Mapped bases | Mean coverage | Standard deviation |
| NC_088853.1 | 76070991 | 634716668 | 8.3437 | 16.7696 |
| NC_088854.1 | 61469542 | 733177830 | 11.9275 | 10.9236 |
| NC_088855.1 | 61039741 | 732100253 | 11.9938 | 10.5916 |
| NC_088856.1 | 57946171 | 555838055 | 9.5923 | 11.4293 |
| NC_088857.1 | 57274926 | 665219809 | 11.6145 | 10.6534 |
| NC_088858.1 | 56905015 | 685301604 | 12.0429 | 10.4477 |
| NC_088859.1 | 53672946 | 665778069 | 12.4044 | 10.6356 |
| NC_088860.1 | 51133819 | 545895218 | 10.6758 | 11.3794 |
| NC_088861.1 | 50364239 | 411732189 | 8.1751 | 10.7869 |
| NC_088862.1 | 37310742 | 357783232 | 9.5893 | 11.4864 |
| NW_027062568.1 | 15579 | 149080 | 9.5693 | 8.3501 |
| NW_027062569.1 | 16498 | 225817 | 13.6875 | 16.5219 |
| NW_027062570.1 | 4000 | 229099 | 57.2747 | 48.3398 |
| NW_027062571.1 | 36893 | 5724 | 0.1552 | 0.903 |
| NW_027062572.1 | 51000 | 37164 | 0.7287 | 1.5854 |
| NW_027062573.1 | 2000 | 112479 | 56.2395 | 53.9848 |
| NW_027062574.1 | 37061 | 4272 | 0.1153 | 0.5361 |
| NW_027062575.1 | 49428 | 411265 | 8.3205 | 14.9628 |
| NW_027062576.1 | 49232 | 226760 | 4.6059 | 10.8697 |
| NW_027062577.1 | 17087 | 158185 | 9.2576 | 6.7323 |
| NW_027062578.1 | 34507 | 535453 | 15.5172 | 8.5959 |
| NW_027062579.1 | 64000 | 668251 | 10.4414 | 9.8134 |
| NW_027062580.1 | 24229 | 286492 | 11.8243 | 11.4682 |
| NW_027062581.1 | 5000 | 36891 | 7.3782 | 8.6391 |
| NW_027062582.1 | 18808 | 201776 | 10.7282 | 12.0925 |
| NW_027062583.1 | 1000 | 0 | 0 | 0 |
| NW_027062584.1 | 74000 | 13134 | 0.1775 | 0.9987 |
| NW_027062585.1 | 39334 | 315606 | 8.0237 | 7.247 |
| NW_027062586.1 | 258015 | 856256 | 3.3186 | 6.051 |