Input data and parameters
QualiMap command line
| qualimap bamqc -bam zr3644_20.deduplicated.sorted.bam -nw 400 -hm 3 |
Alignment
| Command line: | "bismark -1 zr3644_20_R1_val_1_val_1_val_1.fq.gz -2 zr3644_20_R2_val_2_val_2_val_2.fq.gz --genome BismarkIndex --bam --score_min L,0,-0.8 --non_directional --prefix zr3644_20 --multicore 3" |
| Draw chromosome limits: | no |
| Analyze overlapping paired-end reads: | yes |
| Program: | Bismark (v0.24.2) |
| Analysis date: | Wed Apr 16 06:11:24 GMT 2025 |
| Size of a homopolymer: | 3 |
| Skip duplicate alignments: | no |
| Number of windows: | 400 |
| BAM file: | zr3644_20.deduplicated.sorted.bam |
Summary
Globals
| Reference size | 563,985,803 |
| Number of reads | 59,407,036 |
| Mapped reads | 59,407,036 / 100% |
| Unmapped reads | 0 / 0% |
| Mapped paired reads | 59,407,036 / 100% |
| Mapped reads, first in pair | 29,703,518 / 50% |
| Mapped reads, second in pair | 29,703,518 / 50% |
| Mapped reads, both in pair | 59,407,036 / 100% |
| Mapped reads, singletons | 0 / 0% |
| Secondary alignments | 0 |
| Read min/max/mean length | 20 / 115 / 106.08 |
| Overlapping read pairs | 24,563,541 / 82.7% |
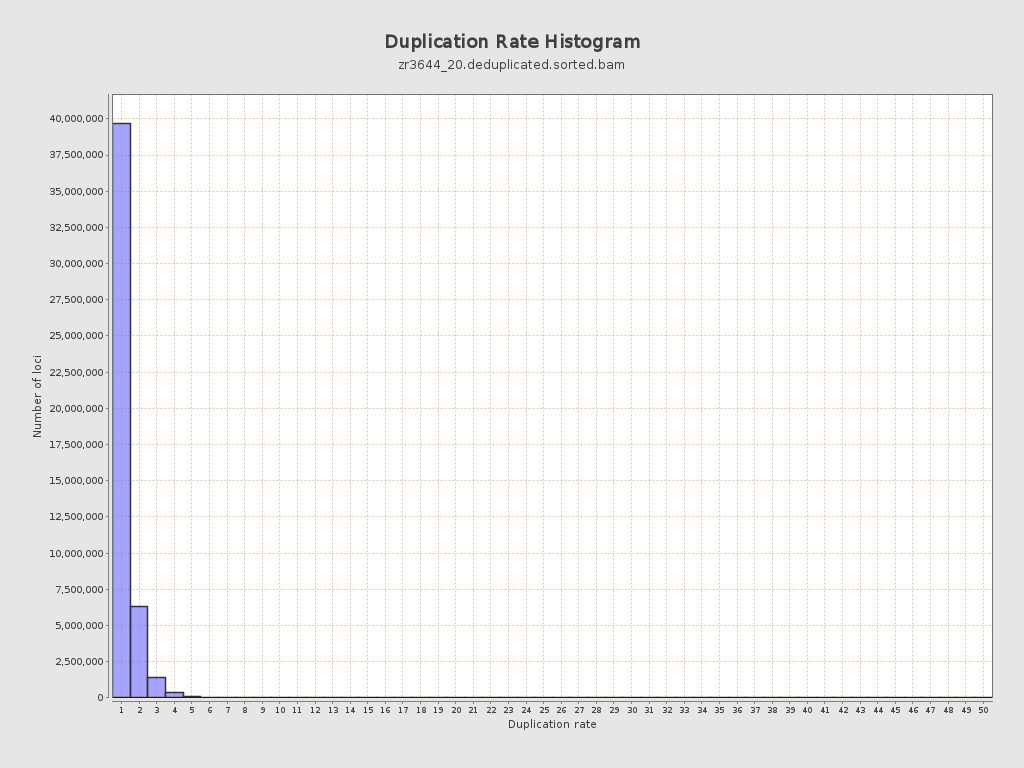
| Duplicated reads (estimated) | 11,426,159 / 19.23% |
| Duplication rate | 17.32% |
| Clipped reads | 0 / 0% |
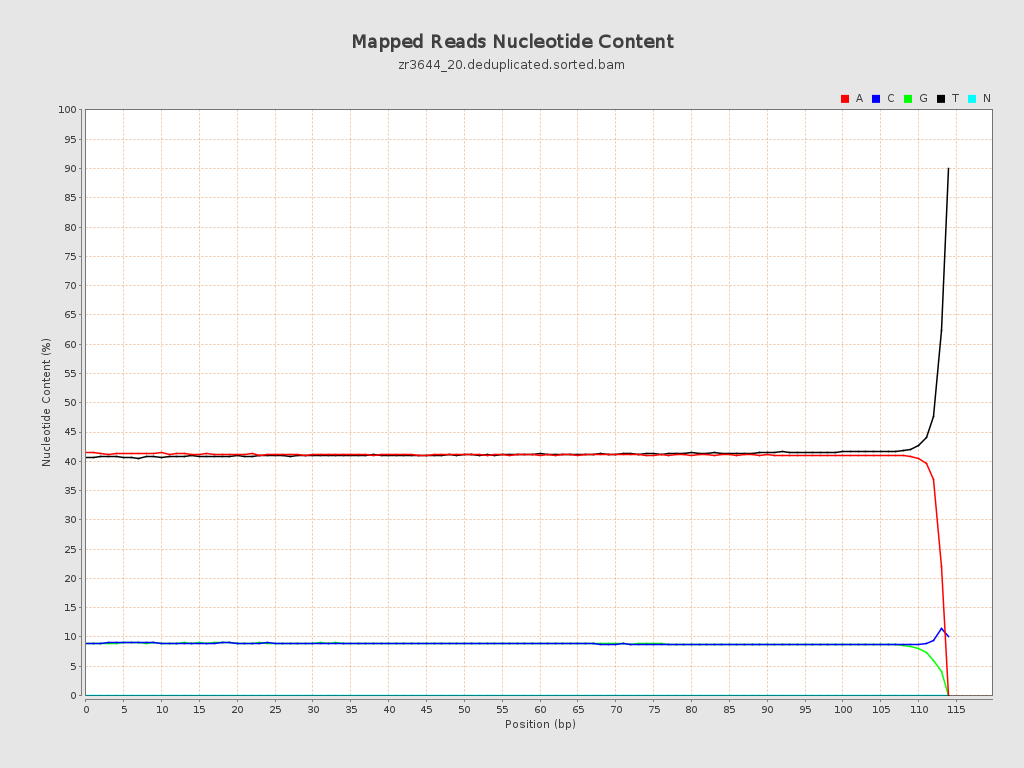
ACGT Content
| Number/percentage of A's | 2,567,118,026 / 40.97% |
| Number/percentage of C's | 555,983,504 / 8.87% |
| Number/percentage of T's | 2,591,313,626 / 41.35% |
| Number/percentage of G's | 551,788,788 / 8.81% |
| Number/percentage of N's | 34,498 / 0% |
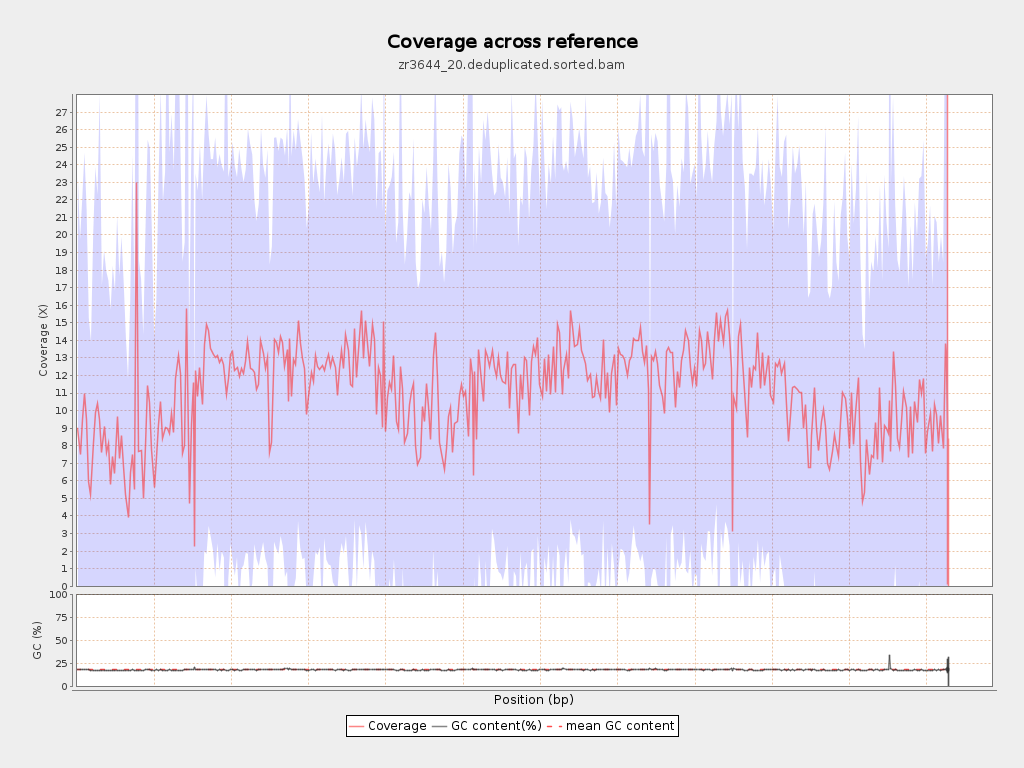
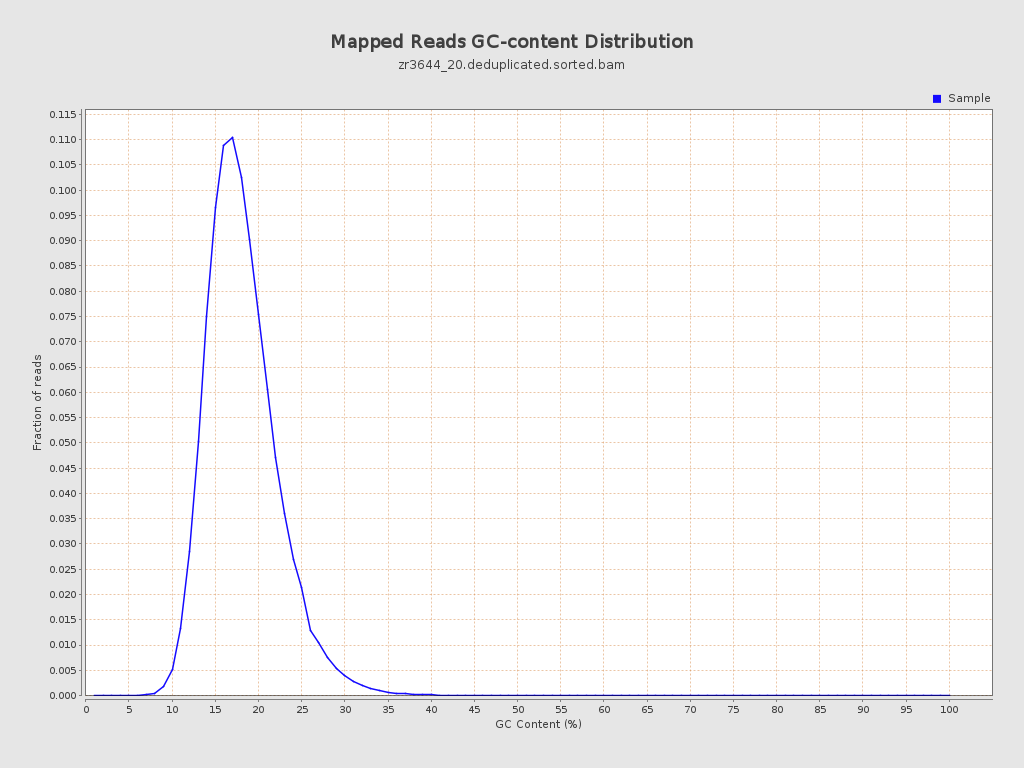
| GC Percentage | 17.68% |
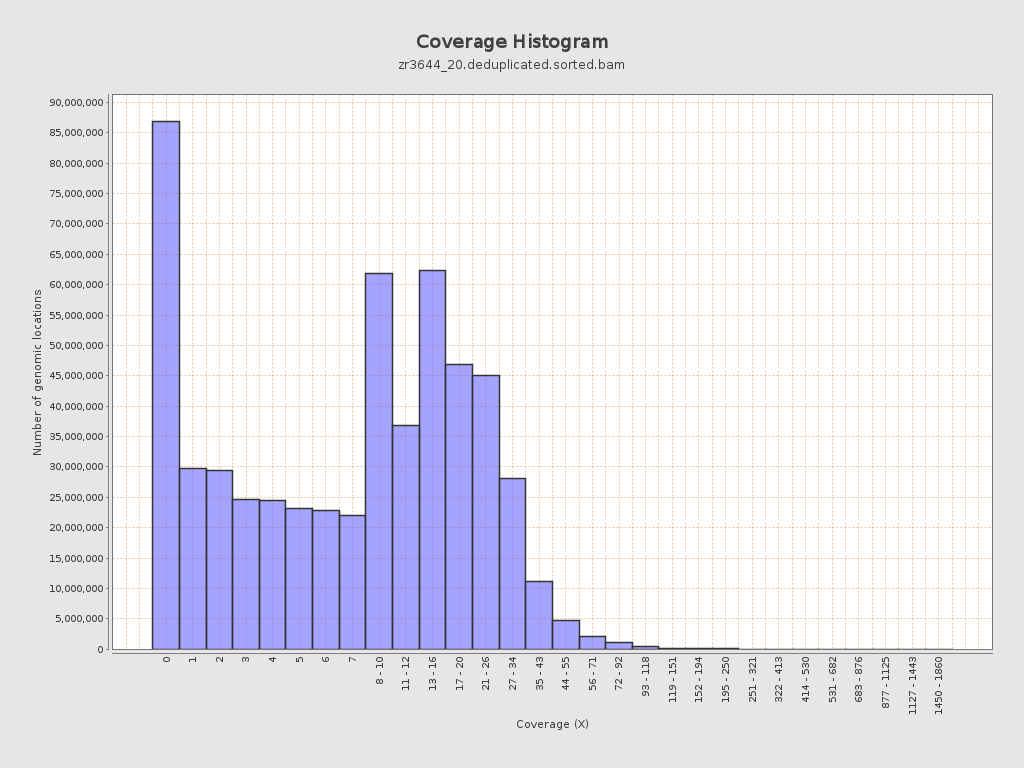
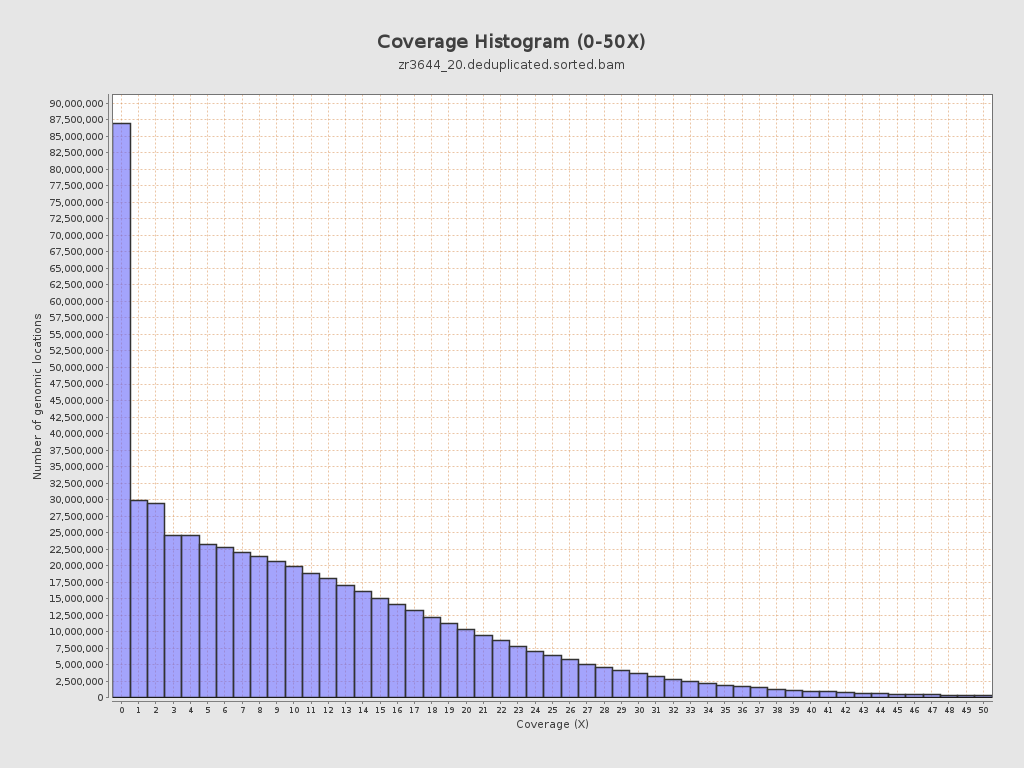
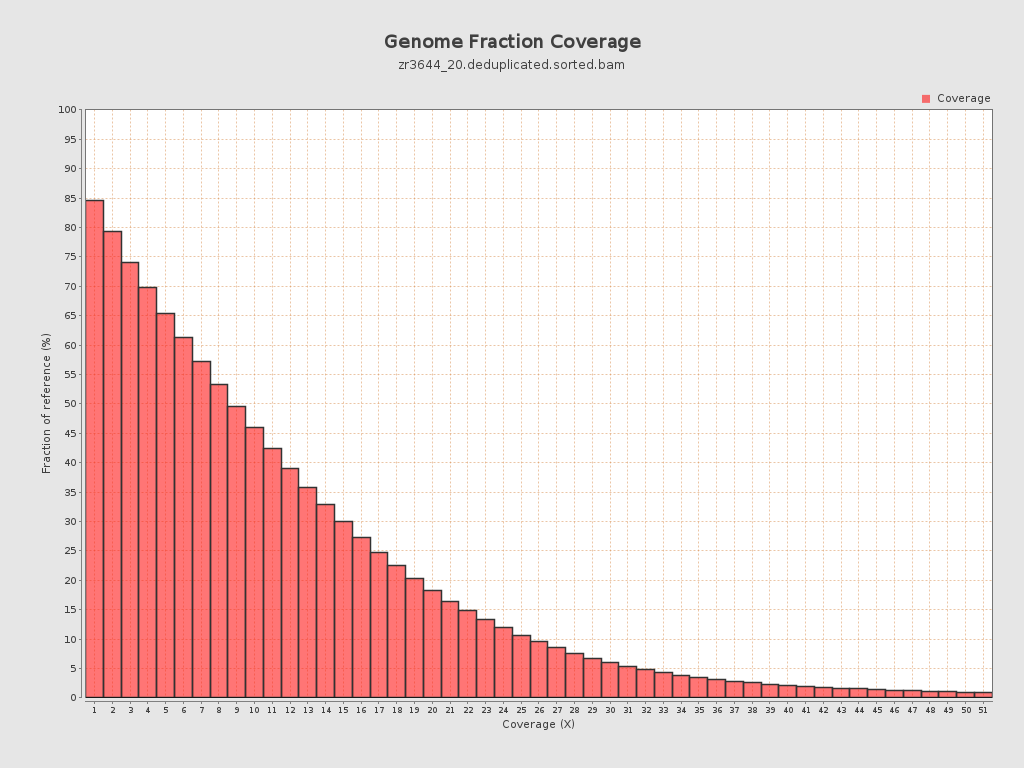
Coverage
| Mean | 11.1592 |
| Standard Deviation | 12.2163 |
| Mean (paired-end reads overlap ignored) | 8.08 |
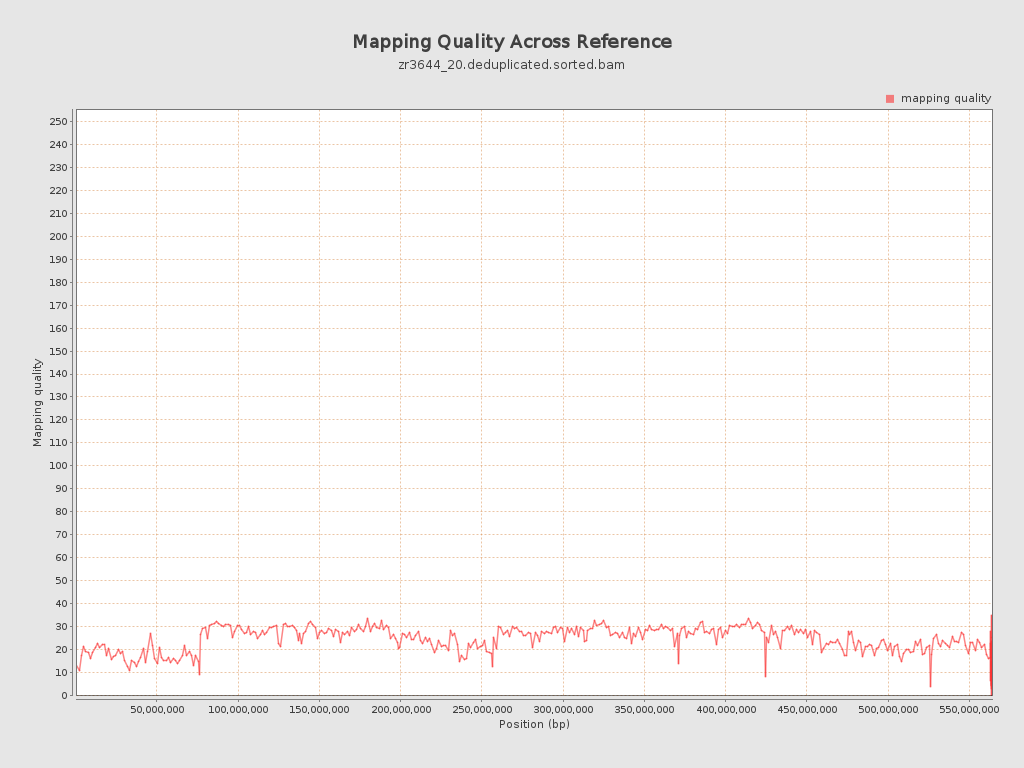
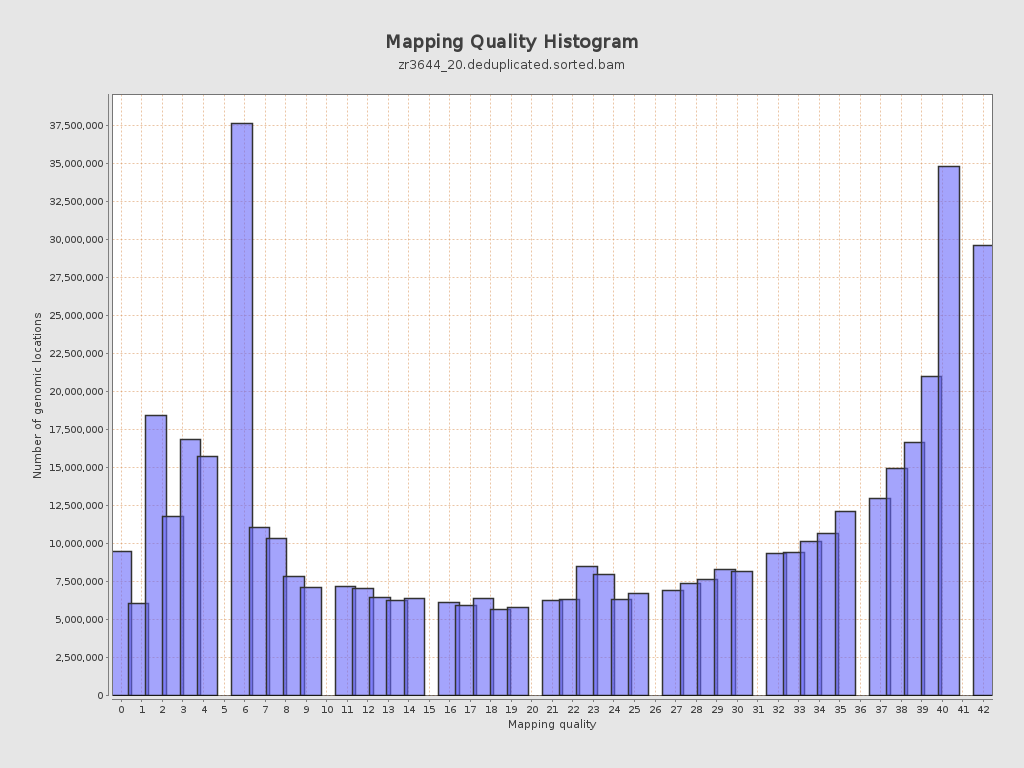
Mapping Quality
| Mean Mapping Quality | 24.14 |
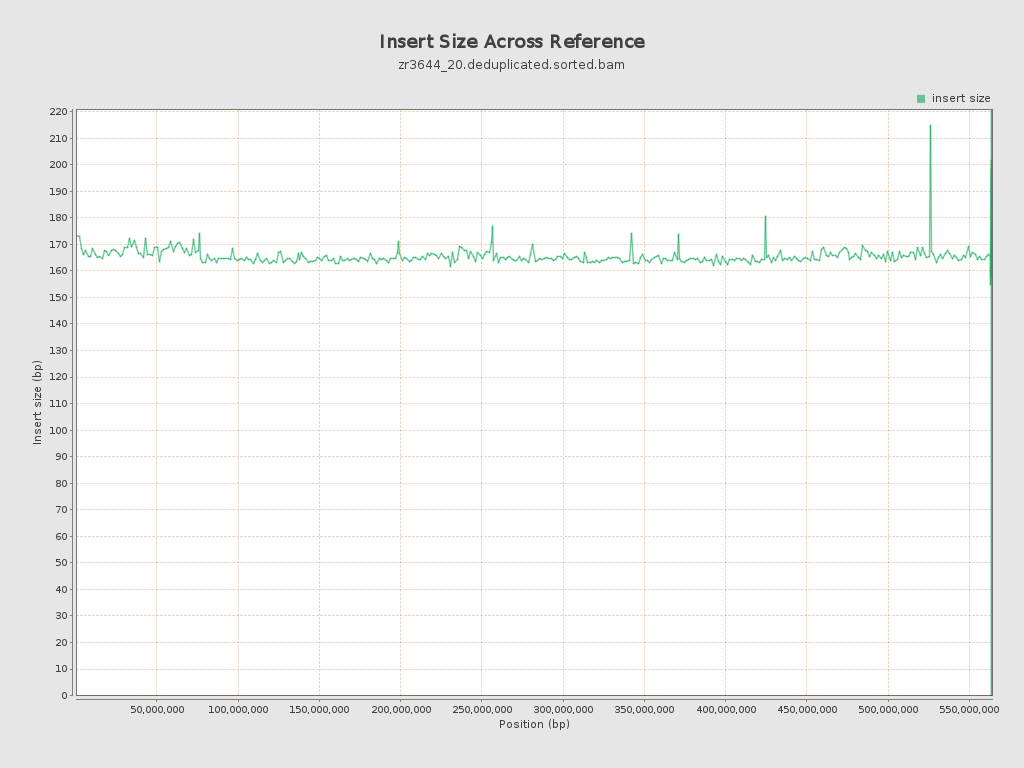
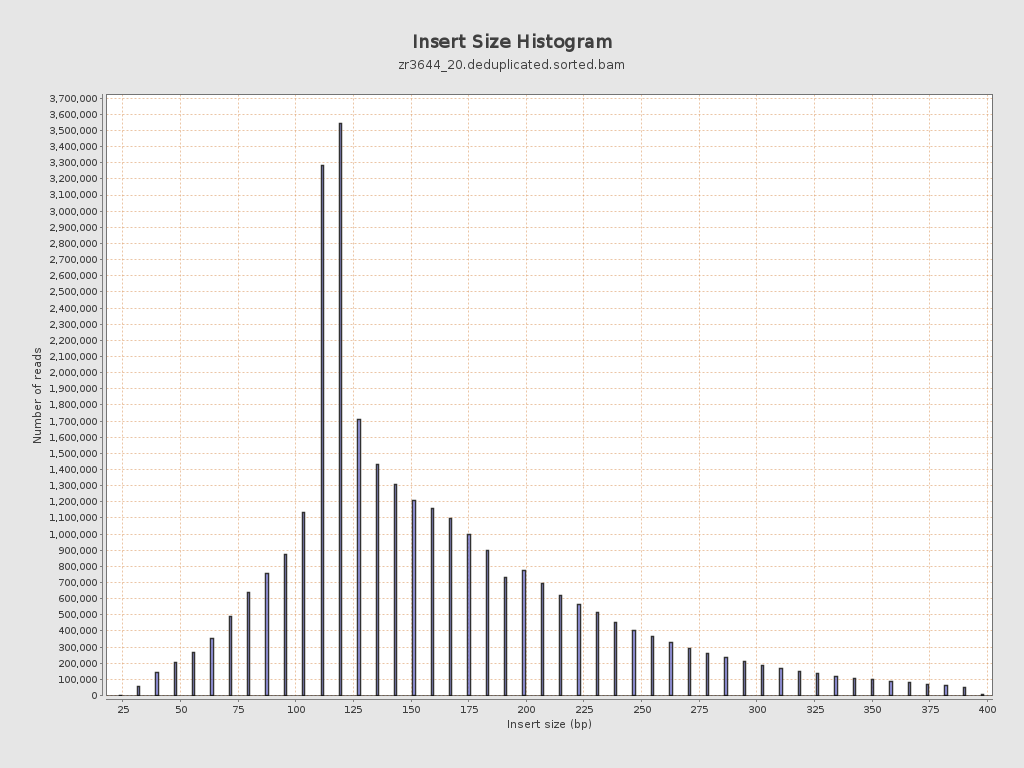
Insert size
| Mean | 165.09 |
| Standard Deviation | 72.88 |
| P25/Median/P75 | 118 / 143 / 199 |
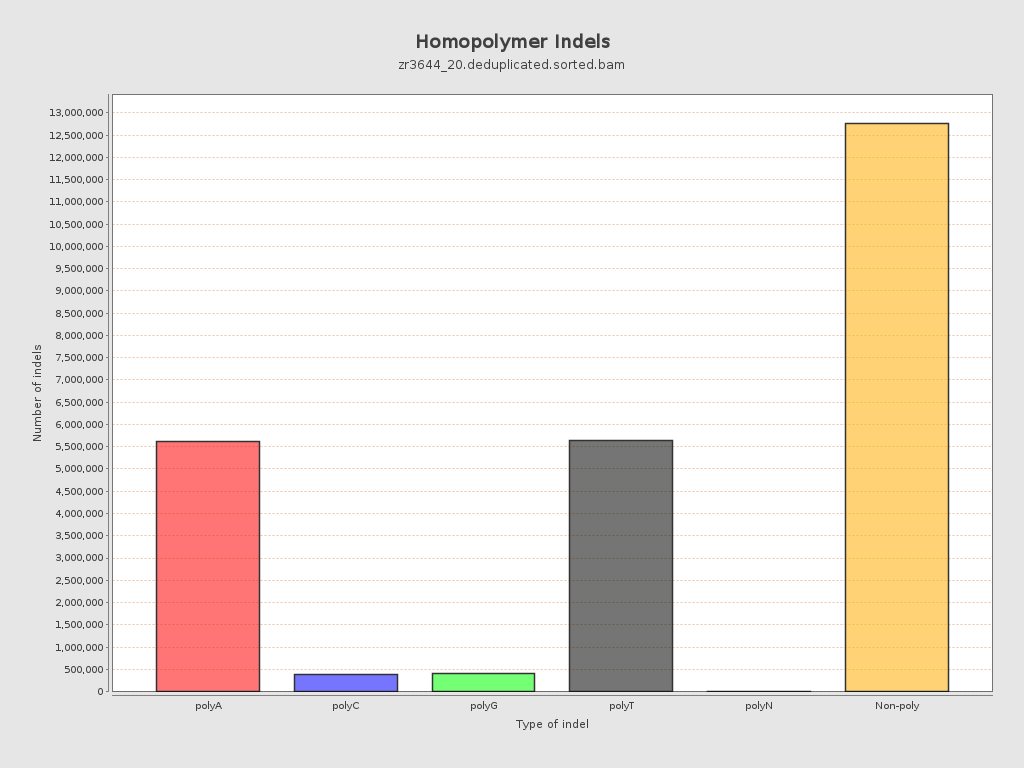
Mismatches and indels
| General error rate | 19.61% |
| Mismatches | 1,198,511,871 |
| Insertions | 13,178,274 |
| Mapped reads with at least one insertion | 16.81% |
| Deletions | 11,637,984 |
| Mapped reads with at least one deletion | 16.21% |
| Homopolymer indels | 48.56% |
Chromosome stats
| Name | Length | Mapped bases | Mean coverage | Standard deviation |
| NC_088853.1 | 76070991 | 661986753 | 8.7022 | 14.0693 |
| NC_088854.1 | 61469542 | 770808298 | 12.5397 | 11.4904 |
| NC_088855.1 | 61039741 | 775016524 | 12.6969 | 11.4226 |
| NC_088856.1 | 57946171 | 584490182 | 10.0868 | 12.5371 |
| NC_088857.1 | 57274926 | 697741828 | 12.1823 | 11.6048 |
| NC_088858.1 | 56905015 | 723141267 | 12.7079 | 11.3147 |
| NC_088859.1 | 53672946 | 702087266 | 13.0808 | 12.2315 |
| NC_088860.1 | 51133819 | 578587896 | 11.3152 | 12.0056 |
| NC_088861.1 | 50364239 | 431711322 | 8.5718 | 11.3831 |
| NC_088862.1 | 37310742 | 364263767 | 9.763 | 11.9085 |
| NW_027062568.1 | 15579 | 132503 | 8.5052 | 7.9769 |
| NW_027062569.1 | 16498 | 121465 | 7.3624 | 15.3704 |
| NW_027062570.1 | 4000 | 221477 | 55.3693 | 50.228 |
| NW_027062571.1 | 36893 | 6432 | 0.1743 | 0.7015 |
| NW_027062572.1 | 51000 | 49978 | 0.98 | 3.308 |
| NW_027062573.1 | 2000 | 116401 | 58.2005 | 57.1956 |
| NW_027062574.1 | 37061 | 4485 | 0.121 | 0.8208 |
| NW_027062575.1 | 49428 | 394208 | 7.9754 | 14.7163 |
| NW_027062576.1 | 49232 | 197633 | 4.0143 | 7.6217 |
| NW_027062577.1 | 17087 | 155669 | 9.1104 | 6.4622 |
| NW_027062578.1 | 34507 | 588015 | 17.0405 | 10.1925 |
| NW_027062579.1 | 64000 | 450035 | 7.0318 | 9.6943 |
| NW_027062580.1 | 24229 | 268414 | 11.0782 | 10.5795 |
| NW_027062581.1 | 5000 | 21081 | 4.2162 | 8.5378 |
| NW_027062582.1 | 18808 | 42566 | 2.2632 | 4.6349 |
| NW_027062583.1 | 1000 | 0 | 0 | 0 |
| NW_027062584.1 | 74000 | 16430 | 0.222 | 1.2235 |
| NW_027062585.1 | 39334 | 331416 | 8.4257 | 7.9634 |
| NW_027062586.1 | 258015 | 678840 | 2.631 | 6.0499 |