Input data and parameters
QualiMap command line
| qualimap bamqc -bam zr3644_2.deduplicated.sorted.bam -nw 400 -hm 3 |
Alignment
| Command line: | "bismark -1 zr3644_2_R1_val_1_val_1_val_1.fq.gz -2 zr3644_2_R2_val_2_val_2_val_2.fq.gz --genome BismarkIndex --bam --score_min L,0,-0.8 --non_directional --prefix zr3644_2 --multicore 3" |
| Draw chromosome limits: | no |
| Analyze overlapping paired-end reads: | yes |
| Program: | Bismark (v0.24.2) |
| Analysis date: | Wed Apr 16 06:18:19 GMT 2025 |
| Size of a homopolymer: | 3 |
| Skip duplicate alignments: | no |
| Number of windows: | 400 |
| BAM file: | zr3644_2.deduplicated.sorted.bam |
Summary
Globals
| Reference size | 563,985,803 |
| Number of reads | 60,713,774 |
| Mapped reads | 60,713,774 / 100% |
| Unmapped reads | 0 / 0% |
| Mapped paired reads | 60,713,774 / 100% |
| Mapped reads, first in pair | 30,356,887 / 50% |
| Mapped reads, second in pair | 30,356,887 / 50% |
| Mapped reads, both in pair | 60,713,774 / 100% |
| Mapped reads, singletons | 0 / 0% |
| Secondary alignments | 0 |
| Read min/max/mean length | 20 / 115 / 106.7 |
| Overlapping read pairs | 24,850,983 / 81.86% |
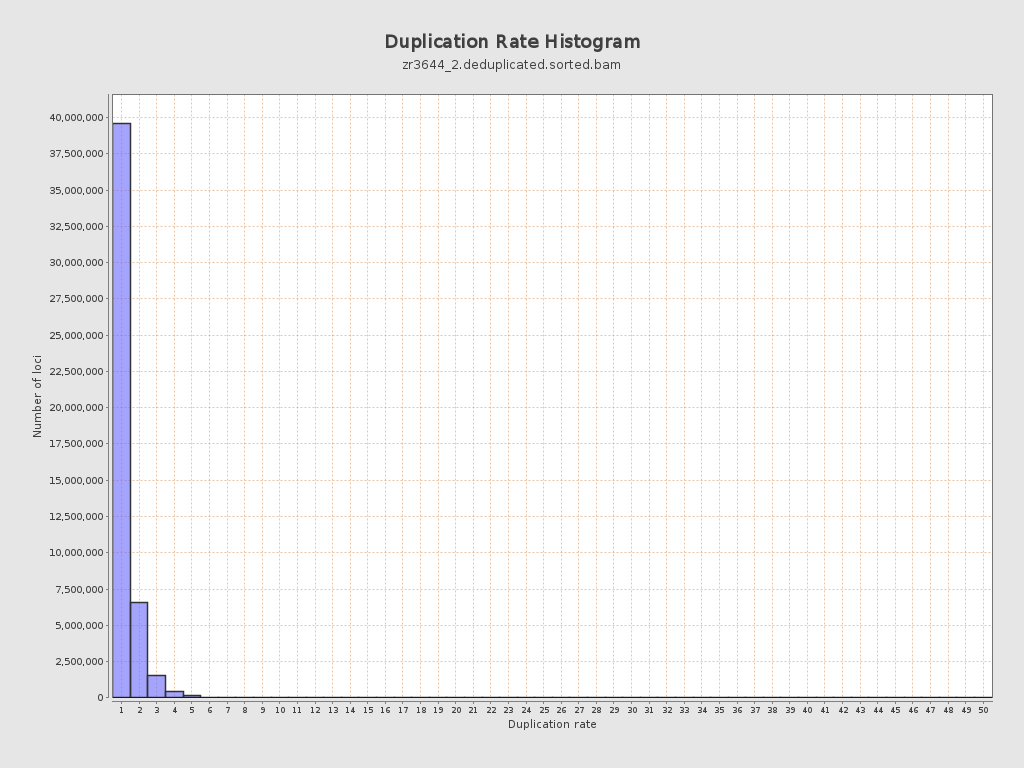
| Duplicated reads (estimated) | 12,314,805 / 20.28% |
| Duplication rate | 18.22% |
| Clipped reads | 0 / 0% |
ACGT Content
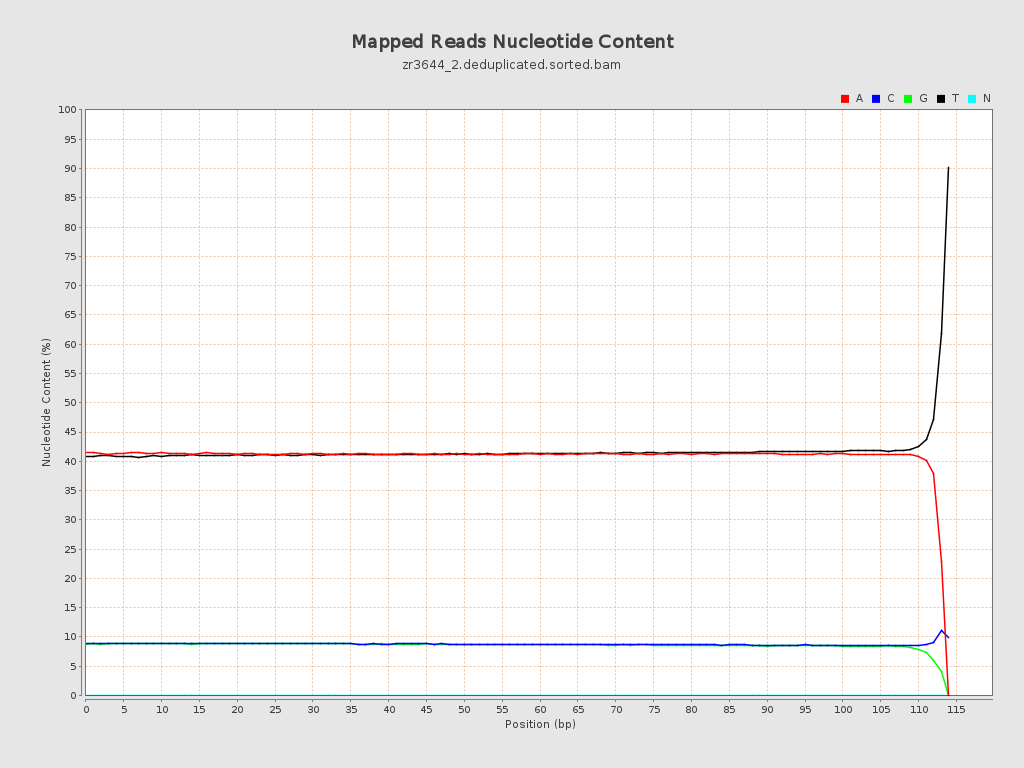
| Number/percentage of A's | 2,646,634,386 / 41.09% |
| Number/percentage of C's | 564,576,296 / 8.77% |
| Number/percentage of T's | 2,672,882,590 / 41.5% |
| Number/percentage of G's | 556,573,471 / 8.64% |
| Number/percentage of N's | 48,272 / 0% |
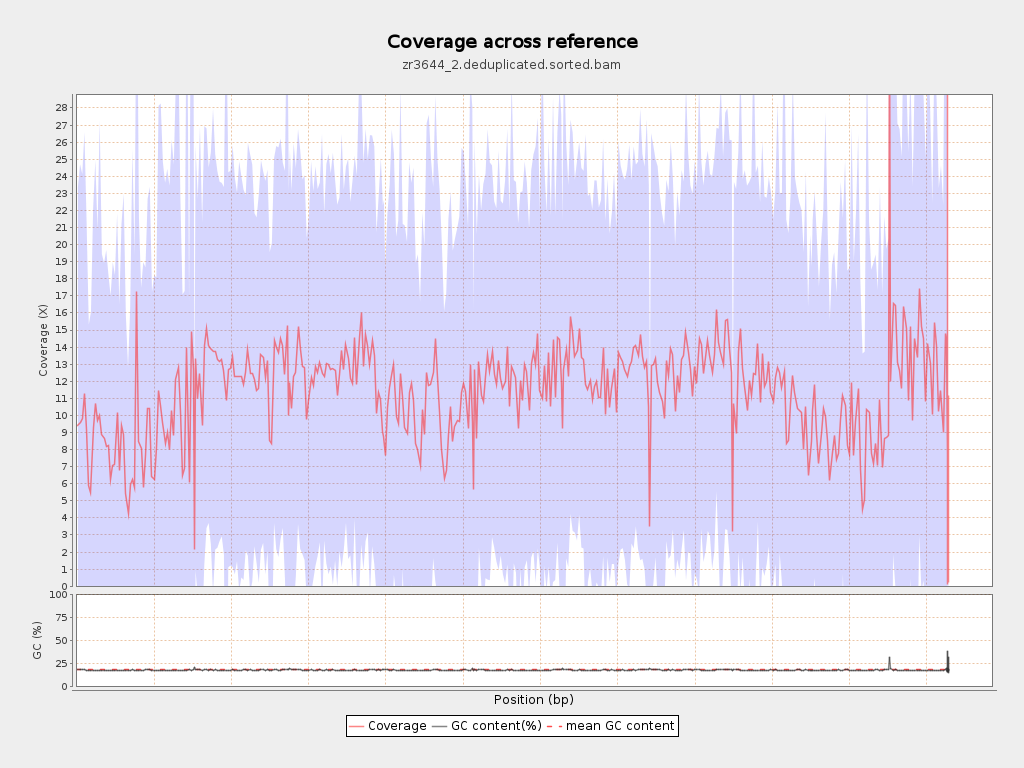
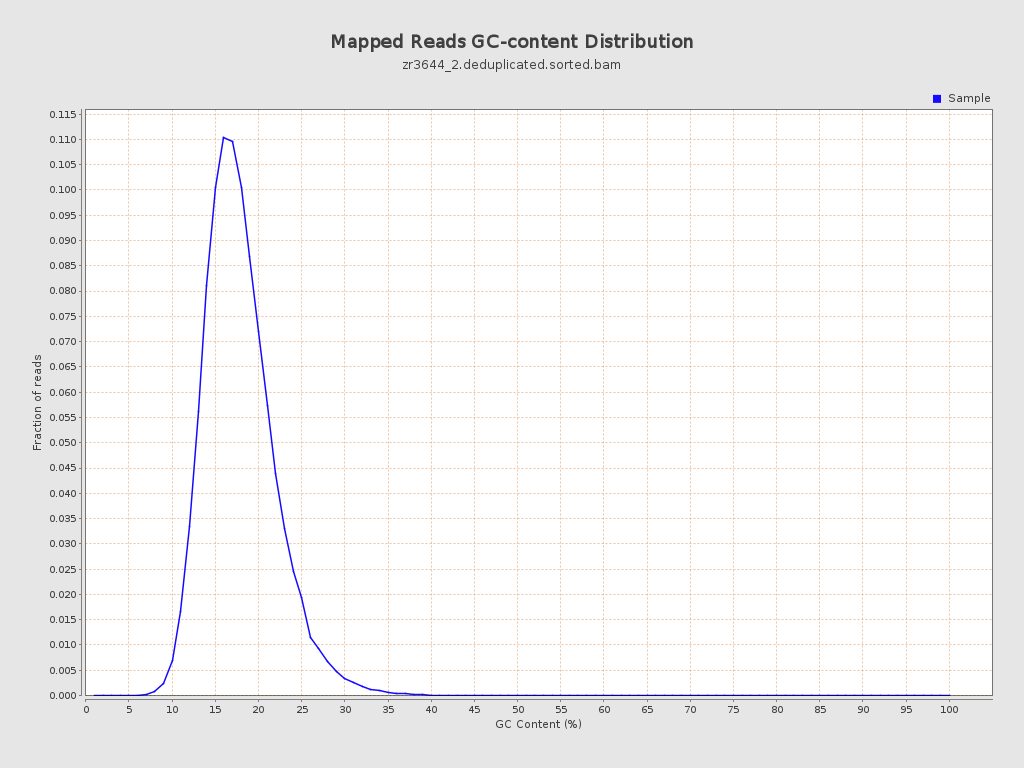
| GC Percentage | 17.41% |
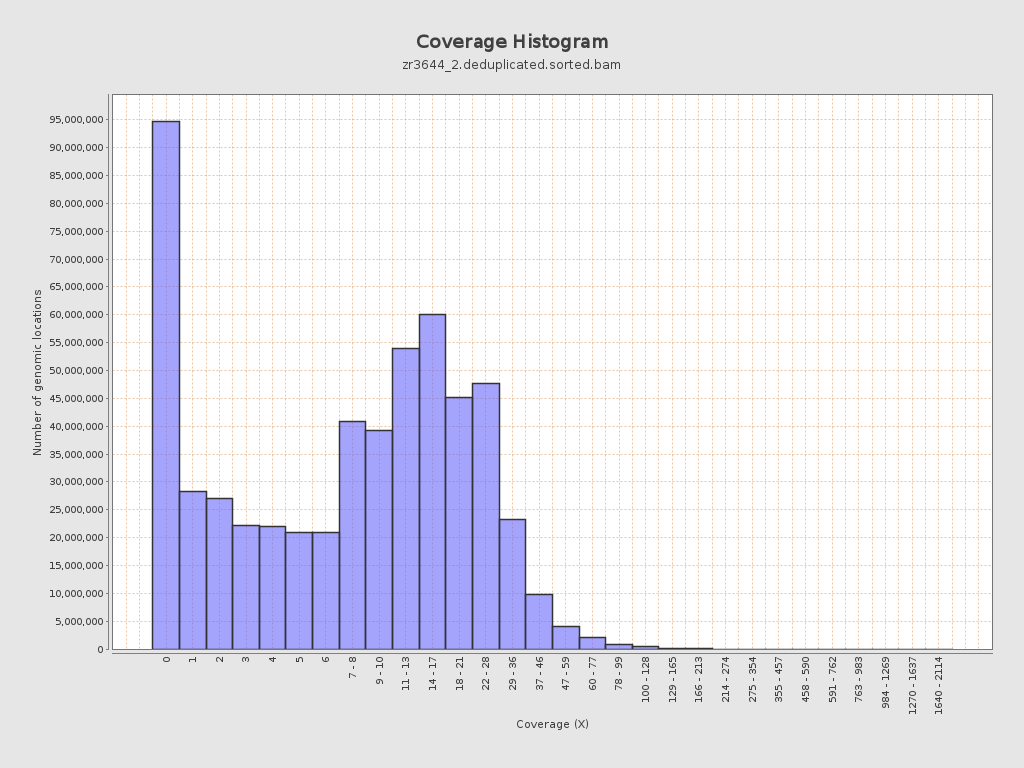
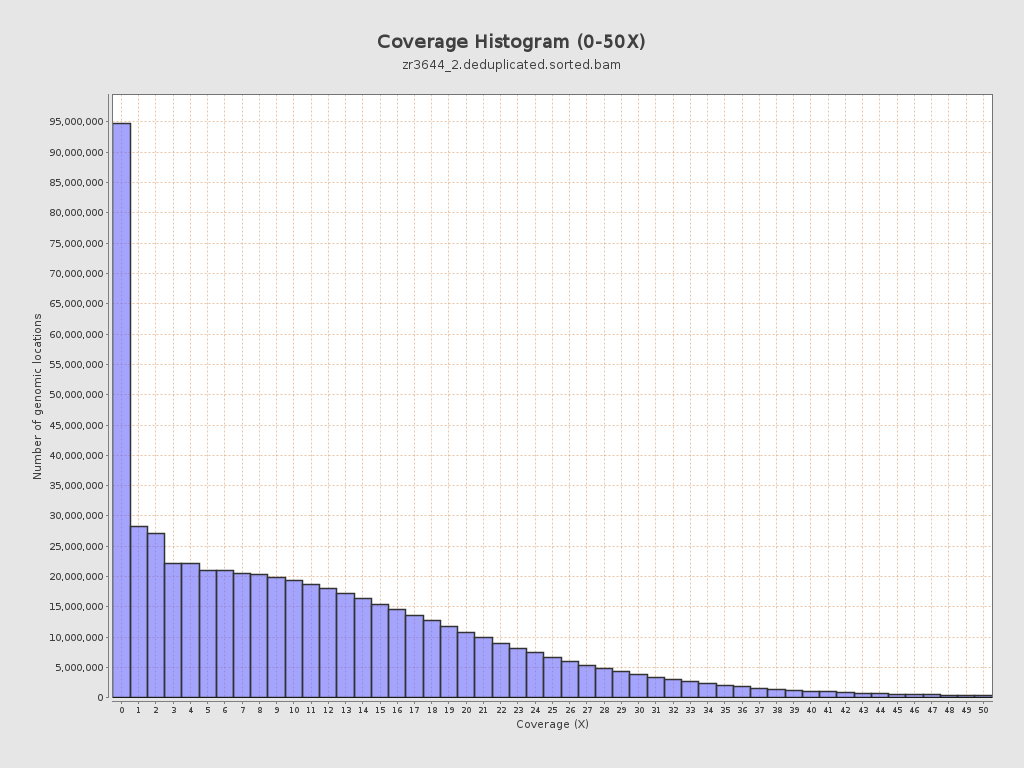
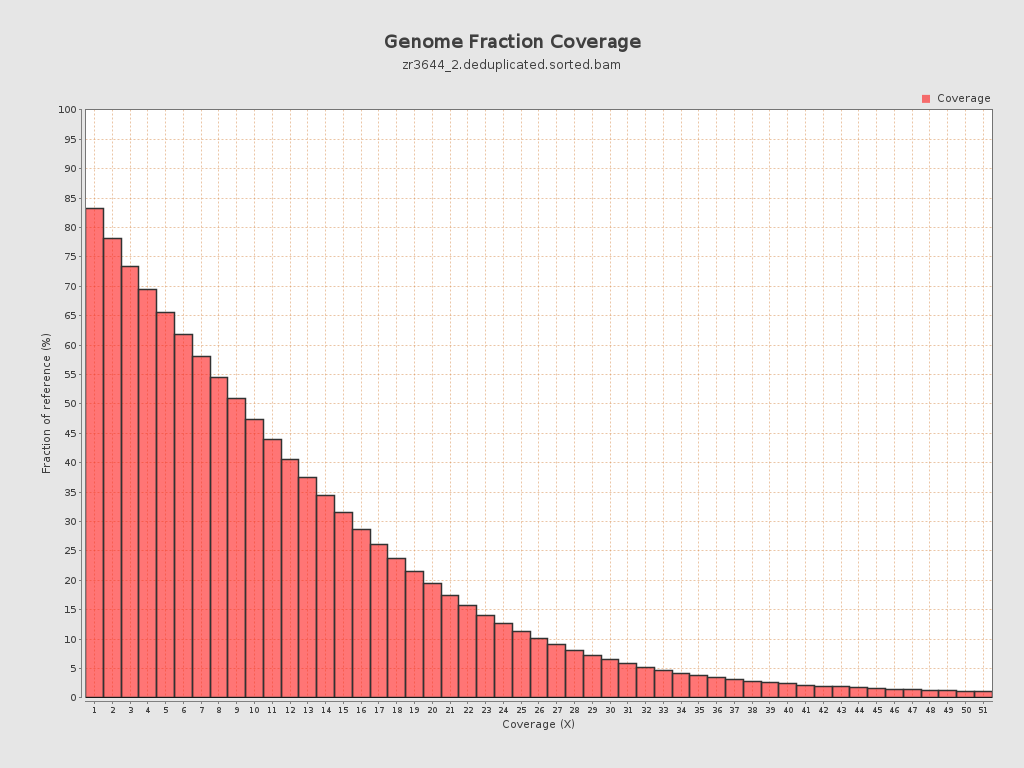
Coverage
| Mean | 11.4717 |
| Standard Deviation | 12.6955 |
| Mean (paired-end reads overlap ignored) | 8.35 |
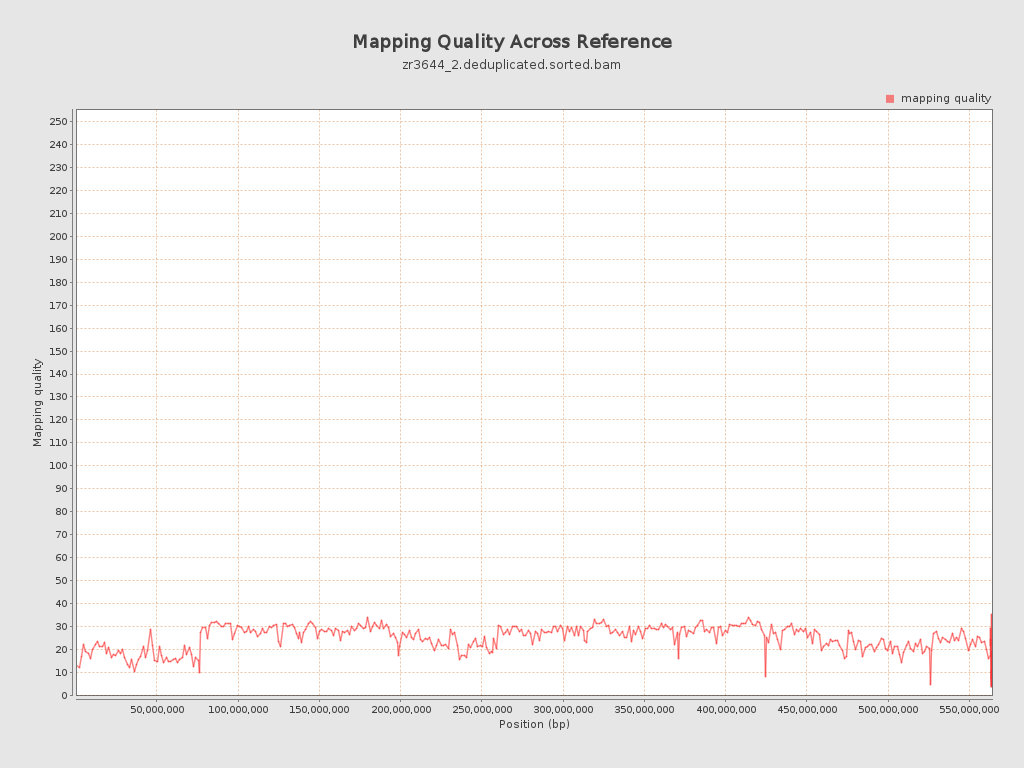
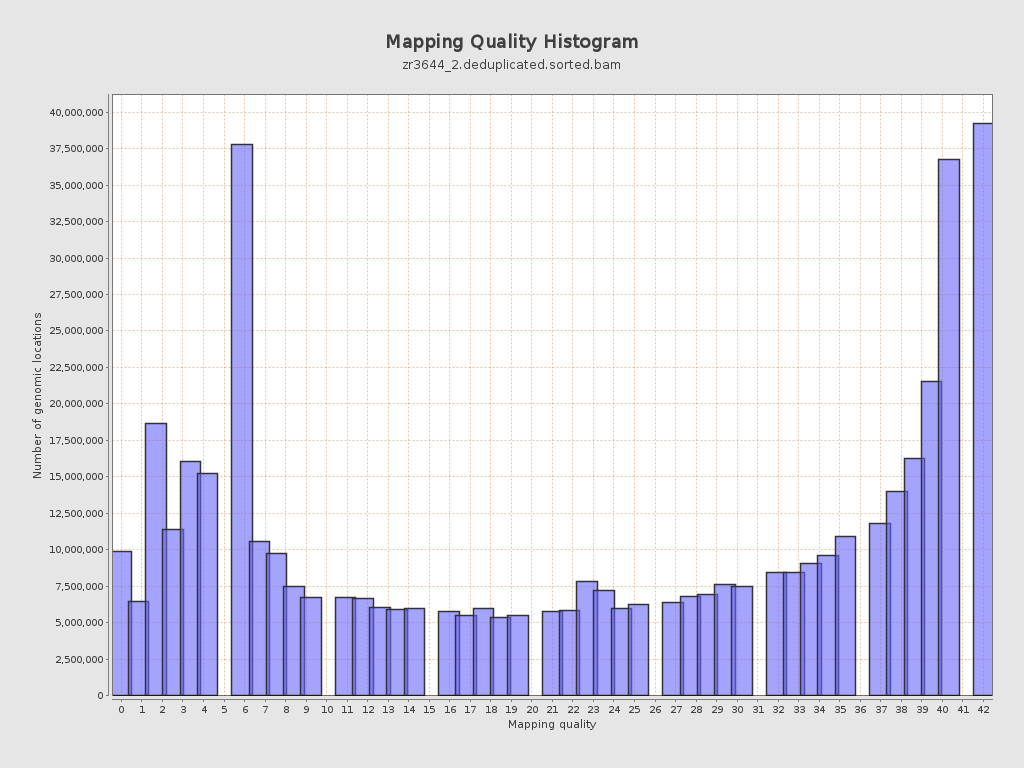
Mapping Quality
| Mean Mapping Quality | 24.63 |
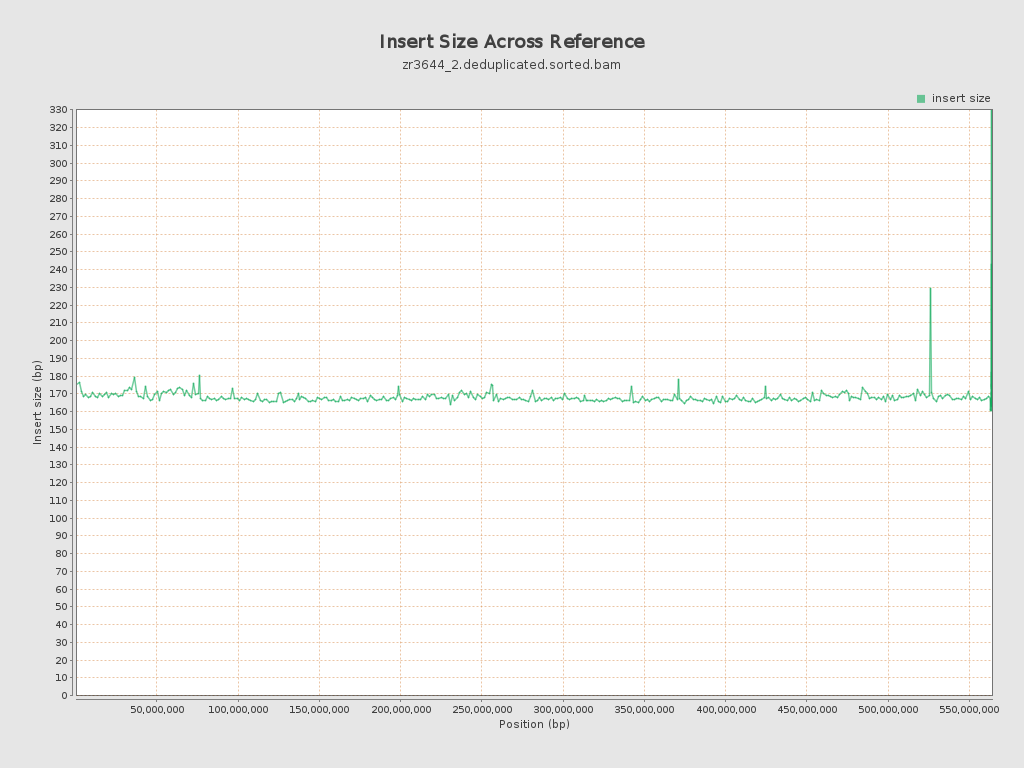
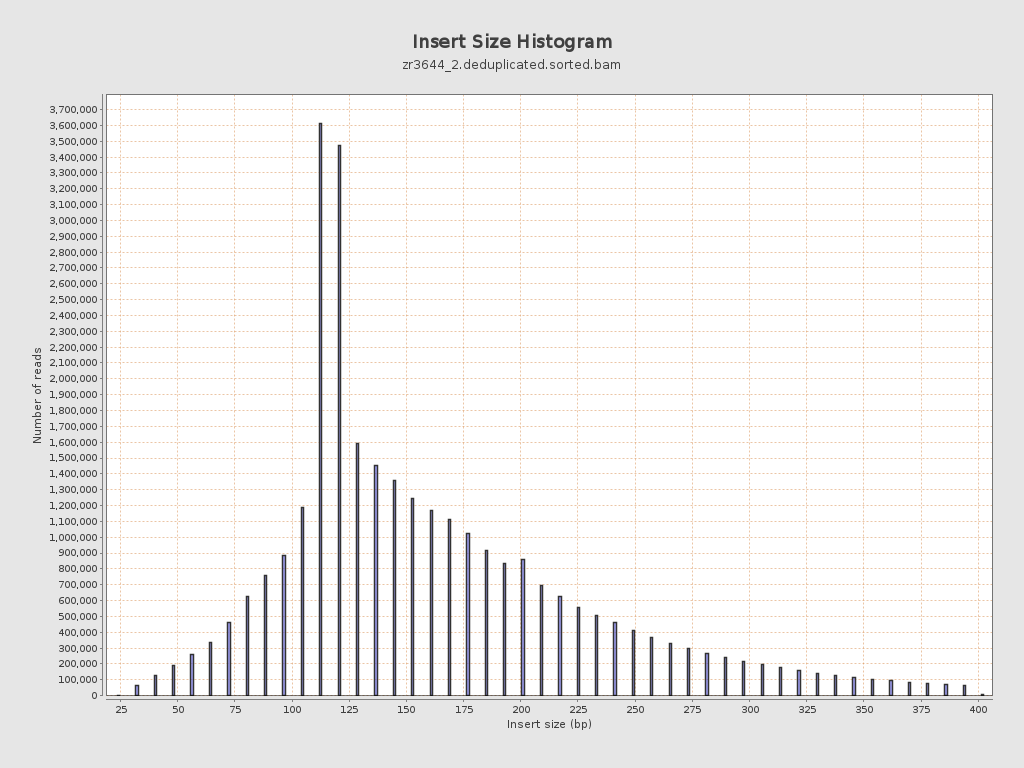
Insert size
| Mean | 167.72 |
| Standard Deviation | 74.53 |
| P25/Median/P75 | 119 / 146 / 201 |
Mismatches and indels
| General error rate | 19.46% |
| Mismatches | 1,221,495,920 |
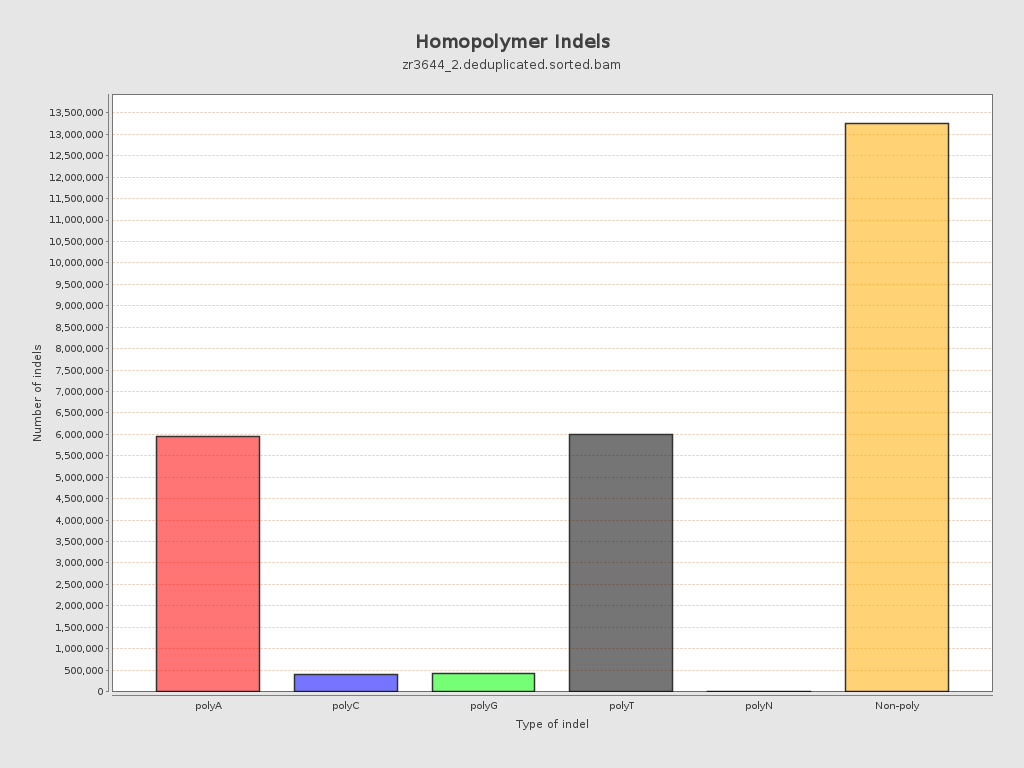
| Insertions | 13,738,289 |
| Mapped reads with at least one insertion | 17.12% |
| Deletions | 12,276,221 |
| Mapped reads with at least one deletion | 16.69% |
| Homopolymer indels | 49.05% |
Chromosome stats
| Name | Length | Mapped bases | Mean coverage | Standard deviation |
| NC_088853.1 | 76070991 | 674340280 | 8.8646 | 14.093 |
| NC_088854.1 | 61469542 | 780461795 | 12.6967 | 11.952 |
| NC_088855.1 | 61039741 | 772954190 | 12.6631 | 11.4111 |
| NC_088856.1 | 57946171 | 597315709 | 10.3081 | 12.3127 |
| NC_088857.1 | 57274926 | 702775197 | 12.2702 | 11.8594 |
| NC_088858.1 | 56905015 | 723186841 | 12.7087 | 11.405 |
| NC_088859.1 | 53672946 | 701108246 | 13.0626 | 11.3817 |
| NC_088860.1 | 51133819 | 574978068 | 11.2446 | 12.7262 |
| NC_088861.1 | 50364239 | 438051373 | 8.6977 | 11.9155 |
| NC_088862.1 | 37310742 | 500473150 | 13.4136 | 16.9683 |
| NW_027062568.1 | 15579 | 119271 | 7.6559 | 6.9724 |
| NW_027062569.1 | 16498 | 265653 | 16.1021 | 14.8723 |
| NW_027062570.1 | 4000 | 280018 | 70.0045 | 55.3401 |
| NW_027062571.1 | 36893 | 4605 | 0.1248 | 0.6035 |
| NW_027062572.1 | 51000 | 39781 | 0.78 | 2.2995 |
| NW_027062573.1 | 2000 | 143158 | 71.579 | 56.8718 |
| NW_027062574.1 | 37061 | 5278 | 0.1424 | 1.0728 |
| NW_027062575.1 | 49428 | 497052 | 10.0561 | 16.0858 |
| NW_027062576.1 | 49232 | 218767 | 4.4436 | 8.9268 |
| NW_027062577.1 | 17087 | 221674 | 12.9733 | 9.124 |
| NW_027062578.1 | 34507 | 576888 | 16.718 | 9.3935 |
| NW_027062579.1 | 64000 | 308266 | 4.8167 | 10.4573 |
| NW_027062580.1 | 24229 | 191855 | 7.9184 | 8.4723 |
| NW_027062581.1 | 5000 | 30323 | 6.0646 | 10.9843 |
| NW_027062582.1 | 18808 | 209666 | 11.1477 | 9.2072 |
| NW_027062583.1 | 1000 | 222 | 0.222 | 0.4156 |
| NW_027062584.1 | 74000 | 17774 | 0.2402 | 1.4136 |
| NW_027062585.1 | 39334 | 201715 | 5.1283 | 6.5934 |
| NW_027062586.1 | 258015 | 876057 | 3.3954 | 6.7833 |