Input data and parameters
QualiMap command line
| qualimap bamqc -bam zr3644_19.deduplicated.sorted.bam -nw 400 -hm 3 |
Alignment
| Command line: | "bismark -1 zr3644_19_R1_val_1_val_1_val_1.fq.gz -2 zr3644_19_R2_val_2_val_2_val_2.fq.gz --genome BismarkIndex --bam --score_min L,0,-0.8 --non_directional --prefix zr3644_19 --multicore 3" |
| Draw chromosome limits: | no |
| Analyze overlapping paired-end reads: | yes |
| Program: | Bismark (v0.24.2) |
| Analysis date: | Wed Apr 16 07:32:22 GMT 2025 |
| Size of a homopolymer: | 3 |
| Skip duplicate alignments: | no |
| Number of windows: | 400 |
| BAM file: | zr3644_19.deduplicated.sorted.bam |
Summary
Globals
| Reference size | 563,985,803 |
| Number of reads | 55,358,426 |
| Mapped reads | 55,358,426 / 100% |
| Unmapped reads | 0 / 0% |
| Mapped paired reads | 55,358,426 / 100% |
| Mapped reads, first in pair | 27,679,213 / 50% |
| Mapped reads, second in pair | 27,679,213 / 50% |
| Mapped reads, both in pair | 55,358,426 / 100% |
| Mapped reads, singletons | 0 / 0% |
| Secondary alignments | 0 |
| Read min/max/mean length | 20 / 115 / 105.34 |
| Overlapping read pairs | 23,200,551 / 83.82% |
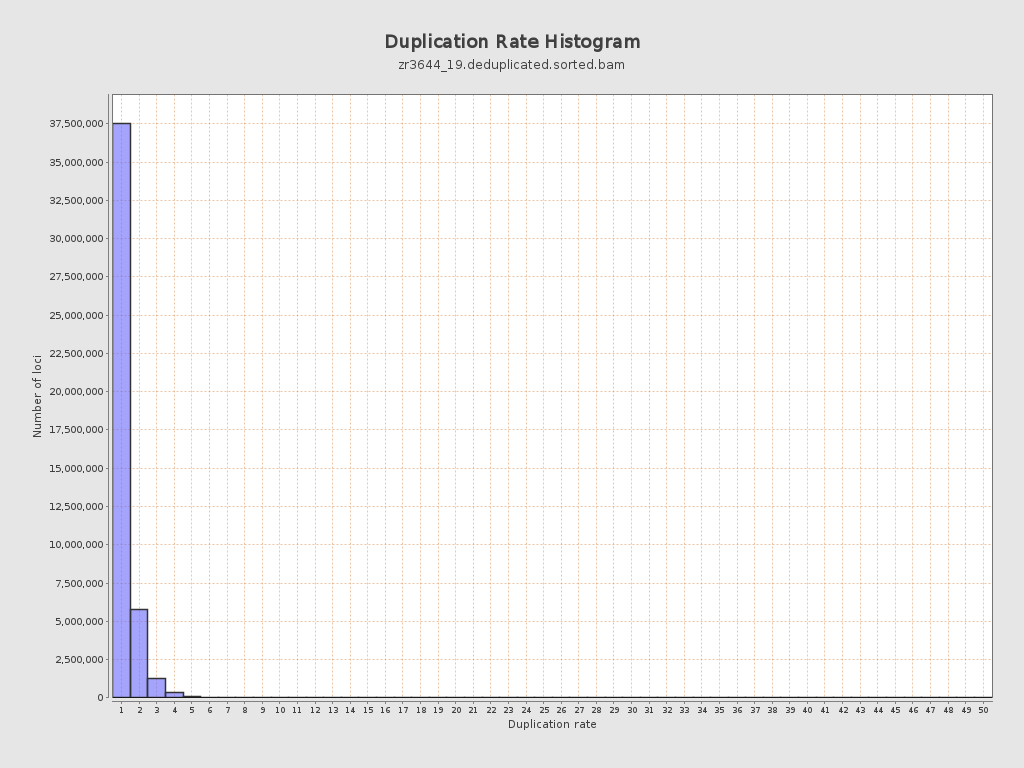
| Duplicated reads (estimated) | 10,287,806 / 18.58% |
| Duplication rate | 16.77% |
| Clipped reads | 0 / 0% |
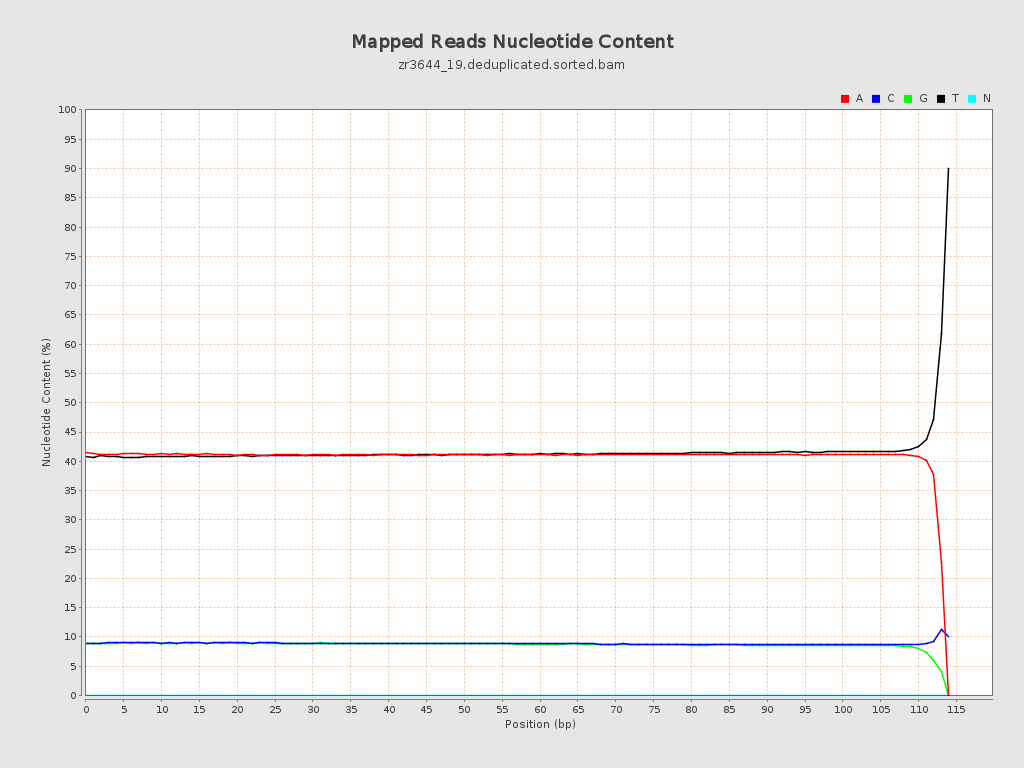
ACGT Content
| Number/percentage of A's | 2,376,875,109 / 40.99% |
| Number/percentage of C's | 514,388,753 / 8.87% |
| Number/percentage of T's | 2,400,452,584 / 41.4% |
| Number/percentage of G's | 506,568,393 / 8.74% |
| Number/percentage of N's | 42,901 / 0% |
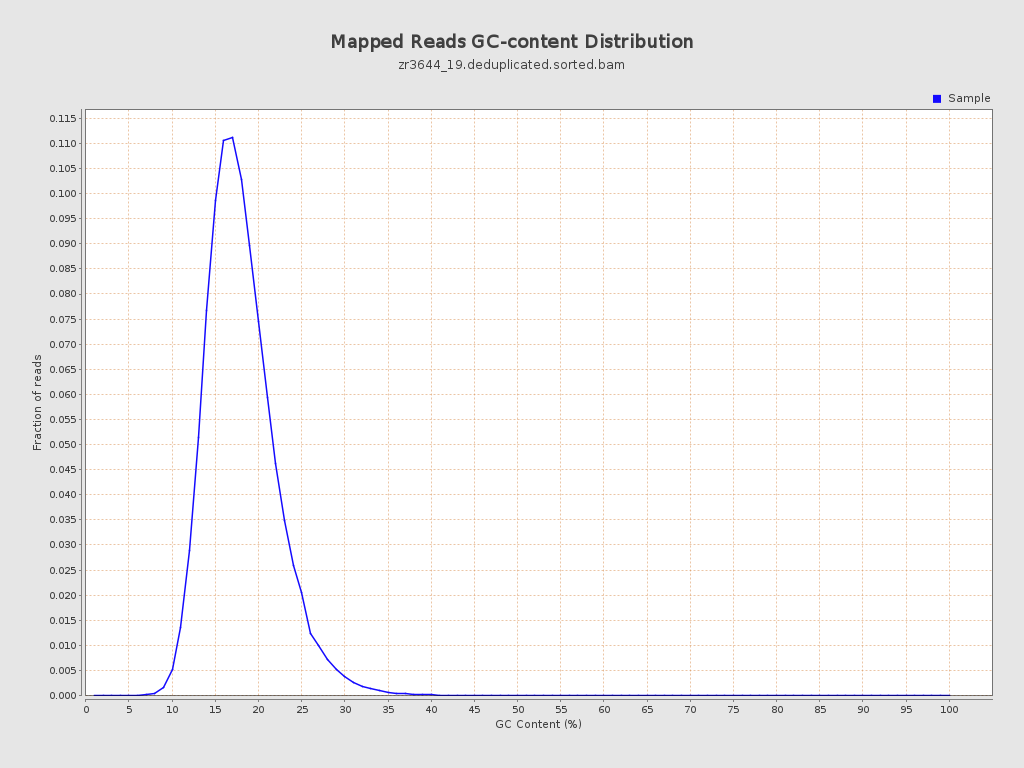
| GC Percentage | 17.61% |
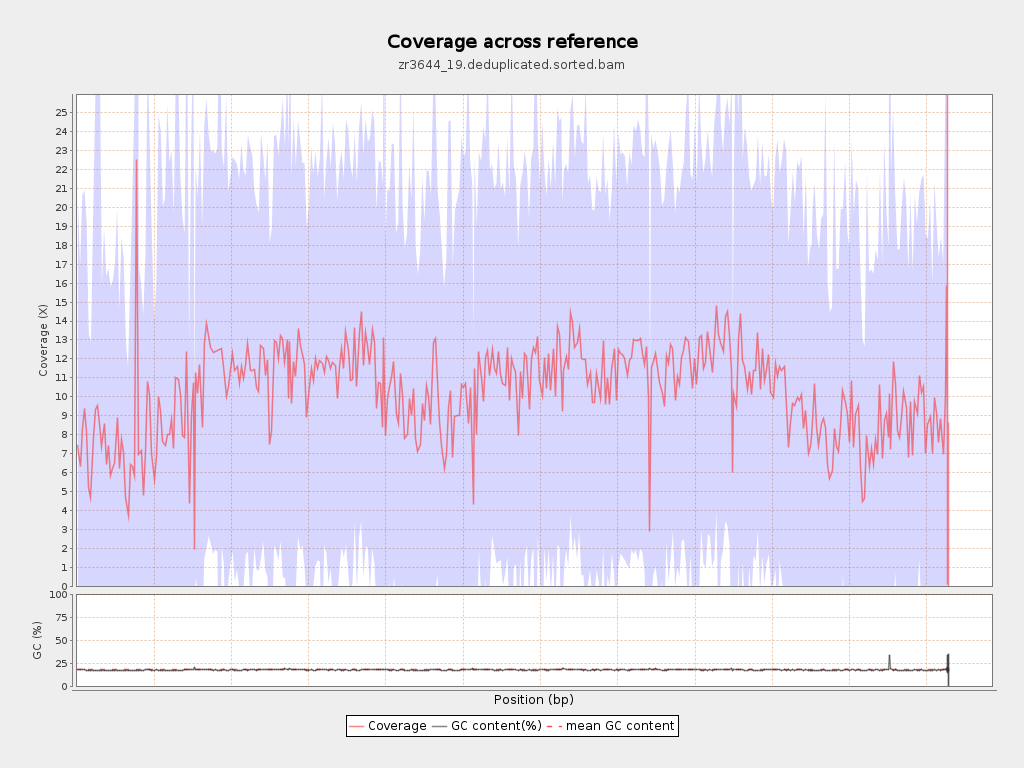
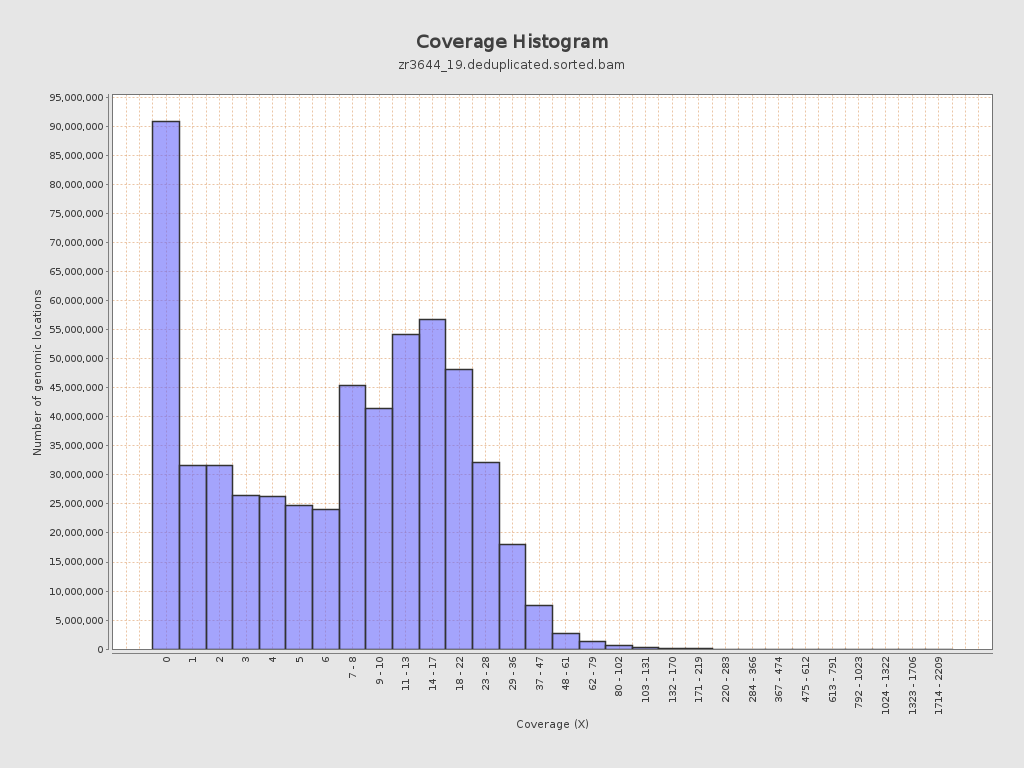
Coverage
| Mean | 10.3264 |
| Standard Deviation | 11.4538 |
| Mean (paired-end reads overlap ignored) | 7.41 |
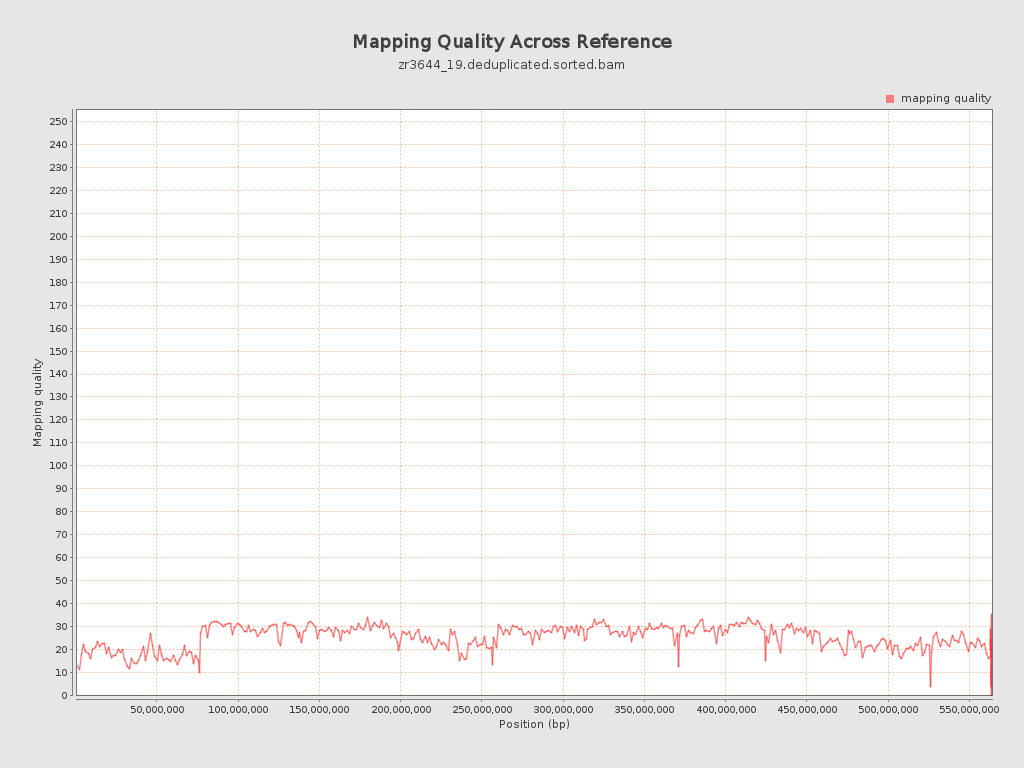
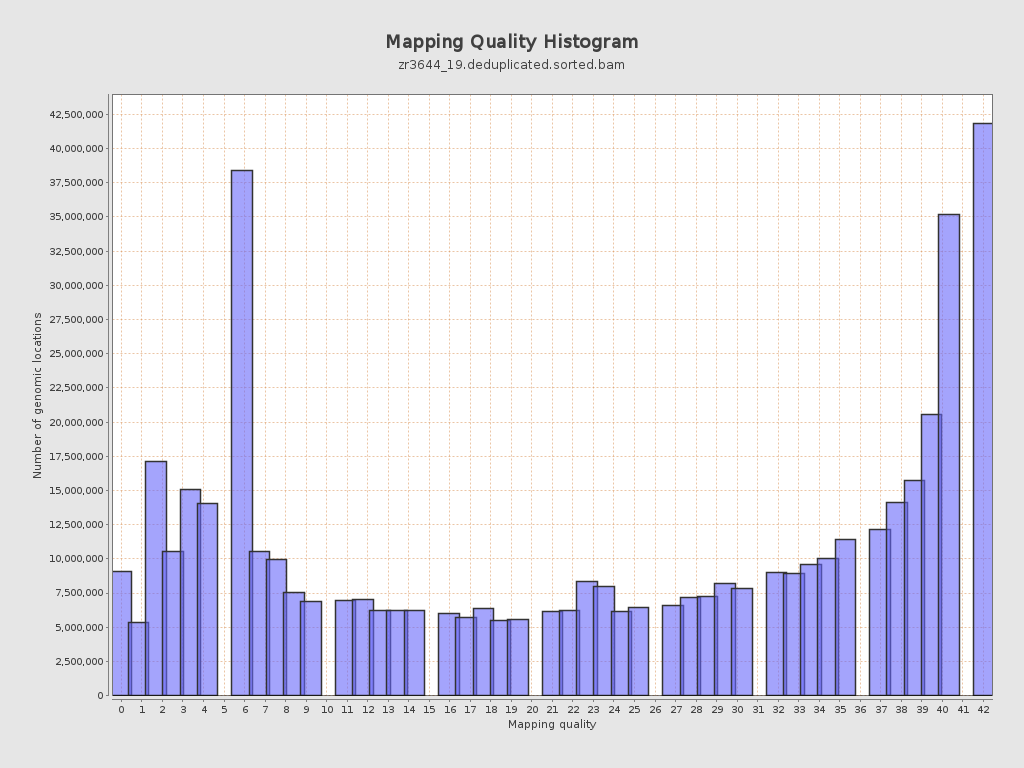
Mapping Quality
| Mean Mapping Quality | 24.73 |
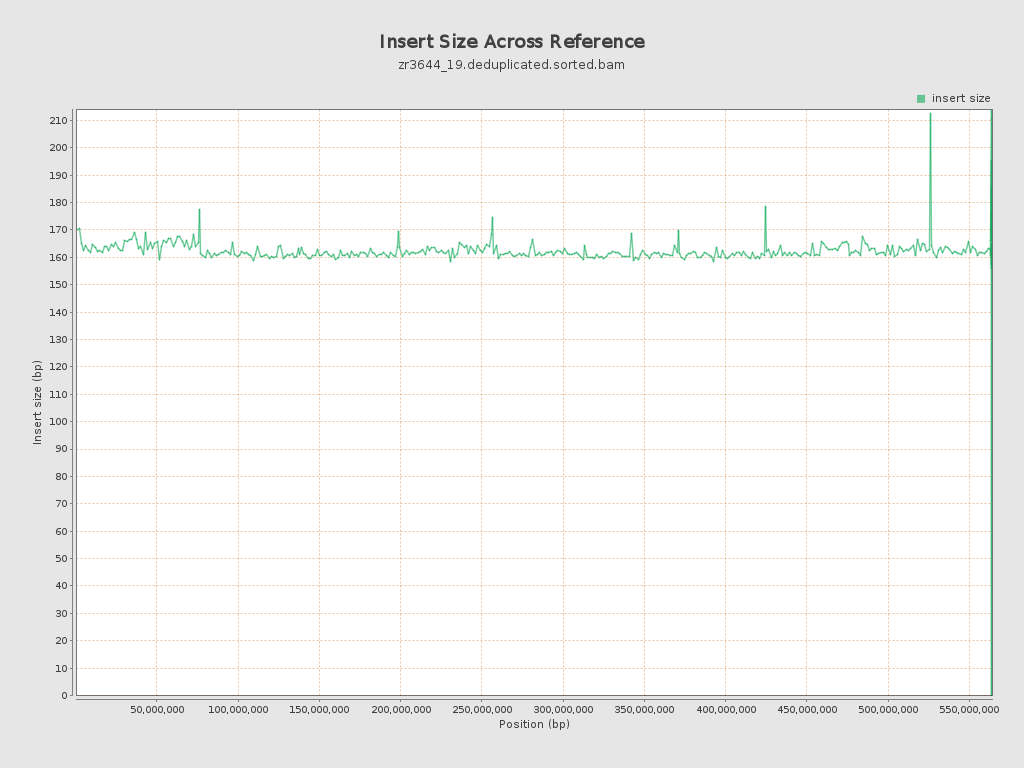
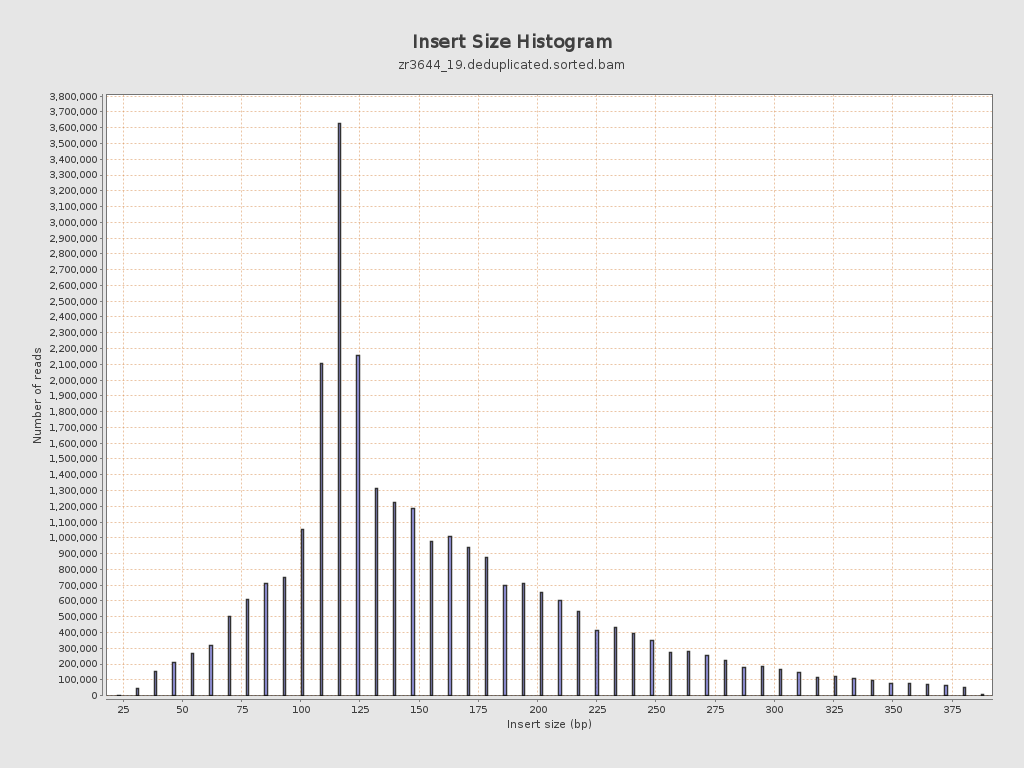
Insert size
| Mean | 161.88 |
| Standard Deviation | 72.33 |
| P25/Median/P75 | 117 / 140 / 194 |
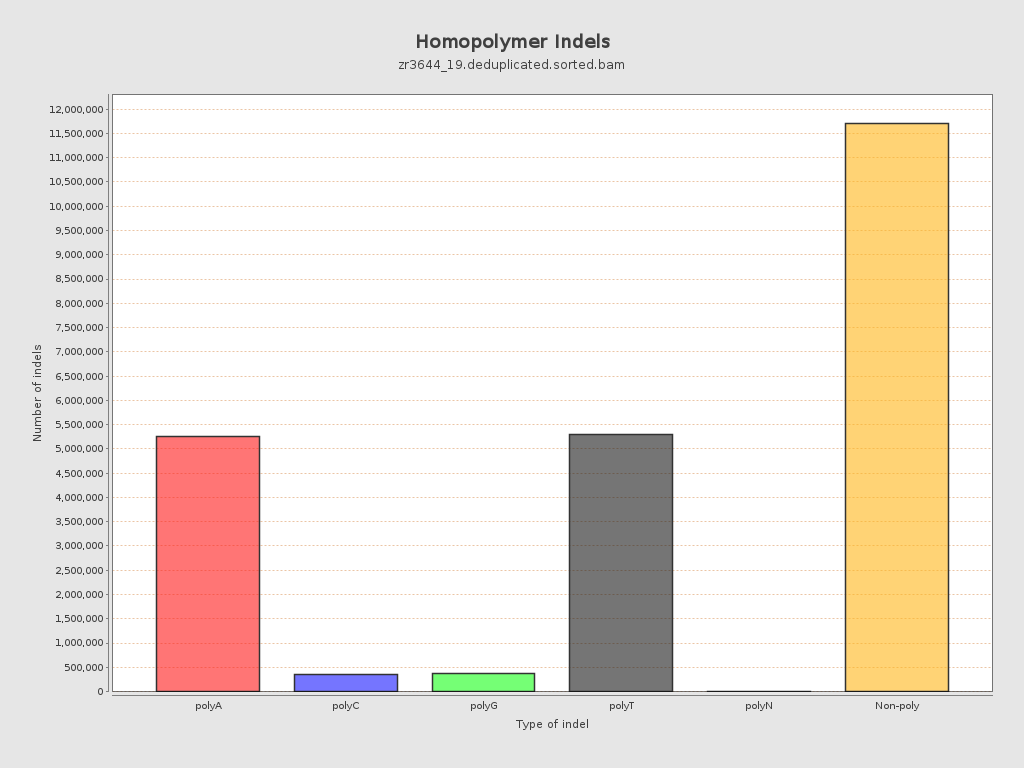
Mismatches and indels
| General error rate | 19.46% |
| Mismatches | 1,100,155,523 |
| Insertions | 12,193,902 |
| Mapped reads with at least one insertion | 16.72% |
| Deletions | 10,779,011 |
| Mapped reads with at least one deletion | 16.11% |
| Homopolymer indels | 49.04% |
Chromosome stats
| Name | Length | Mapped bases | Mean coverage | Standard deviation |
| NC_088853.1 | 76070991 | 605335515 | 7.9575 | 13.2545 |
| NC_088854.1 | 61469542 | 714164004 | 11.6182 | 10.9281 |
| NC_088855.1 | 61039741 | 714312873 | 11.7024 | 10.7253 |
| NC_088856.1 | 57946171 | 541895257 | 9.3517 | 11.6906 |
| NC_088857.1 | 57274926 | 649550655 | 11.3409 | 11.0138 |
| NC_088858.1 | 56905015 | 668700223 | 11.7512 | 10.5963 |
| NC_088859.1 | 53672946 | 649469867 | 12.1005 | 10.8786 |
| NC_088860.1 | 51133819 | 539238938 | 10.5456 | 11.4435 |
| NC_088861.1 | 50364239 | 398909594 | 7.9205 | 10.8825 |
| NC_088862.1 | 37310742 | 338446615 | 9.071 | 10.982 |
| NW_027062568.1 | 15579 | 122886 | 7.8879 | 6.9714 |
| NW_027062569.1 | 16498 | 206583 | 12.5217 | 14.4302 |
| NW_027062570.1 | 4000 | 227858 | 56.9645 | 50.3285 |
| NW_027062571.1 | 36893 | 7513 | 0.2036 | 0.6983 |
| NW_027062572.1 | 51000 | 69337 | 1.3595 | 2.5065 |
| NW_027062573.1 | 2000 | 113588 | 56.794 | 51.9003 |
| NW_027062574.1 | 37061 | 3171 | 0.0856 | 0.6383 |
| NW_027062575.1 | 49428 | 283496 | 5.7355 | 11.6101 |
| NW_027062576.1 | 49232 | 146535 | 2.9764 | 5.3307 |
| NW_027062577.1 | 17087 | 145426 | 8.5109 | 6.0095 |
| NW_027062578.1 | 34507 | 533410 | 15.458 | 8.51 |
| NW_027062579.1 | 64000 | 504587 | 7.8842 | 8.9343 |
| NW_027062580.1 | 24229 | 222544 | 9.185 | 9.6045 |
| NW_027062581.1 | 5000 | 20786 | 4.1572 | 8.8354 |
| NW_027062582.1 | 18808 | 162048 | 8.6159 | 10.8715 |
| NW_027062583.1 | 1000 | 0 | 0 | 0 |
| NW_027062584.1 | 74000 | 12399 | 0.1676 | 1.1468 |
| NW_027062585.1 | 39334 | 268992 | 6.8387 | 7.2435 |
| NW_027062586.1 | 258015 | 876015 | 3.3952 | 6.7143 |
