Input data and parameters
QualiMap command line
| qualimap bamqc -bam zr3644_18.deduplicated.sorted.bam -nw 400 -hm 3 |
Alignment
| Command line: | "bismark -1 zr3644_18_R1_val_1_val_1_val_1.fq.gz -2 zr3644_18_R2_val_2_val_2_val_2.fq.gz --genome BismarkIndex --bam --score_min L,0,-0.8 --non_directional --prefix zr3644_18 --multicore 3" |
| Draw chromosome limits: | no |
| Analyze overlapping paired-end reads: | yes |
| Program: | Bismark (v0.24.2) |
| Analysis date: | Wed Apr 16 06:48:44 GMT 2025 |
| Size of a homopolymer: | 3 |
| Skip duplicate alignments: | no |
| Number of windows: | 400 |
| BAM file: | zr3644_18.deduplicated.sorted.bam |
Summary
Globals
| Reference size | 563,985,803 |
| Number of reads | 57,967,116 |
| Mapped reads | 57,967,116 / 100% |
| Unmapped reads | 0 / 0% |
| Mapped paired reads | 57,967,116 / 100% |
| Mapped reads, first in pair | 28,983,558 / 50% |
| Mapped reads, second in pair | 28,983,558 / 50% |
| Mapped reads, both in pair | 57,967,116 / 100% |
| Mapped reads, singletons | 0 / 0% |
| Secondary alignments | 0 |
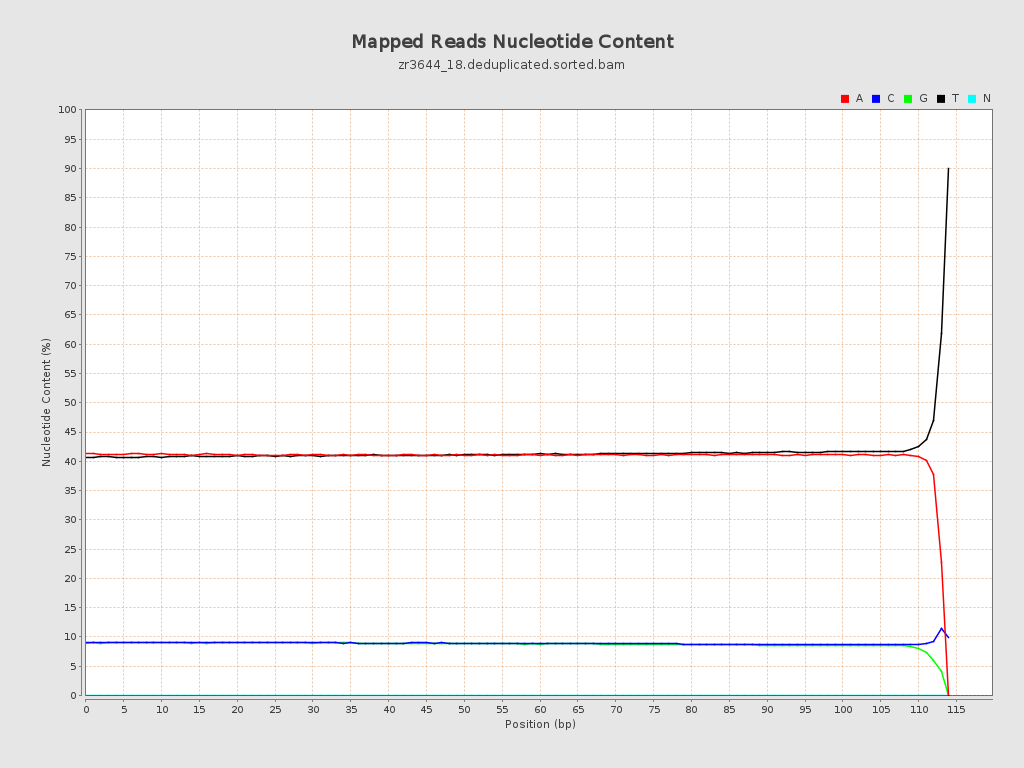
| Read min/max/mean length | 20 / 115 / 105.14 |
| Overlapping read pairs | 24,585,020 / 84.82% |
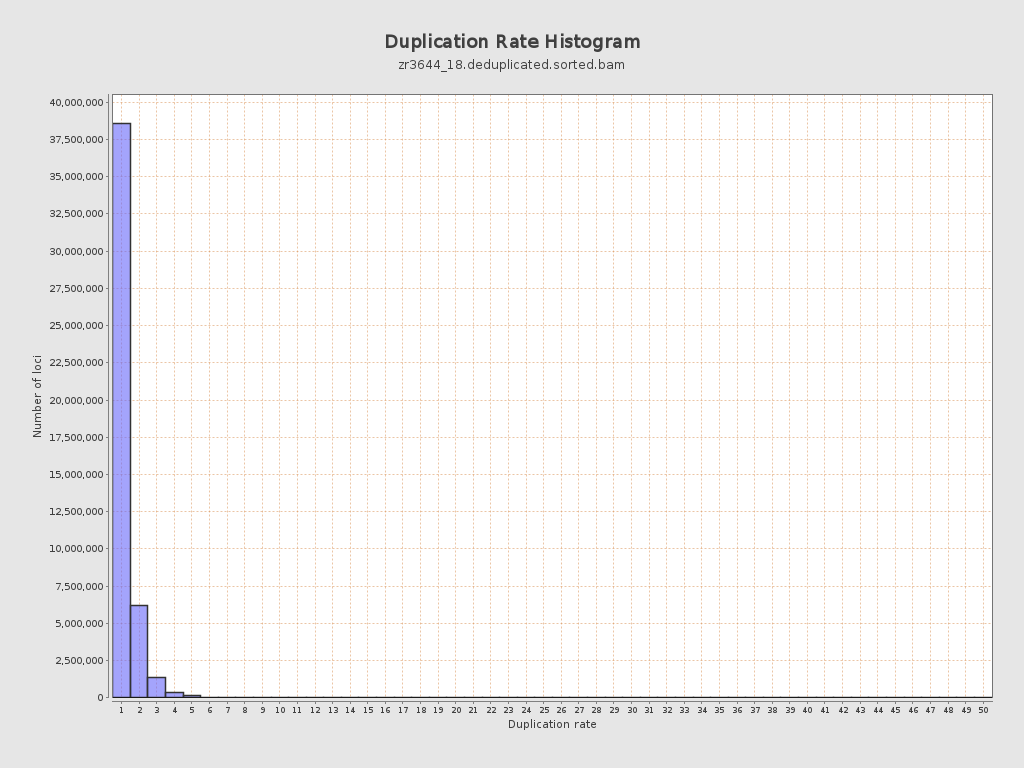
| Duplicated reads (estimated) | 11,243,680 / 19.4% |
| Duplication rate | 17.47% |
| Clipped reads | 0 / 0% |
ACGT Content
| Number/percentage of A's | 2,481,109,293 / 40.94% |
| Number/percentage of C's | 540,568,632 / 8.92% |
| Number/percentage of T's | 2,506,167,479 / 41.36% |
| Number/percentage of G's | 532,181,022 / 8.78% |
| Number/percentage of N's | 44,945 / 0% |
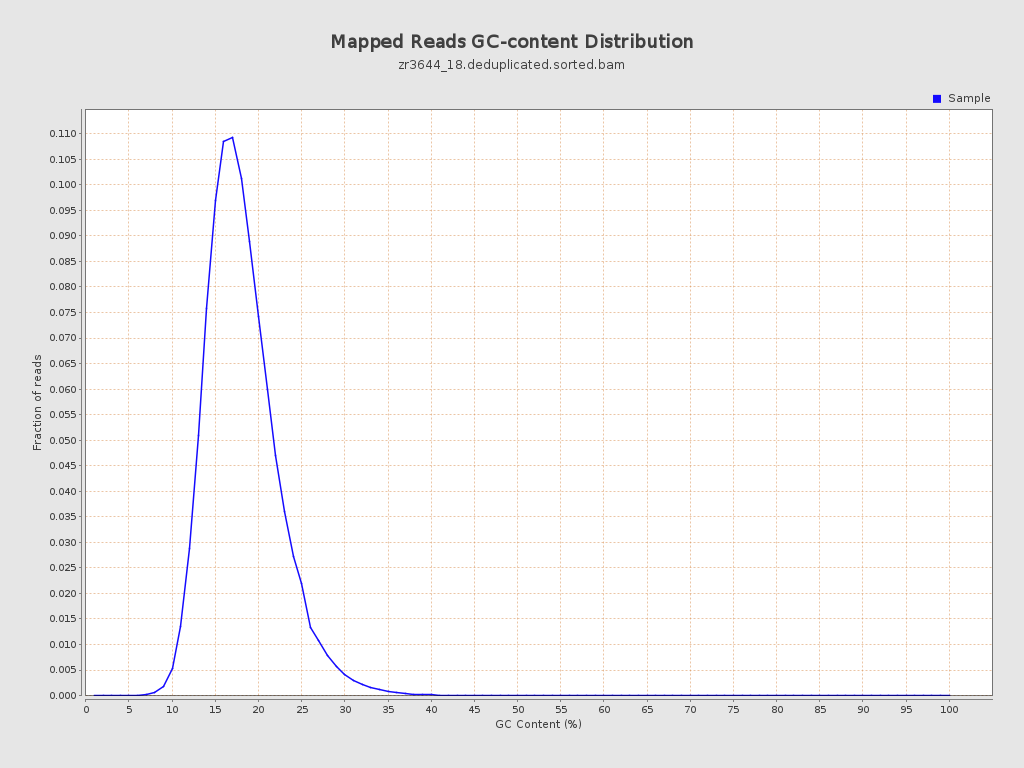
| GC Percentage | 17.7% |
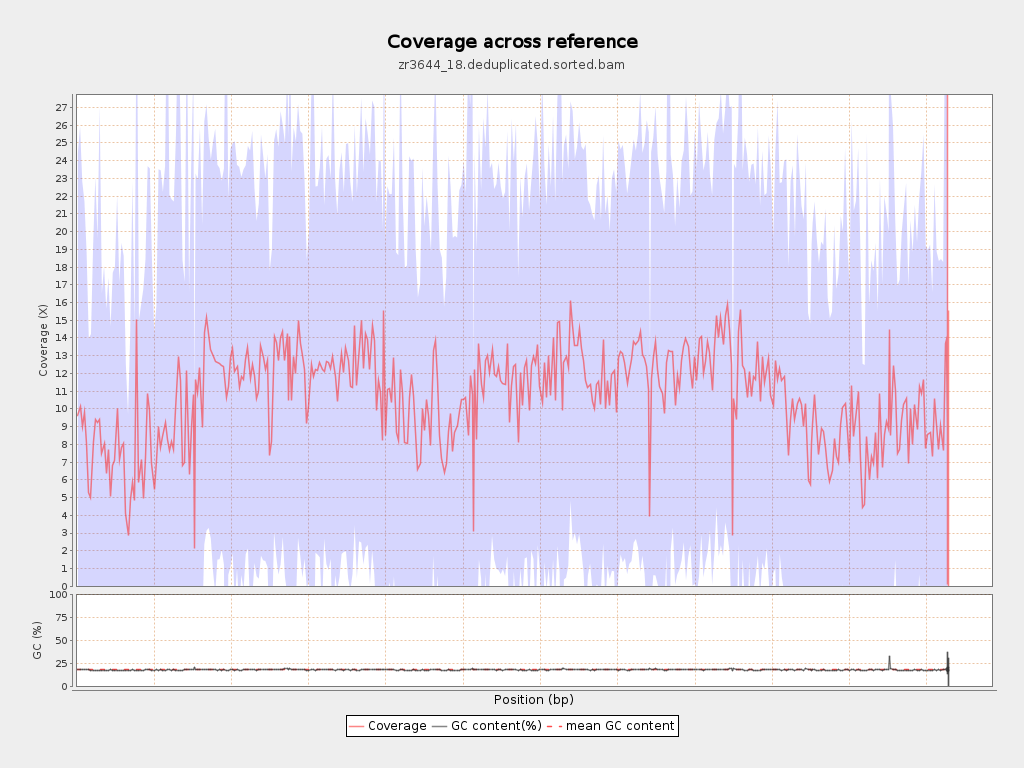
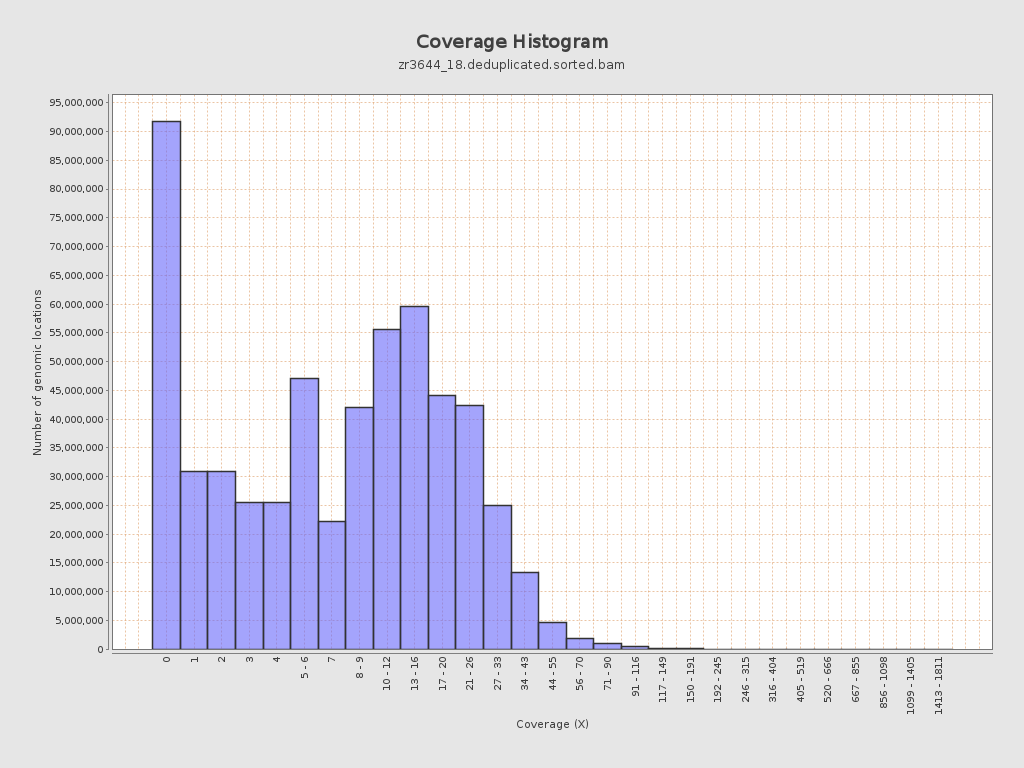
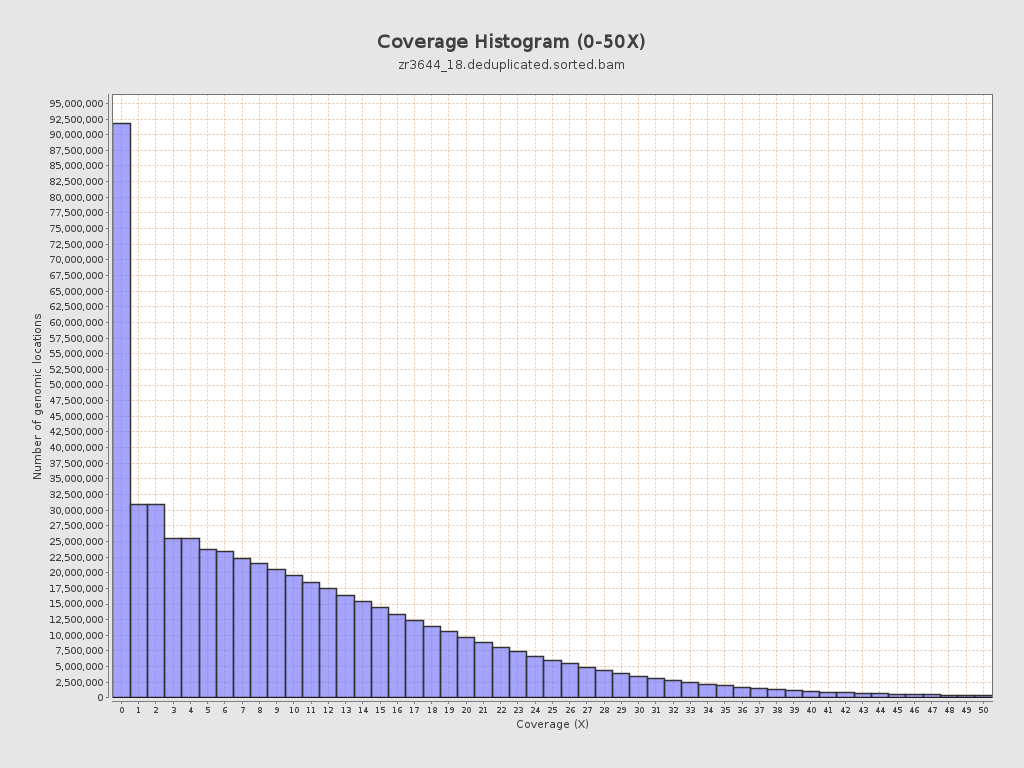
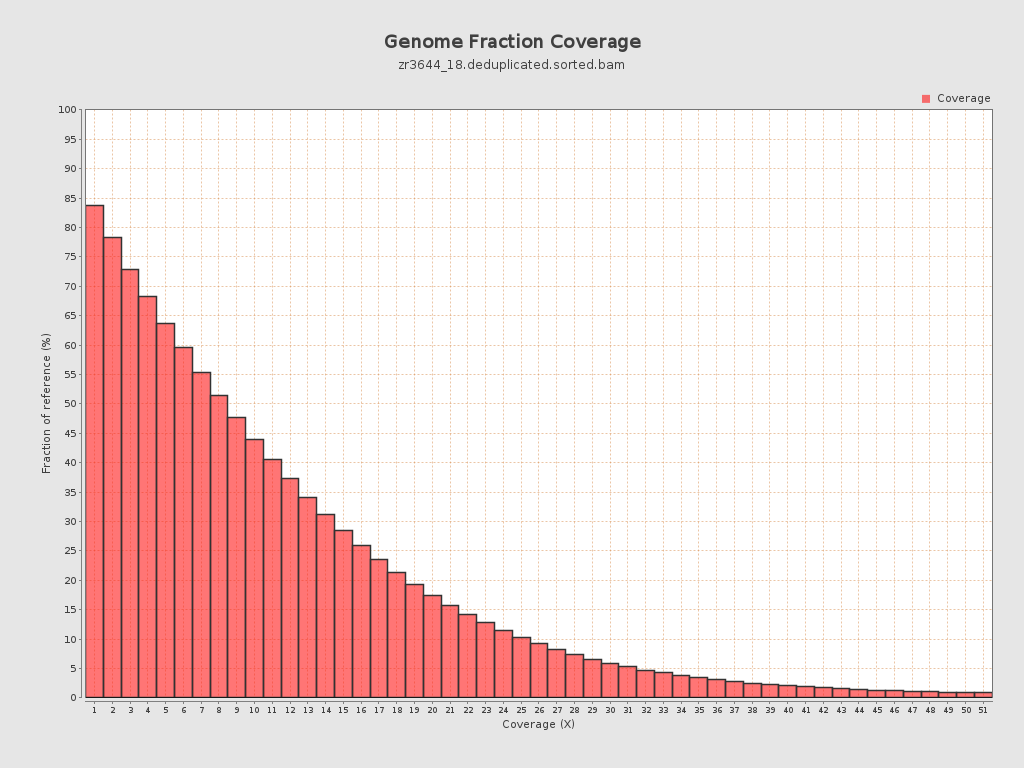
Coverage
| Mean | 10.7921 |
| Standard Deviation | 12.0648 |
| Mean (paired-end reads overlap ignored) | 7.68 |
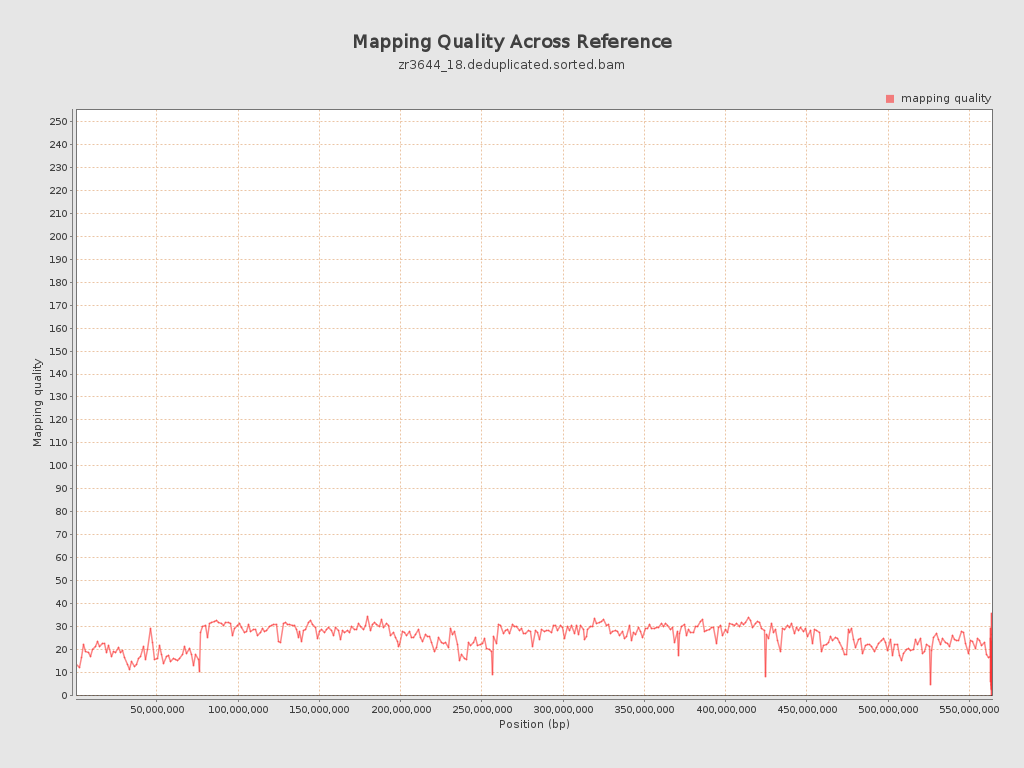
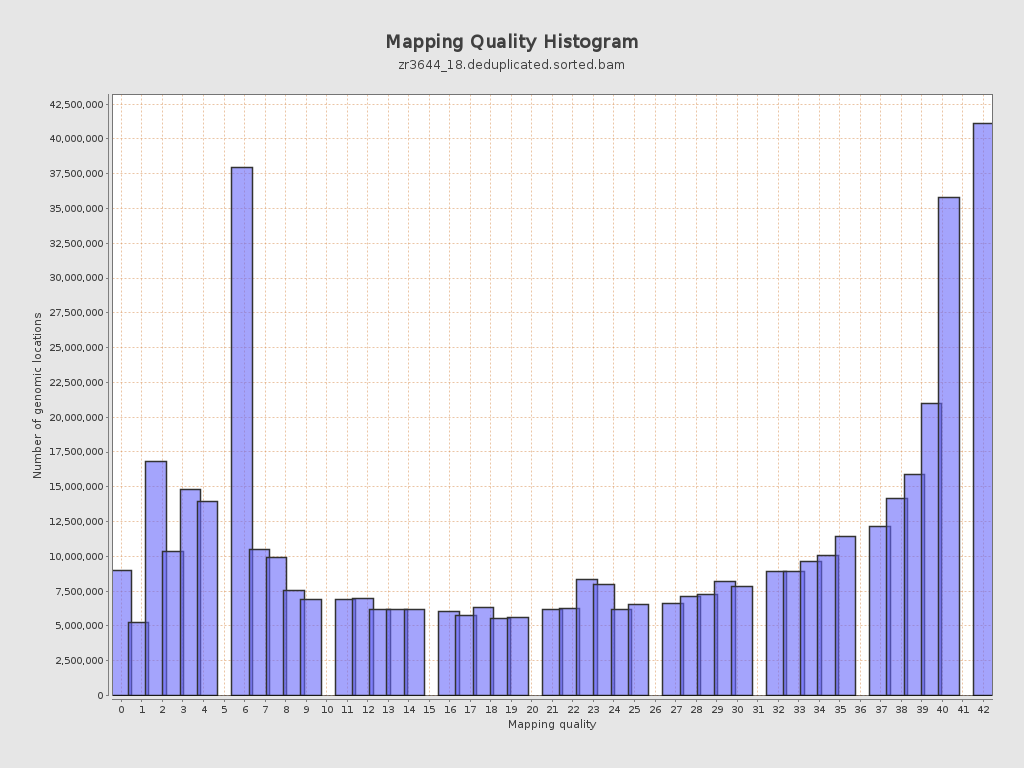
Mapping Quality
| Mean Mapping Quality | 24.87 |
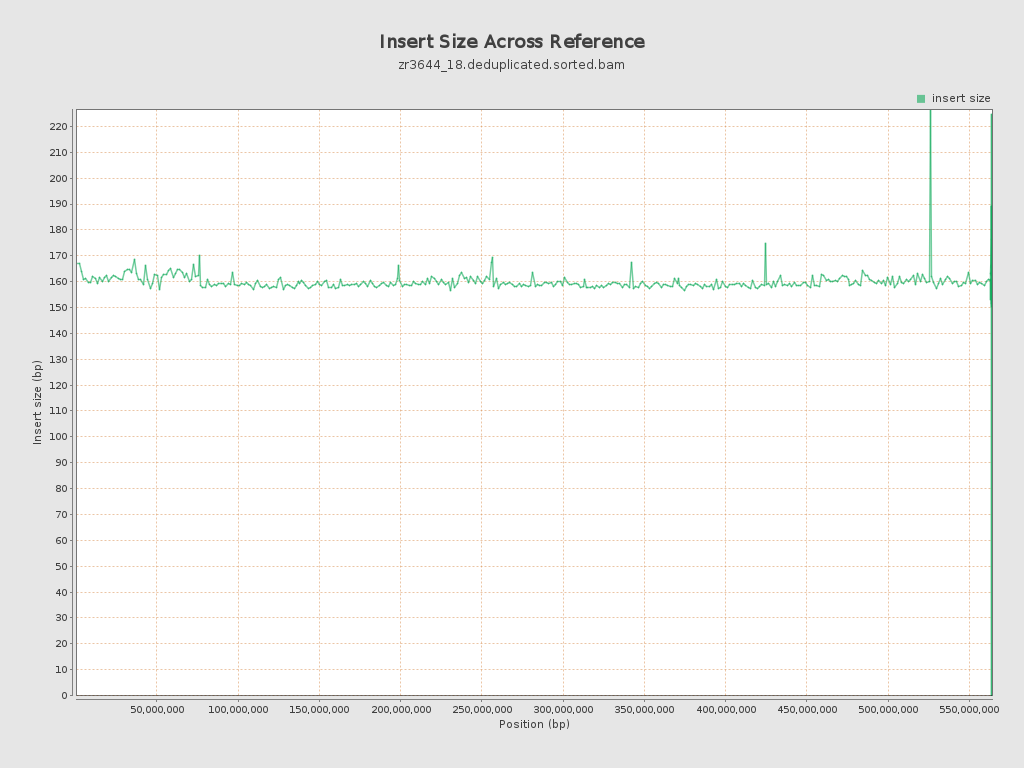
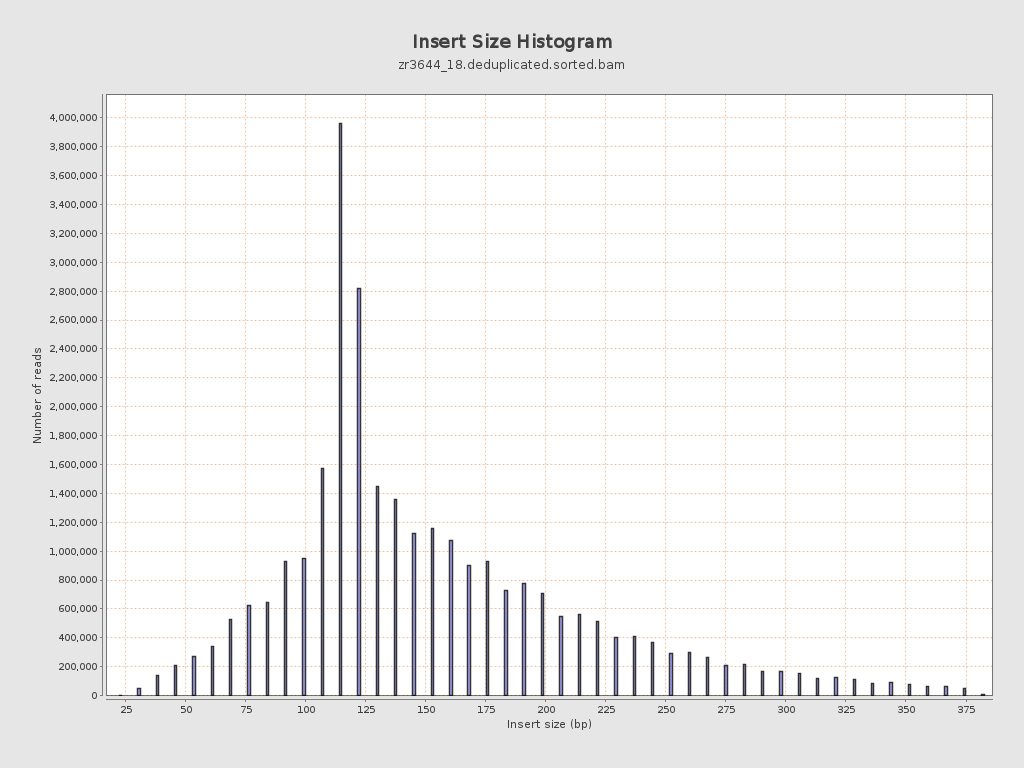
Insert size
| Mean | 159.51 |
| Standard Deviation | 70.57 |
| P25/Median/P75 | 117 / 138 / 191 |
Mismatches and indels
| General error rate | 19.49% |
| Mismatches | 1,151,648,535 |
| Insertions | 12,644,440 |
| Mapped reads with at least one insertion | 16.54% |
| Deletions | 11,147,131 |
| Mapped reads with at least one deletion | 15.93% |
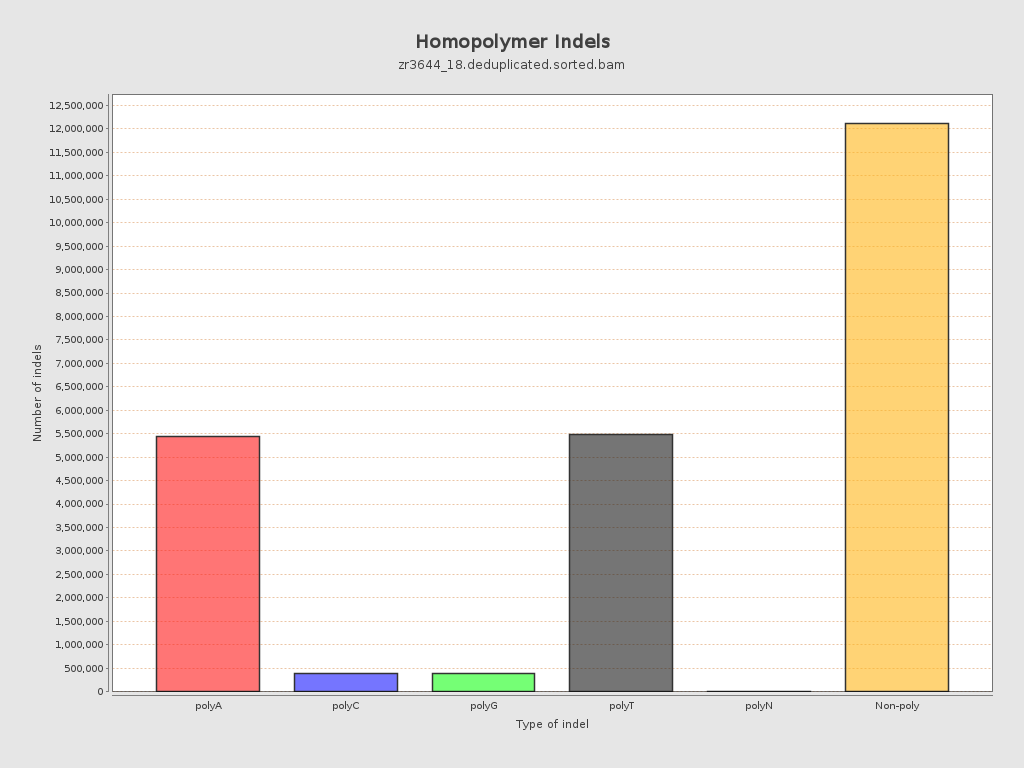
| Homopolymer indels | 49.06% |
Chromosome stats
| Name | Length | Mapped bases | Mean coverage | Standard deviation |
| NC_088853.1 | 76070991 | 606235565 | 7.9693 | 13.0141 |
| NC_088854.1 | 61469542 | 756754745 | 12.3111 | 11.8247 |
| NC_088855.1 | 61039741 | 753340458 | 12.3418 | 11.672 |
| NC_088856.1 | 57946171 | 562490614 | 9.7071 | 12.3376 |
| NC_088857.1 | 57274926 | 682479709 | 11.9159 | 11.6565 |
| NC_088858.1 | 56905015 | 705923114 | 12.4053 | 11.1794 |
| NC_088859.1 | 53672946 | 691487157 | 12.8833 | 11.8999 |
| NC_088860.1 | 51133819 | 559703146 | 10.9459 | 12.0721 |
| NC_088861.1 | 50364239 | 409383422 | 8.1285 | 11.1575 |
| NC_088862.1 | 37310742 | 355083329 | 9.5169 | 11.9266 |
| NW_027062568.1 | 15579 | 135580 | 8.7027 | 7.6981 |
| NW_027062569.1 | 16498 | 104426 | 6.3296 | 12.918 |
| NW_027062570.1 | 4000 | 241623 | 60.4057 | 53.441 |
| NW_027062571.1 | 36893 | 14089 | 0.3819 | 2.1416 |
| NW_027062572.1 | 51000 | 40210 | 0.7884 | 1.8267 |
| NW_027062573.1 | 2000 | 129468 | 64.734 | 49.7898 |
| NW_027062574.1 | 37061 | 2705 | 0.073 | 0.6198 |
| NW_027062575.1 | 49428 | 321600 | 6.5064 | 12.8979 |
| NW_027062576.1 | 49232 | 235851 | 4.7906 | 14.4837 |
| NW_027062577.1 | 17087 | 140814 | 8.241 | 6.2904 |
| NW_027062578.1 | 34507 | 599738 | 17.3802 | 9.9819 |
| NW_027062579.1 | 64000 | 454335 | 7.099 | 9.5297 |
| NW_027062580.1 | 24229 | 214684 | 8.8606 | 8.7862 |
| NW_027062581.1 | 5000 | 16300 | 3.26 | 6.2991 |
| NW_027062582.1 | 18808 | 292666 | 15.5607 | 13.5387 |
| NW_027062583.1 | 1000 | 0 | 0 | 0 |
| NW_027062584.1 | 74000 | 12447 | 0.1682 | 0.947 |
| NW_027062585.1 | 39334 | 321833 | 8.1821 | 7.5521 |
| NW_027062586.1 | 258015 | 451111 | 1.7484 | 5.556 |