Input data and parameters
QualiMap command line
| qualimap bamqc -bam zr3644_17.deduplicated.sorted.bam -nw 400 -hm 3 |
Alignment
| Command line: | "bismark -1 zr3644_17_R1_val_1_val_1_val_1.fq.gz -2 zr3644_17_R2_val_2_val_2_val_2.fq.gz --genome BismarkIndex --bam --score_min L,0,-0.8 --non_directional --prefix zr3644_17 --multicore 3" |
| Draw chromosome limits: | no |
| Analyze overlapping paired-end reads: | yes |
| Program: | Bismark (v0.24.2) |
| Analysis date: | Wed Apr 16 05:38:29 GMT 2025 |
| Size of a homopolymer: | 3 |
| Skip duplicate alignments: | no |
| Number of windows: | 400 |
| BAM file: | zr3644_17.deduplicated.sorted.bam |
Summary
Globals
| Reference size | 563,985,803 |
| Number of reads | 63,717,702 |
| Mapped reads | 63,717,702 / 100% |
| Unmapped reads | 0 / 0% |
| Mapped paired reads | 63,717,702 / 100% |
| Mapped reads, first in pair | 31,858,851 / 50% |
| Mapped reads, second in pair | 31,858,851 / 50% |
| Mapped reads, both in pair | 63,717,702 / 100% |
| Mapped reads, singletons | 0 / 0% |
| Secondary alignments | 0 |
| Read min/max/mean length | 20 / 115 / 105.13 |
| Overlapping read pairs | 27,008,867 / 84.78% |
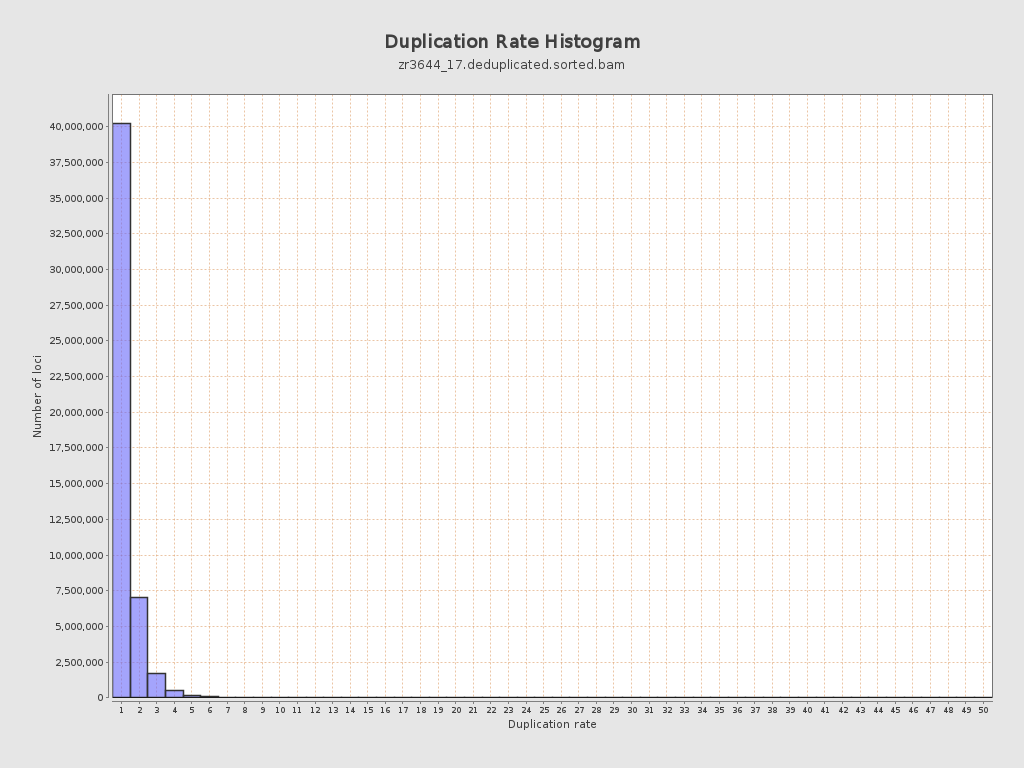
| Duplicated reads (estimated) | 13,887,834 / 21.8% |
| Duplication rate | 19.3% |
| Clipped reads | 0 / 0% |
ACGT Content
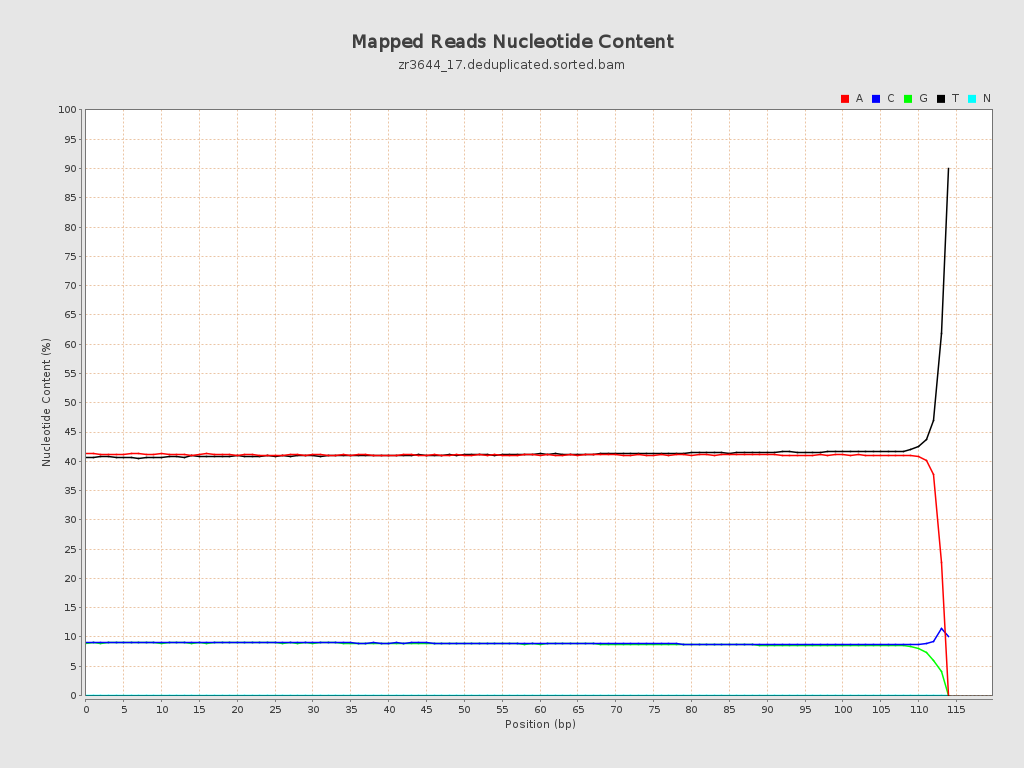
| Number/percentage of A's | 2,727,212,428 / 40.94% |
| Number/percentage of C's | 594,734,704 / 8.93% |
| Number/percentage of T's | 2,754,518,742 / 41.35% |
| Number/percentage of G's | 584,869,194 / 8.78% |
| Number/percentage of N's | 50,221 / 0% |
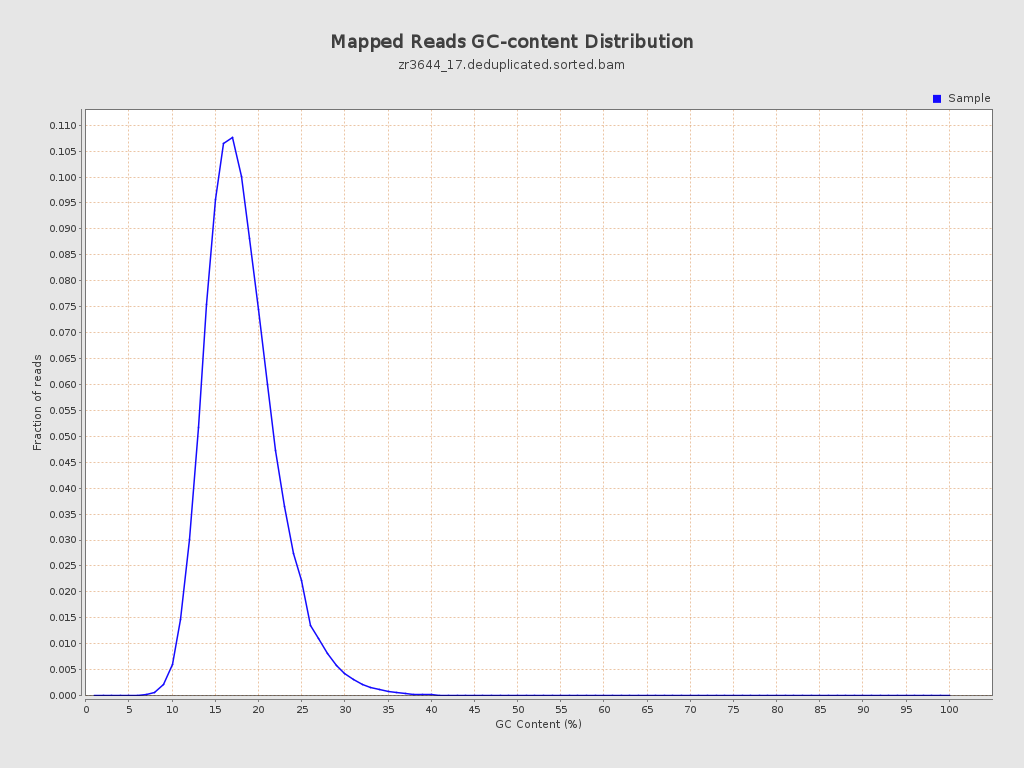
| GC Percentage | 17.71% |
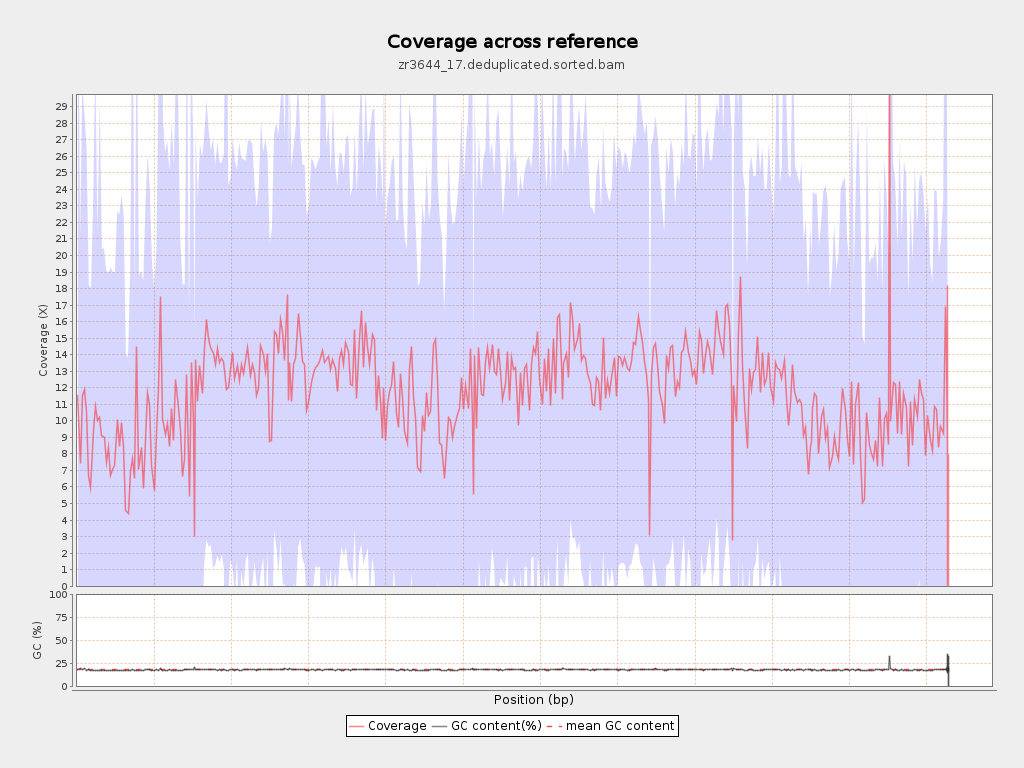
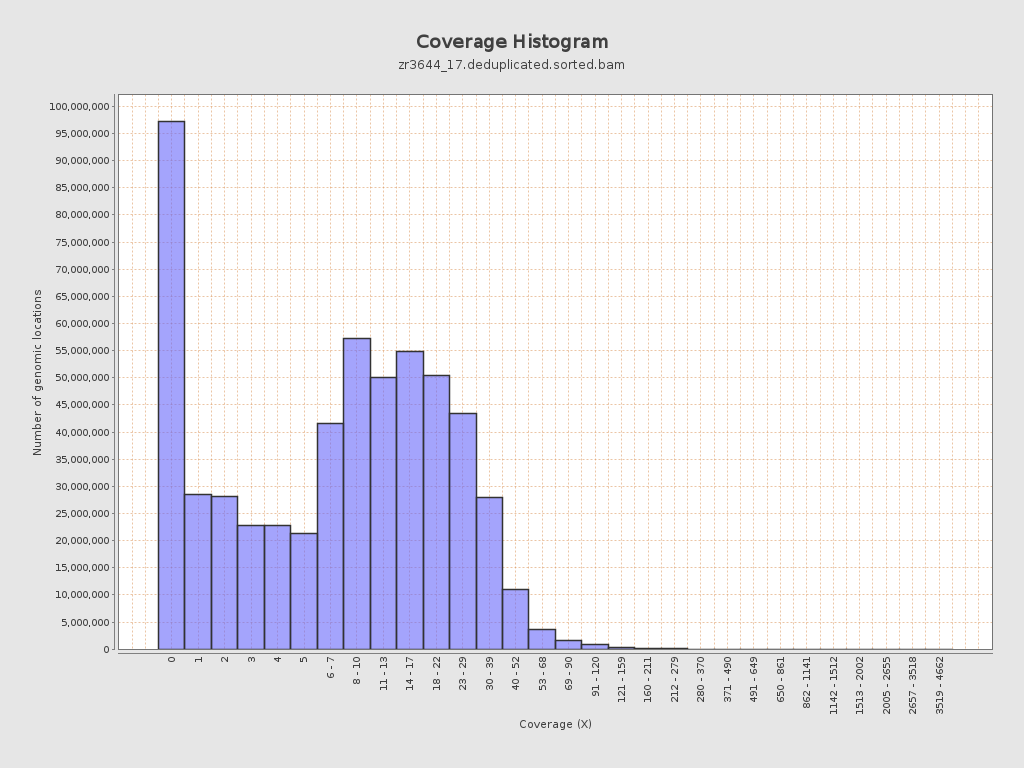
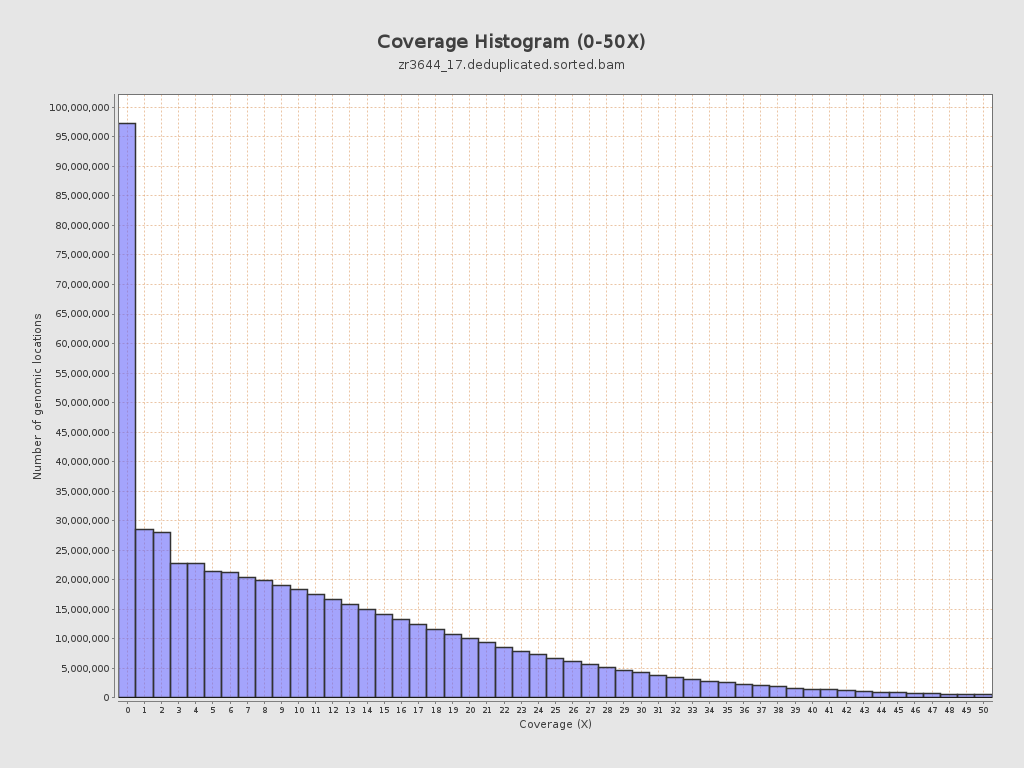
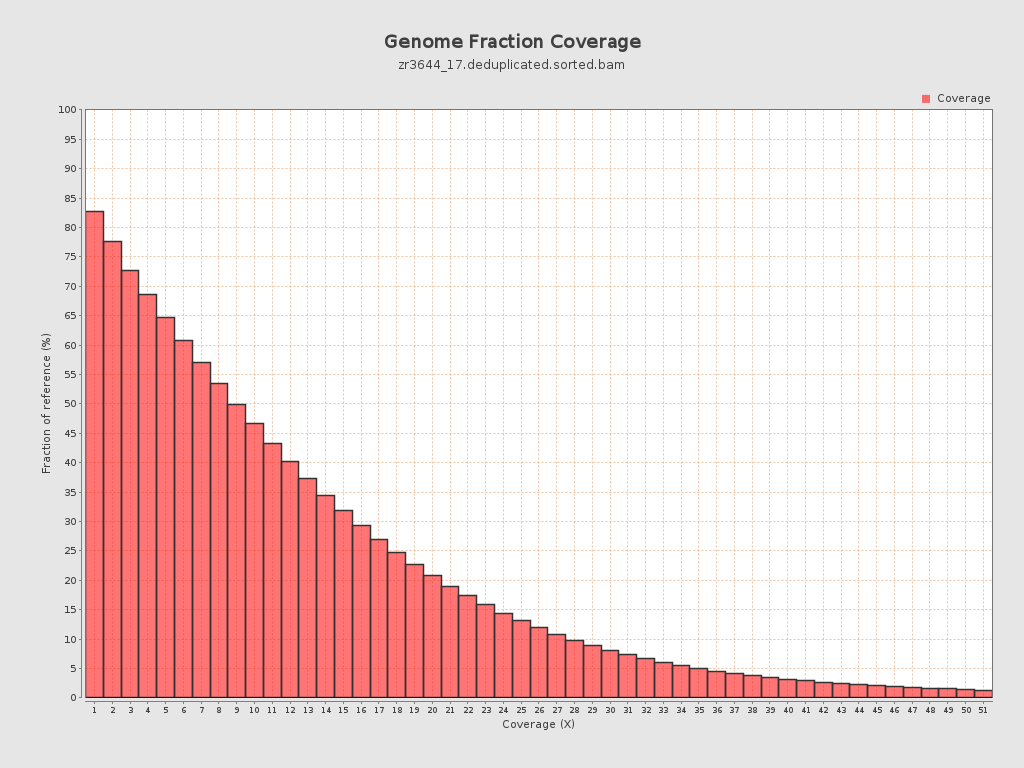
Coverage
| Mean | 11.8624 |
| Standard Deviation | 15.5617 |
| Mean (paired-end reads overlap ignored) | 8.45 |
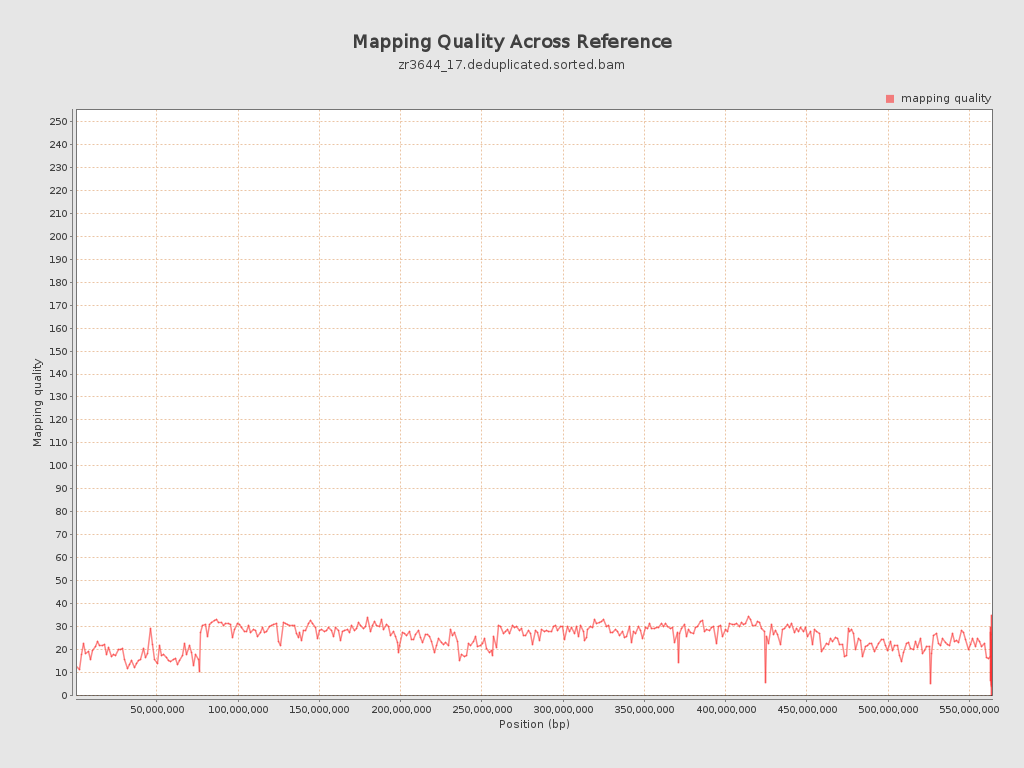
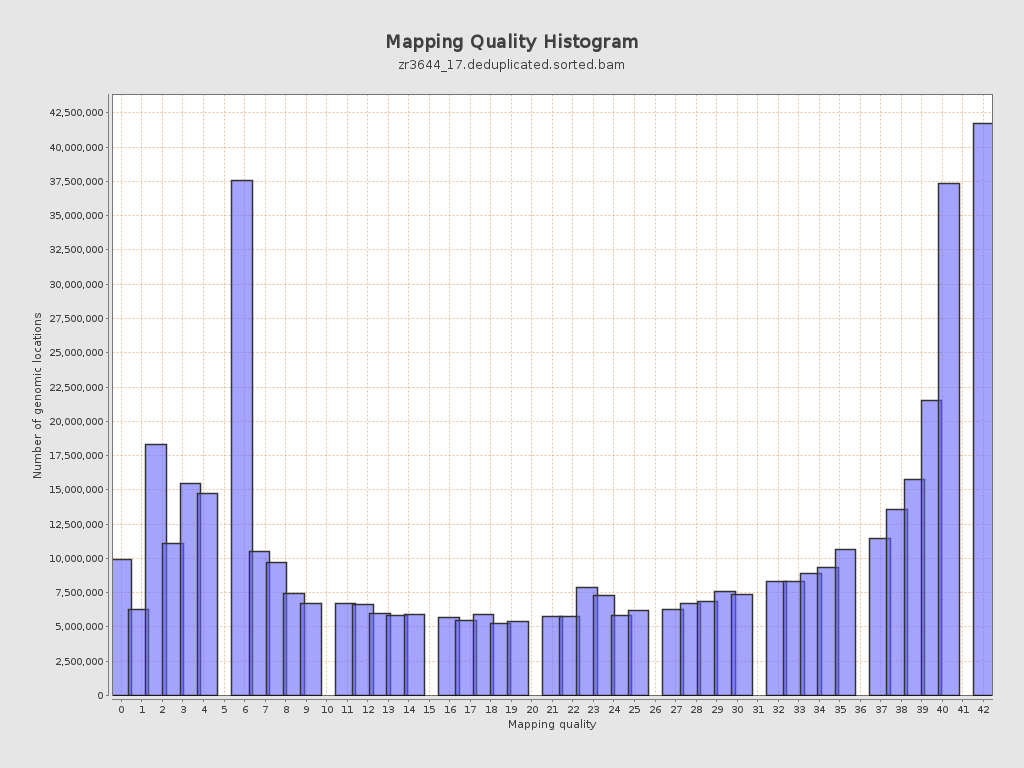
Mapping Quality
| Mean Mapping Quality | 24.8 |
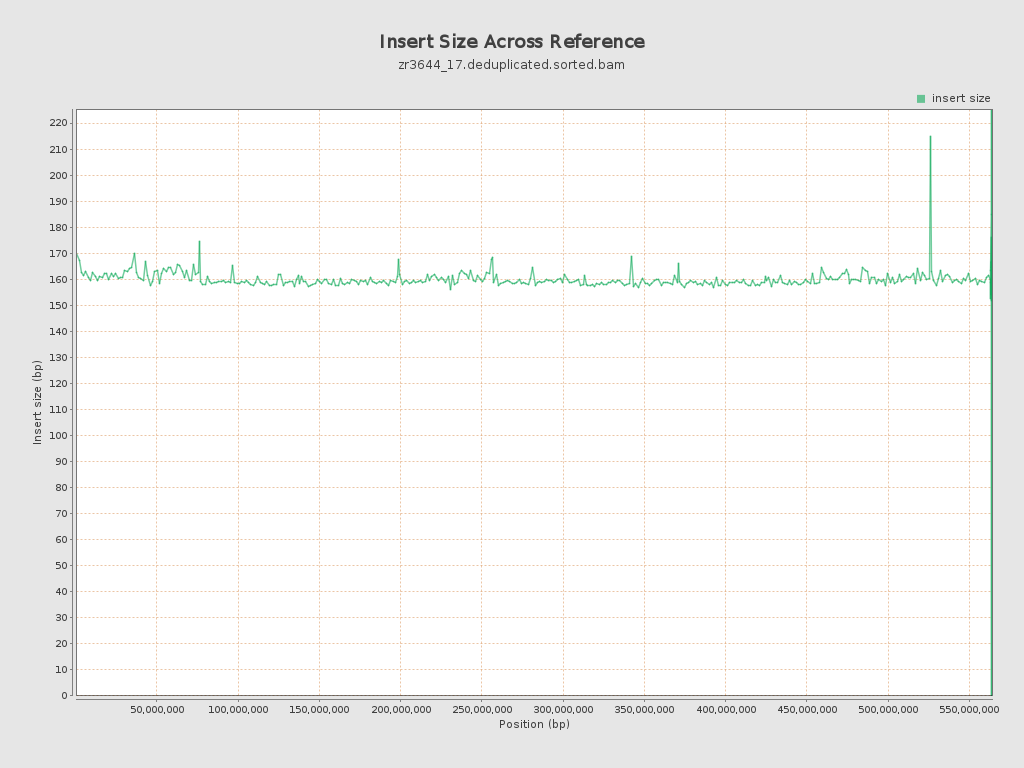
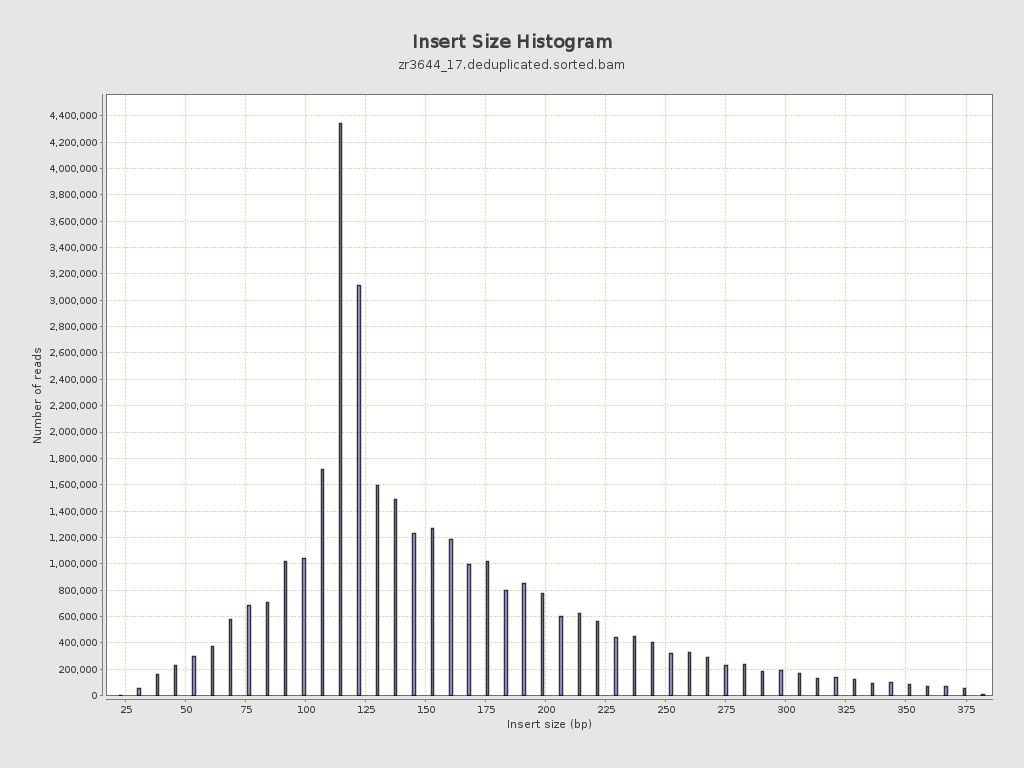
Insert size
| Mean | 159.63 |
| Standard Deviation | 70.73 |
| P25/Median/P75 | 117 / 138 / 191 |
Mismatches and indels
| General error rate | 19.5% |
| Mismatches | 1,267,344,328 |
| Insertions | 13,813,327 |
| Mapped reads with at least one insertion | 16.46% |
| Deletions | 12,043,148 |
| Mapped reads with at least one deletion | 15.64% |
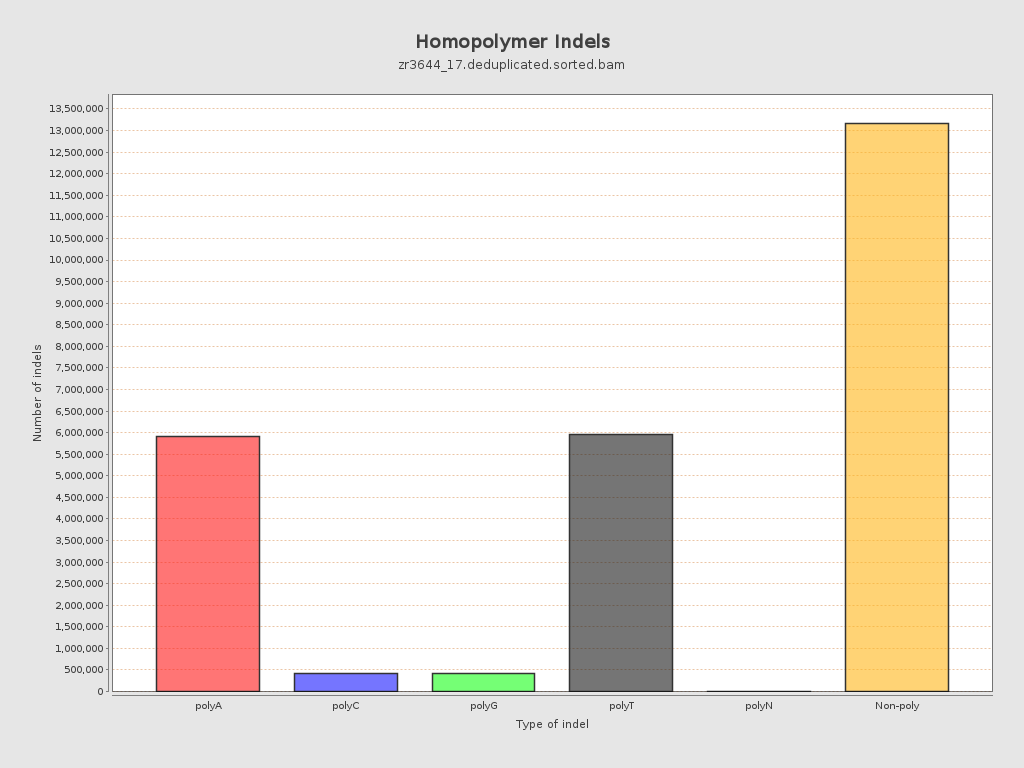
| Homopolymer indels | 49.07% |
Chromosome stats
| Name | Length | Mapped bases | Mean coverage | Standard deviation |
| NC_088853.1 | 76070991 | 694994452 | 9.1361 | 24.5246 |
| NC_088854.1 | 61469542 | 826164016 | 13.4402 | 13.6236 |
| NC_088855.1 | 61039741 | 817558354 | 13.3939 | 13.0566 |
| NC_088856.1 | 57946171 | 622721056 | 10.7465 | 13.6684 |
| NC_088857.1 | 57274926 | 745678268 | 13.0193 | 13.6358 |
| NC_088858.1 | 56905015 | 766317247 | 13.4666 | 12.4306 |
| NC_088859.1 | 53672946 | 742316681 | 13.8304 | 12.9785 |
| NC_088860.1 | 51133819 | 614753077 | 12.0224 | 14.5679 |
| NC_088861.1 | 50364239 | 461934322 | 9.1719 | 12.8195 |
| NC_088862.1 | 37310742 | 394221861 | 10.5659 | 15.2591 |
| NW_027062568.1 | 15579 | 122044 | 7.8339 | 8.4281 |
| NW_027062569.1 | 16498 | 112409 | 6.8135 | 13.6634 |
| NW_027062570.1 | 4000 | 52536 | 13.134 | 11.4633 |
| NW_027062571.1 | 36893 | 6310 | 0.171 | 0.8655 |
| NW_027062572.1 | 51000 | 39952 | 0.7834 | 2.2098 |
| NW_027062573.1 | 2000 | 35899 | 17.9495 | 10.5488 |
| NW_027062574.1 | 37061 | 2451 | 0.0661 | 0.5706 |
| NW_027062575.1 | 49428 | 285828 | 5.7827 | 11.2374 |
| NW_027062576.1 | 49232 | 218035 | 4.4287 | 8.918 |
| NW_027062577.1 | 17087 | 176445 | 10.3263 | 8.1865 |
| NW_027062578.1 | 34507 | 627244 | 18.1773 | 10.618 |
| NW_027062579.1 | 64000 | 334982 | 5.2341 | 11.4517 |
| NW_027062580.1 | 24229 | 161180 | 6.6524 | 7.423 |
| NW_027062581.1 | 5000 | 28679 | 5.7358 | 9.6512 |
| NW_027062582.1 | 18808 | 113232 | 6.0204 | 6.5762 |
| NW_027062583.1 | 1000 | 0 | 0 | 0 |
| NW_027062584.1 | 74000 | 13716 | 0.1854 | 1.0883 |
| NW_027062585.1 | 39334 | 312227 | 7.9378 | 8.0272 |
| NW_027062586.1 | 258015 | 918146 | 3.5585 | 7.4188 |