Input data and parameters
QualiMap command line
| qualimap bamqc -bam zr3644_16.deduplicated.sorted.bam -nw 400 -hm 3 |
Alignment
| Command line: | "bismark -1 zr3644_16_R1_val_1_val_1_val_1.fq.gz -2 zr3644_16_R2_val_2_val_2_val_2.fq.gz --genome BismarkIndex --bam --score_min L,0,-0.8 --non_directional --prefix zr3644_16 --multicore 3" |
| Draw chromosome limits: | no |
| Analyze overlapping paired-end reads: | yes |
| Program: | Bismark (v0.24.2) |
| Analysis date: | Wed Apr 16 07:23:11 GMT 2025 |
| Size of a homopolymer: | 3 |
| Skip duplicate alignments: | no |
| Number of windows: | 400 |
| BAM file: | zr3644_16.deduplicated.sorted.bam |
Summary
Globals
| Reference size | 563,985,803 |
| Number of reads | 56,508,516 |
| Mapped reads | 56,508,516 / 100% |
| Unmapped reads | 0 / 0% |
| Mapped paired reads | 56,508,516 / 100% |
| Mapped reads, first in pair | 28,254,258 / 50% |
| Mapped reads, second in pair | 28,254,258 / 50% |
| Mapped reads, both in pair | 56,508,516 / 100% |
| Mapped reads, singletons | 0 / 0% |
| Secondary alignments | 0 |
| Read min/max/mean length | 20 / 115 / 103.97 |
| Overlapping read pairs | 24,793,306 / 87.75% |
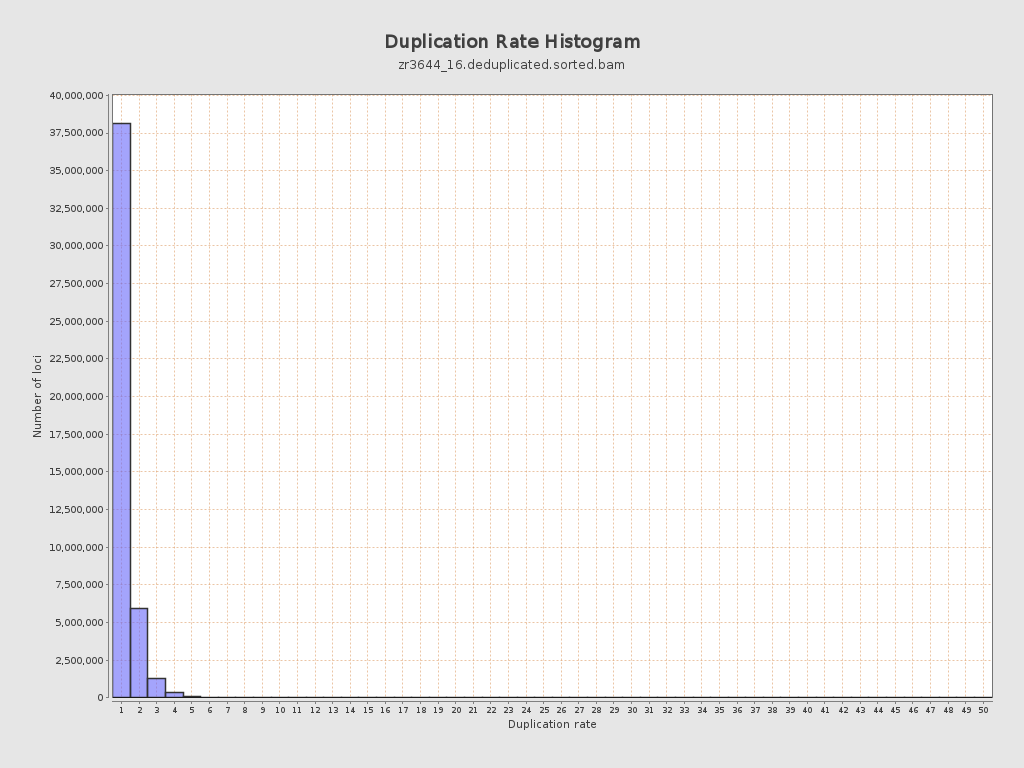
| Duplicated reads (estimated) | 10,619,070 / 18.79% |
| Duplication rate | 16.93% |
| Clipped reads | 0 / 0% |
ACGT Content
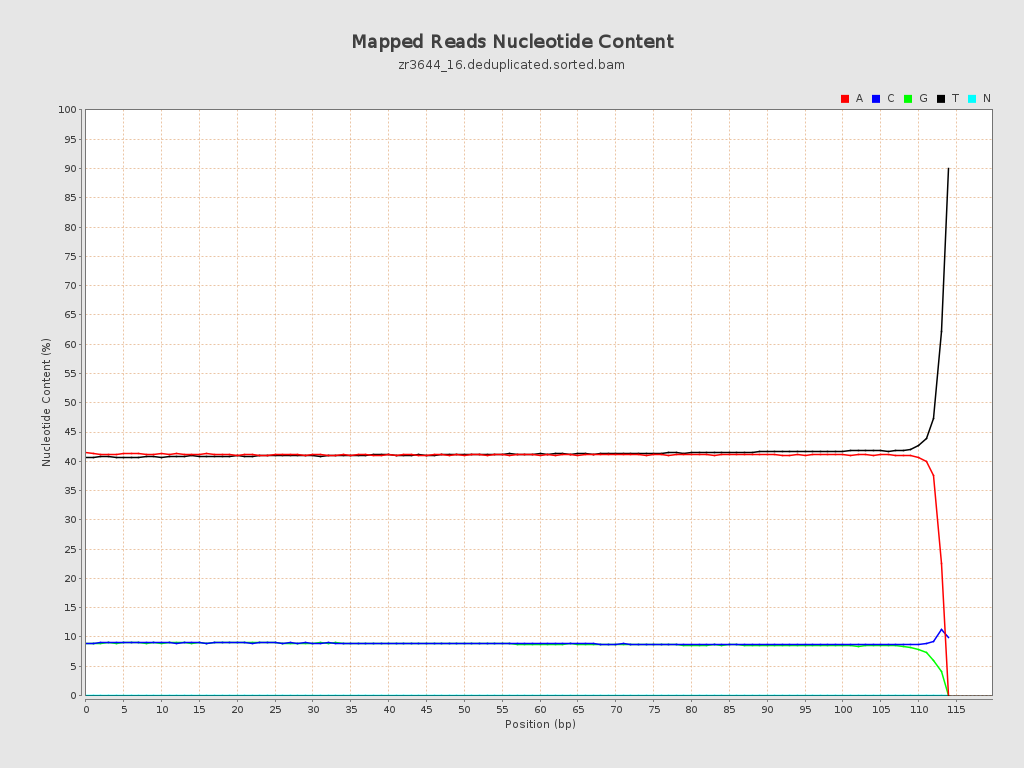
| Number/percentage of A's | 2,394,061,882 / 40.98% |
| Number/percentage of C's | 519,075,212 / 8.88% |
| Number/percentage of T's | 2,417,993,160 / 41.39% |
| Number/percentage of G's | 511,183,017 / 8.75% |
| Number/percentage of N's | 42,583 / 0% |
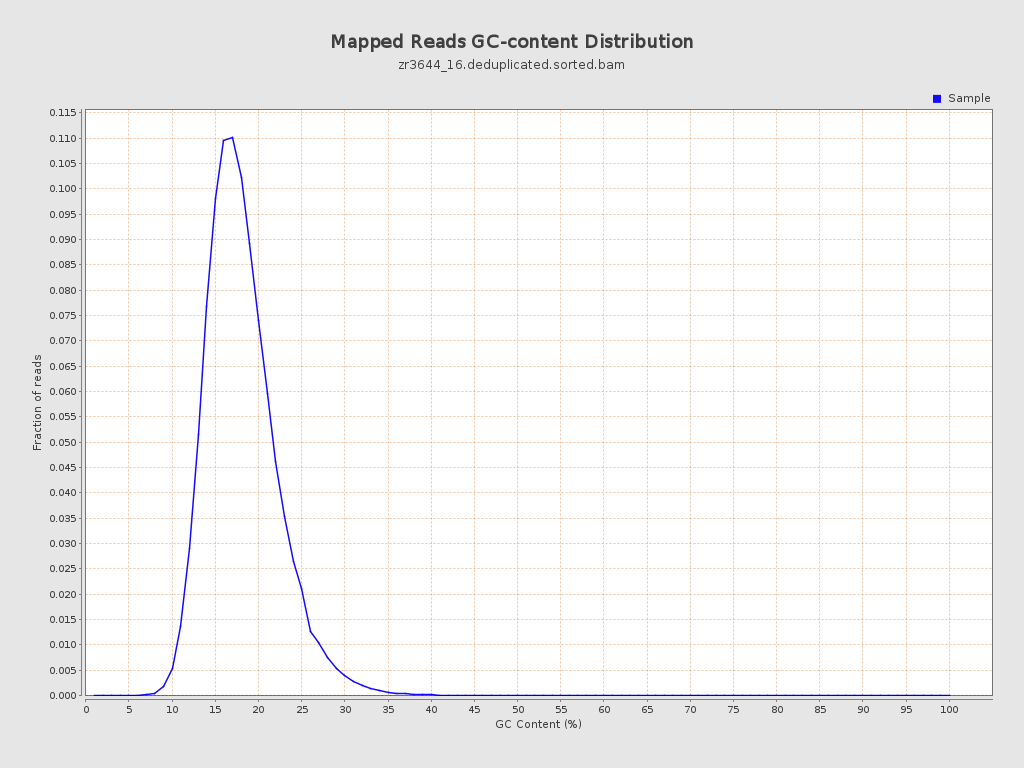
| GC Percentage | 17.63% |
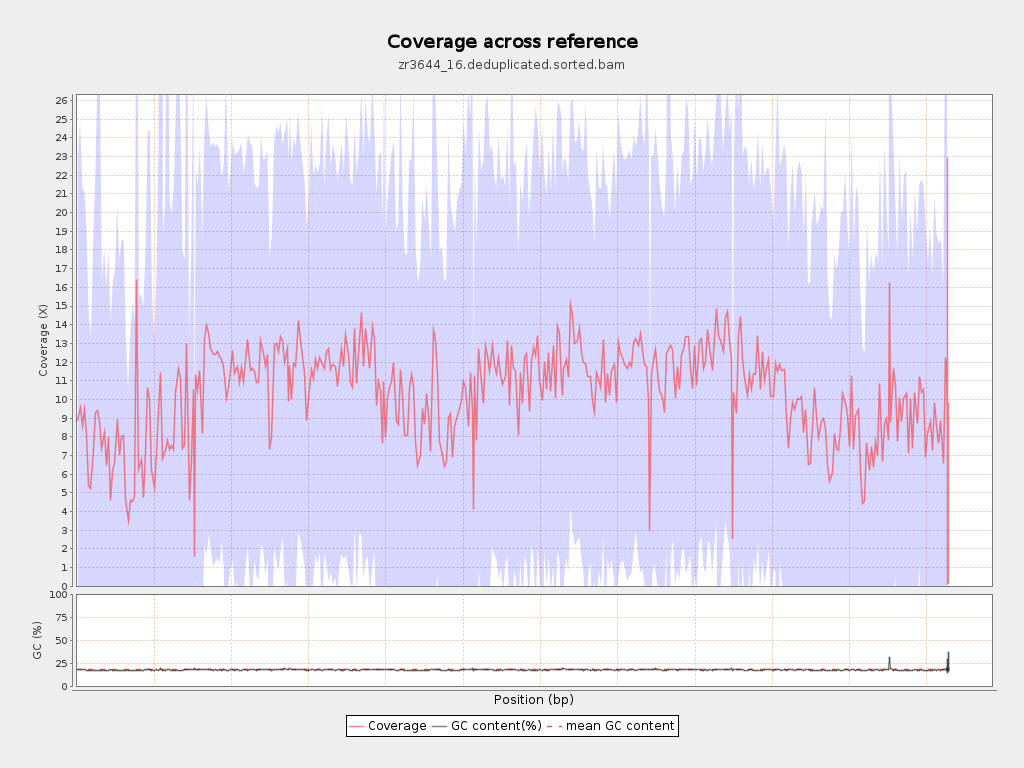
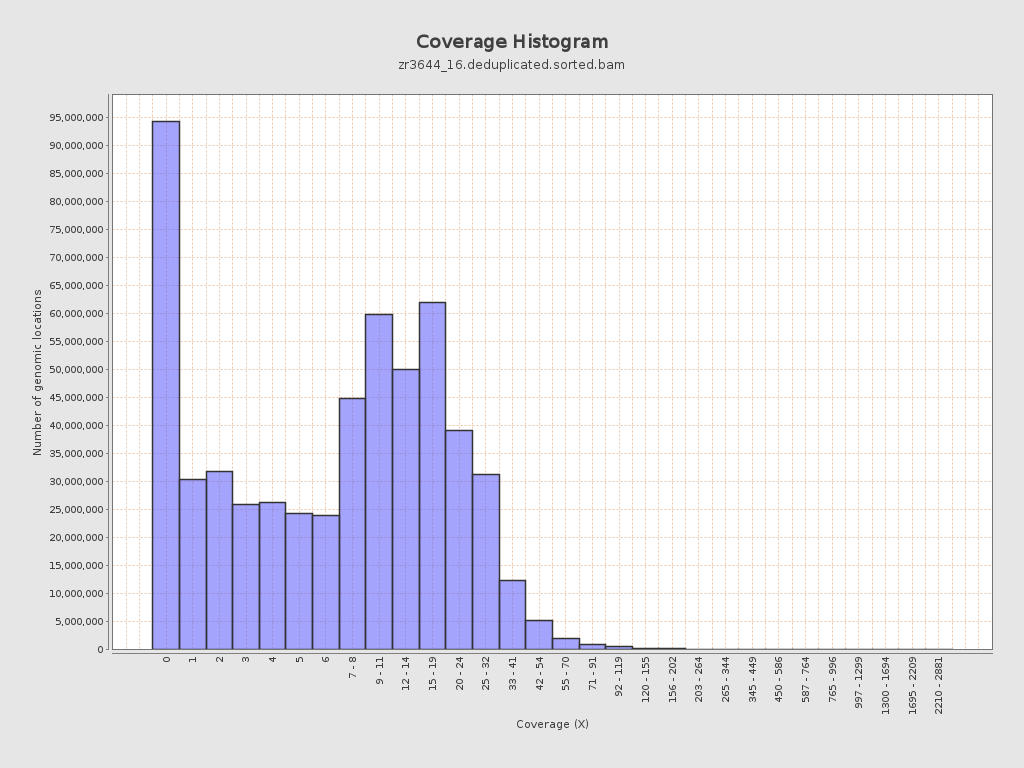
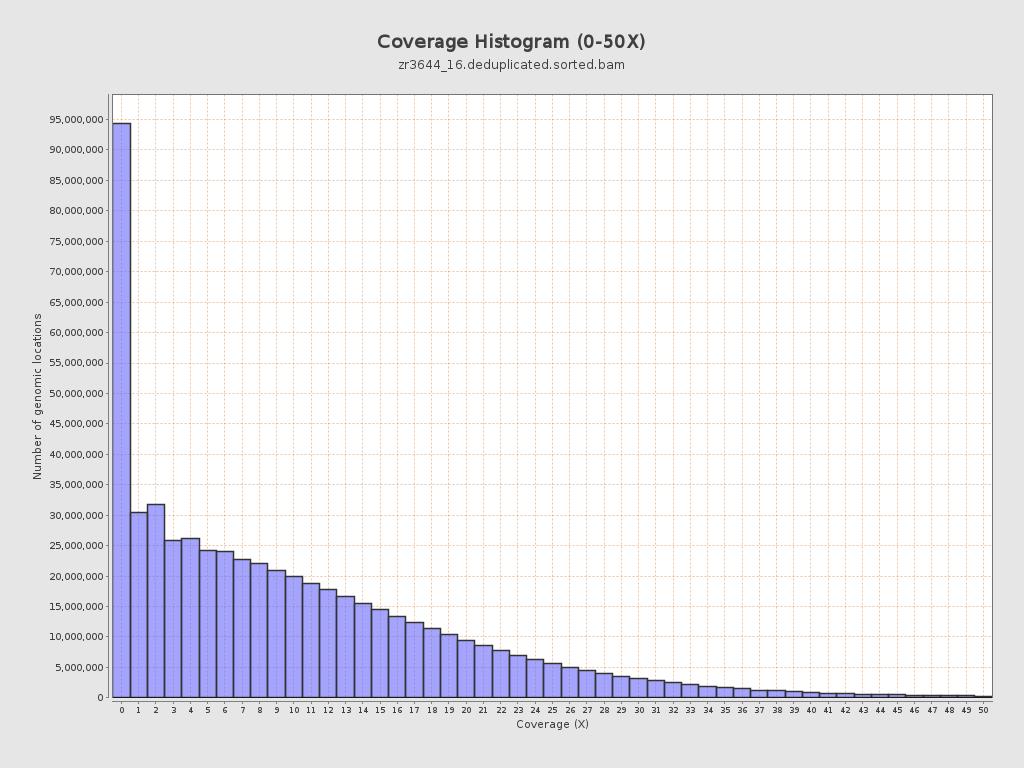
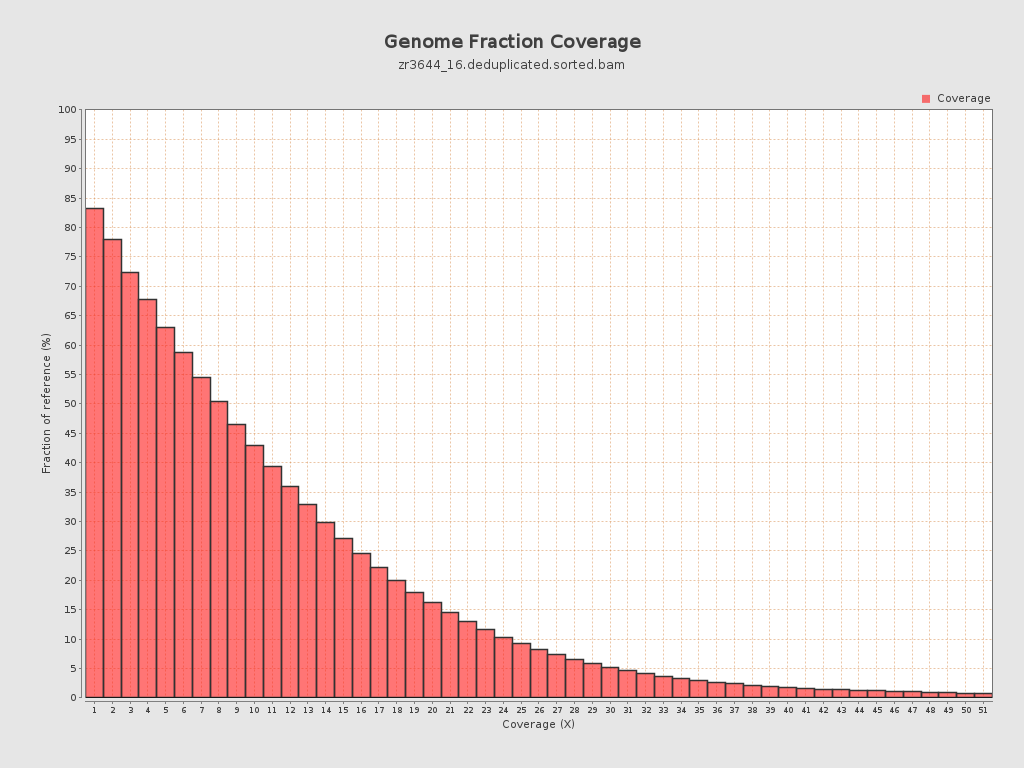
Coverage
| Mean | 10.4042 |
| Standard Deviation | 12.3671 |
| Mean (paired-end reads overlap ignored) | 7.21 |
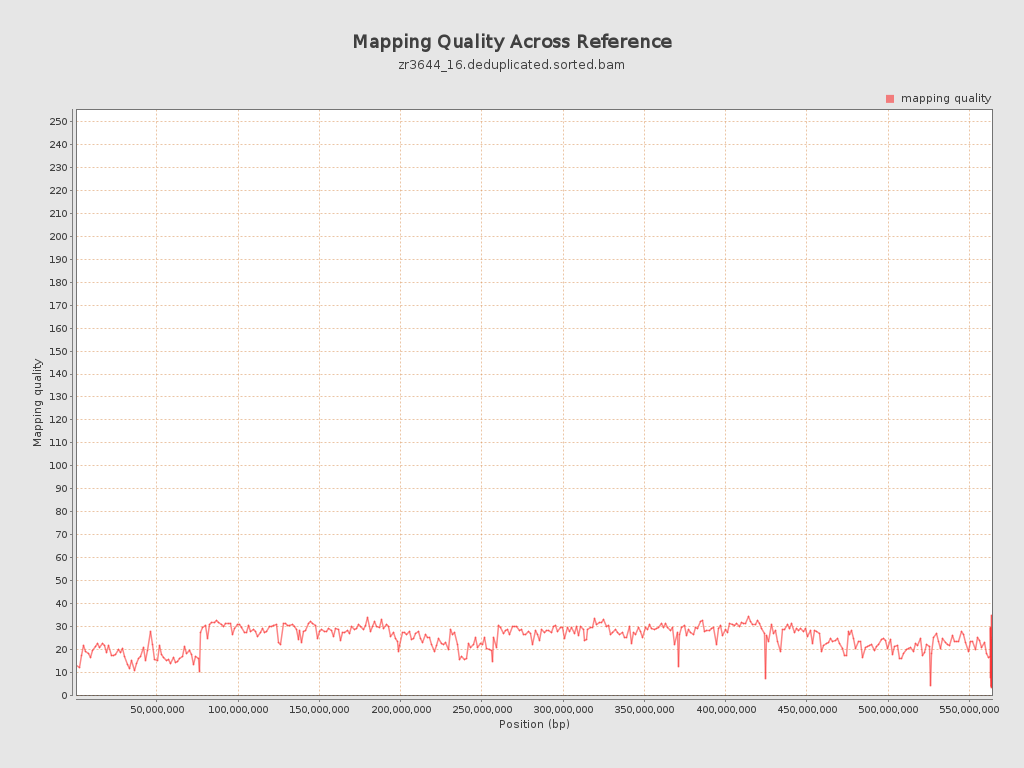
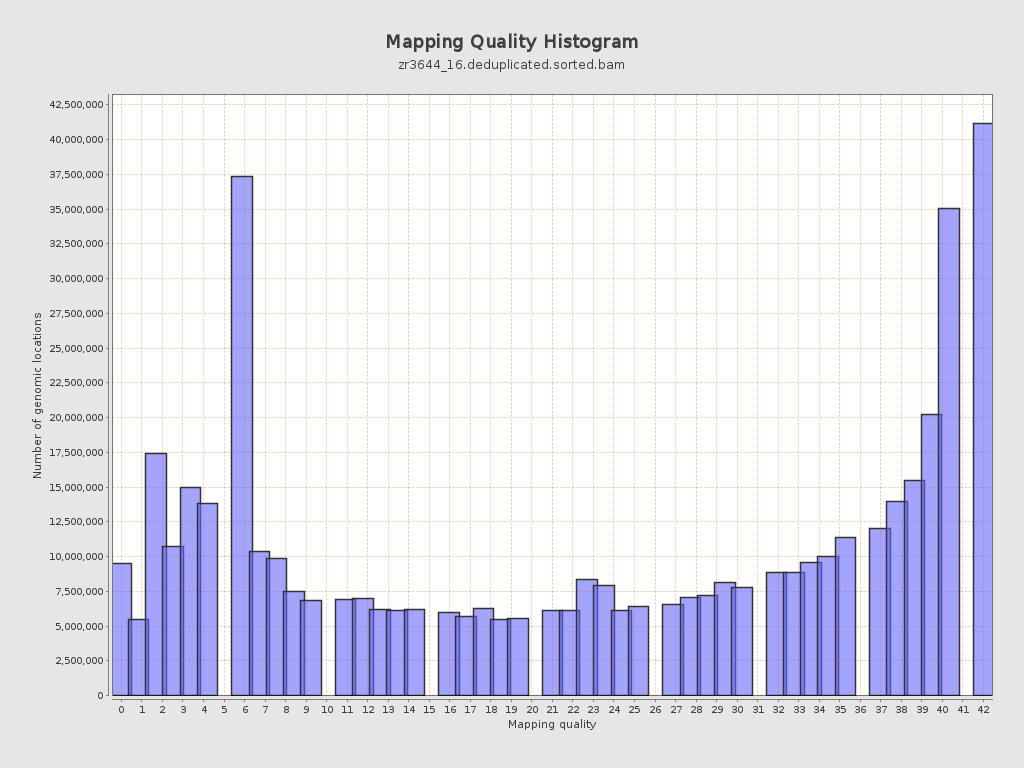
Mapping Quality
| Mean Mapping Quality | 24.65 |
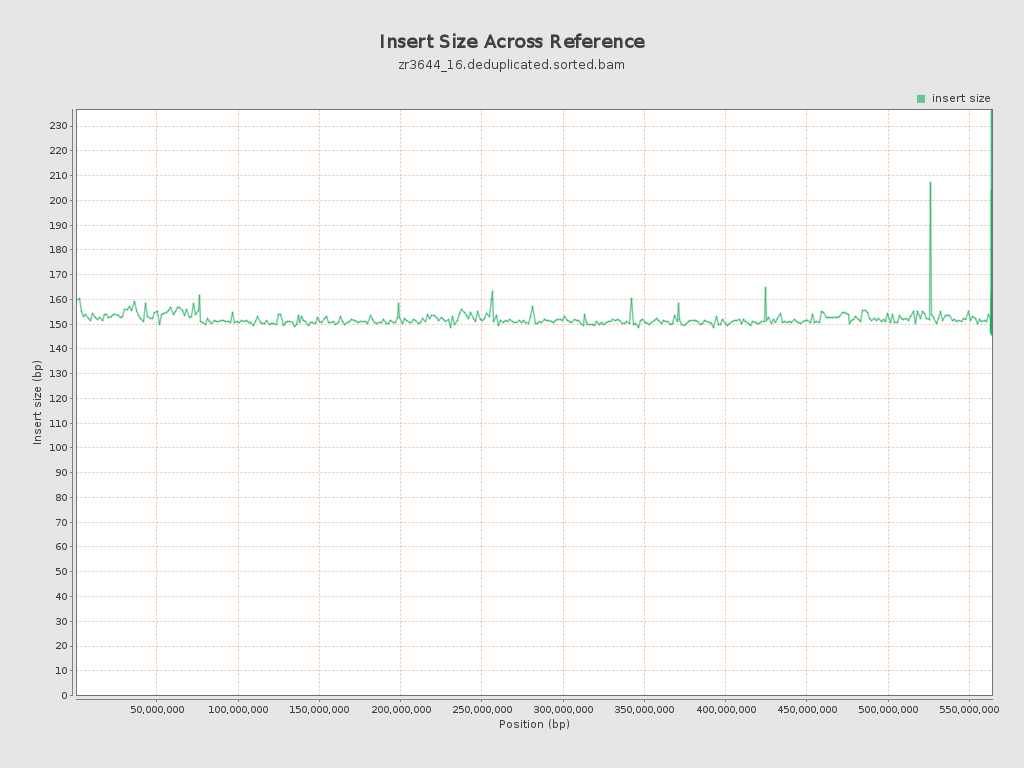
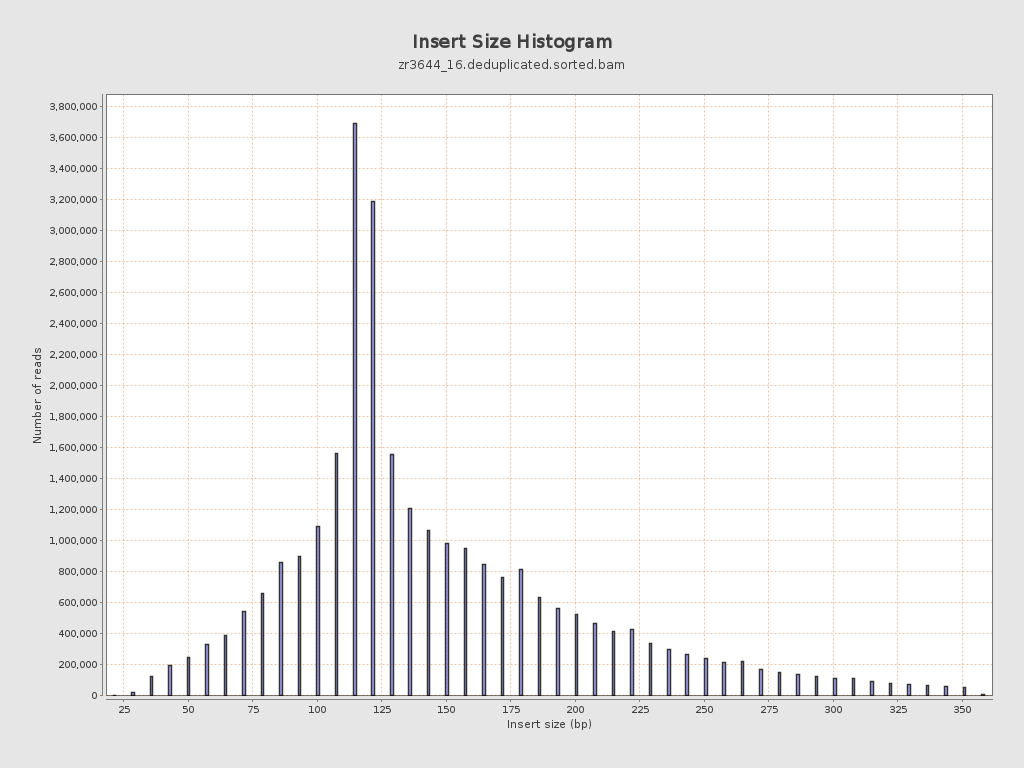
Insert size
| Mean | 151.75 |
| Standard Deviation | 65.97 |
| P25/Median/P75 | 115 / 130 / 179 |
Mismatches and indels
| General error rate | 19.54% |
| Mismatches | 1,113,920,479 |
| Insertions | 12,222,262 |
| Mapped reads with at least one insertion | 16.45% |
| Deletions | 10,800,068 |
| Mapped reads with at least one deletion | 15.86% |
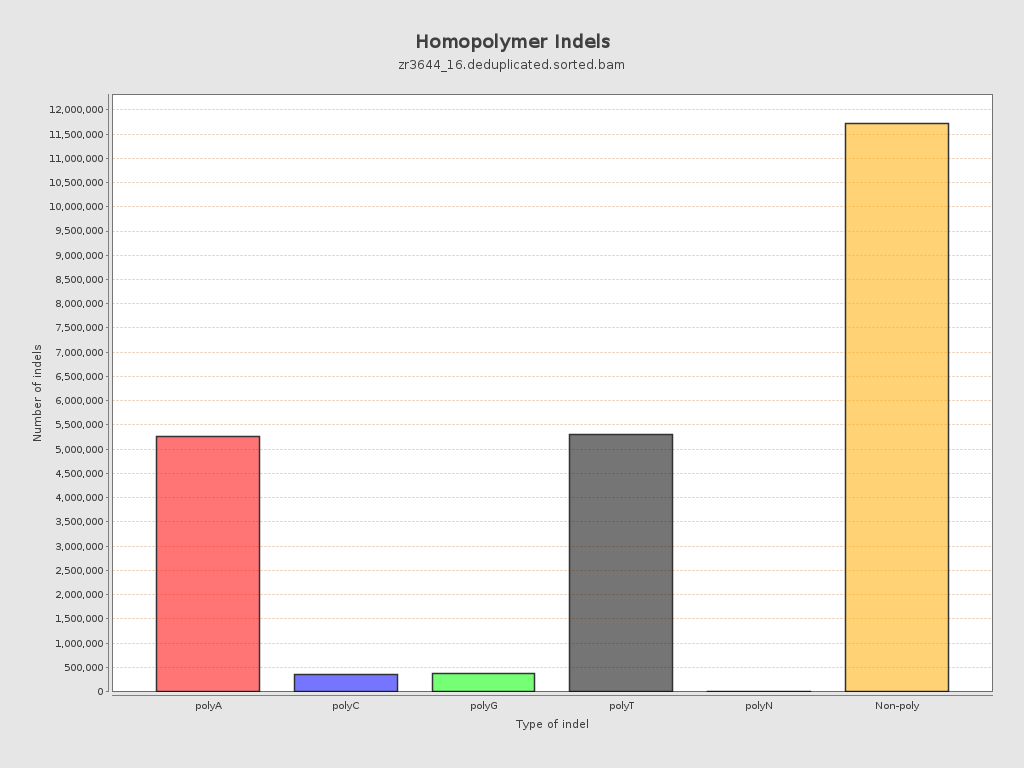
| Homopolymer indels | 49.09% |
Chromosome stats
| Name | Length | Mapped bases | Mean coverage | Standard deviation |
| NC_088853.1 | 76070991 | 591534766 | 7.7761 | 17.2443 |
| NC_088854.1 | 61469542 | 722033591 | 11.7462 | 10.8998 |
| NC_088855.1 | 61039741 | 723786080 | 11.8576 | 10.915 |
| NC_088856.1 | 57946171 | 544911686 | 9.4038 | 11.9485 |
| NC_088857.1 | 57274926 | 658486493 | 11.4969 | 11.0953 |
| NC_088858.1 | 56905015 | 678331491 | 11.9204 | 10.8194 |
| NC_088859.1 | 53672946 | 660068509 | 12.298 | 11.861 |
| NC_088860.1 | 51133819 | 540465791 | 10.5696 | 11.6852 |
| NC_088861.1 | 50364239 | 400538330 | 7.9528 | 10.763 |
| NC_088862.1 | 37310742 | 344362621 | 9.2296 | 11.6497 |
| NW_027062568.1 | 15579 | 133786 | 8.5876 | 7.9569 |
| NW_027062569.1 | 16498 | 125749 | 7.6221 | 16.0421 |
| NW_027062570.1 | 4000 | 63191 | 15.7978 | 14.7195 |
| NW_027062571.1 | 36893 | 10845 | 0.294 | 1.448 |
| NW_027062572.1 | 51000 | 30583 | 0.5997 | 1.9182 |
| NW_027062573.1 | 2000 | 45867 | 22.9335 | 12.4285 |
| NW_027062574.1 | 37061 | 4350 | 0.1174 | 0.5241 |
| NW_027062575.1 | 49428 | 412191 | 8.3392 | 16.0207 |
| NW_027062576.1 | 49232 | 181555 | 3.6877 | 7.0827 |
| NW_027062577.1 | 17087 | 156073 | 9.134 | 6.6761 |
| NW_027062578.1 | 34507 | 540939 | 15.6762 | 9.7807 |
| NW_027062579.1 | 64000 | 415588 | 6.4936 | 9.01 |
| NW_027062580.1 | 24229 | 145612 | 6.0098 | 7.9008 |
| NW_027062581.1 | 5000 | 15806 | 3.1612 | 5.7447 |
| NW_027062582.1 | 18808 | 185224 | 9.8481 | 11.2837 |
| NW_027062583.1 | 1000 | 456 | 0.456 | 0.781 |
| NW_027062584.1 | 74000 | 10794 | 0.1459 | 1.1467 |
| NW_027062585.1 | 39334 | 257195 | 6.5387 | 6.5233 |
| NW_027062586.1 | 258015 | 550028 | 2.1318 | 4.9104 |