Input data and parameters
QualiMap command line
| qualimap bamqc -bam zr3644_15.deduplicated.sorted.bam -nw 400 -hm 3 |
Alignment
| Command line: | "bismark -1 zr3644_15_R1_val_1_val_1_val_1.fq.gz -2 zr3644_15_R2_val_2_val_2_val_2.fq.gz --genome BismarkIndex --bam --score_min L,0,-0.8 --non_directional --prefix zr3644_15 --multicore 3" |
| Draw chromosome limits: | no |
| Analyze overlapping paired-end reads: | yes |
| Program: | Bismark (v0.24.2) |
| Analysis date: | Wed Apr 16 08:16:26 GMT 2025 |
| Size of a homopolymer: | 3 |
| Skip duplicate alignments: | no |
| Number of windows: | 400 |
| BAM file: | zr3644_15.deduplicated.sorted.bam |
Summary
Globals
| Reference size | 563,985,803 |
| Number of reads | 65,563,762 |
| Mapped reads | 65,563,762 / 100% |
| Unmapped reads | 0 / 0% |
| Mapped paired reads | 65,563,762 / 100% |
| Mapped reads, first in pair | 32,781,881 / 50% |
| Mapped reads, second in pair | 32,781,881 / 50% |
| Mapped reads, both in pair | 65,563,762 / 100% |
| Mapped reads, singletons | 0 / 0% |
| Secondary alignments | 0 |
| Read min/max/mean length | 20 / 115 / 105.78 |
| Overlapping read pairs | 27,603,644 / 84.2% |
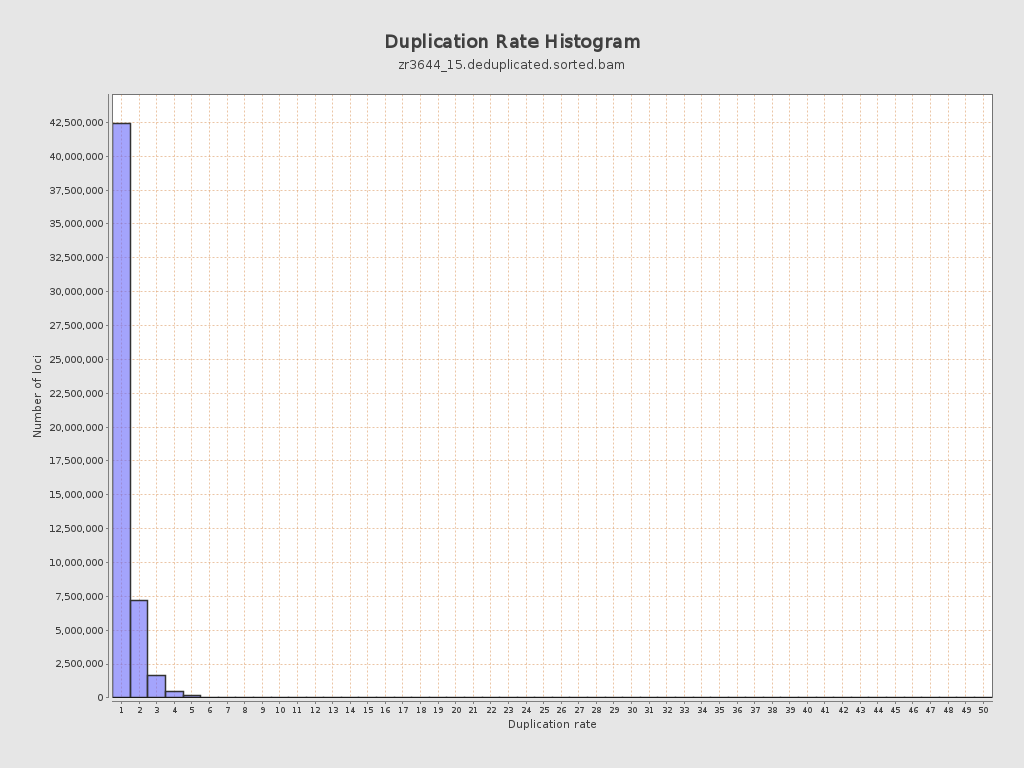
| Duplicated reads (estimated) | 13,495,363 / 20.58% |
| Duplication rate | 18.55% |
| Clipped reads | 0 / 0% |
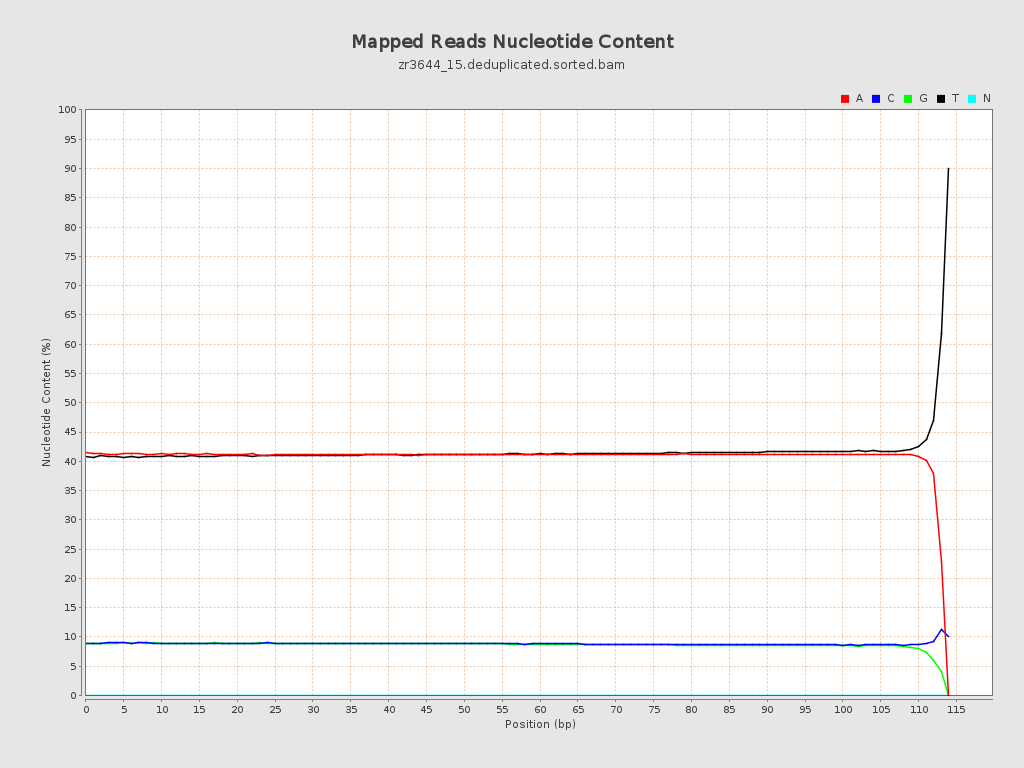
ACGT Content
| Number/percentage of A's | 2,828,264,846 / 41.02% |
| Number/percentage of C's | 609,626,441 / 8.84% |
| Number/percentage of T's | 2,856,716,037 / 41.43% |
| Number/percentage of G's | 600,796,931 / 8.71% |
| Number/percentage of N's | 51,619 / 0% |
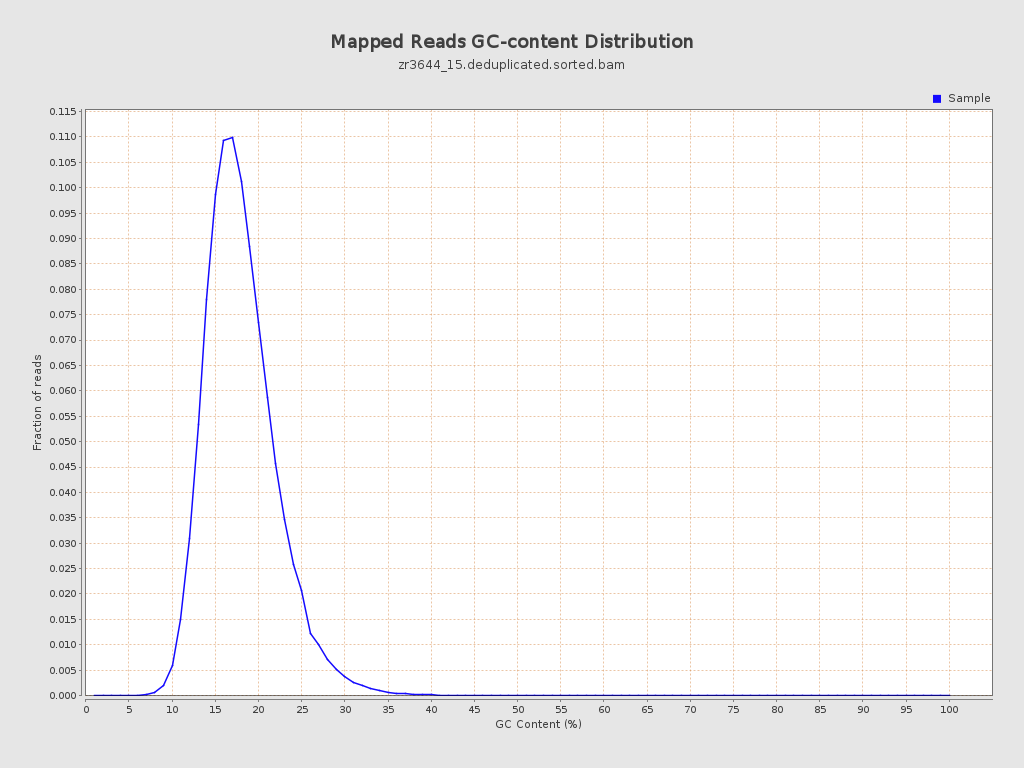
| GC Percentage | 17.55% |
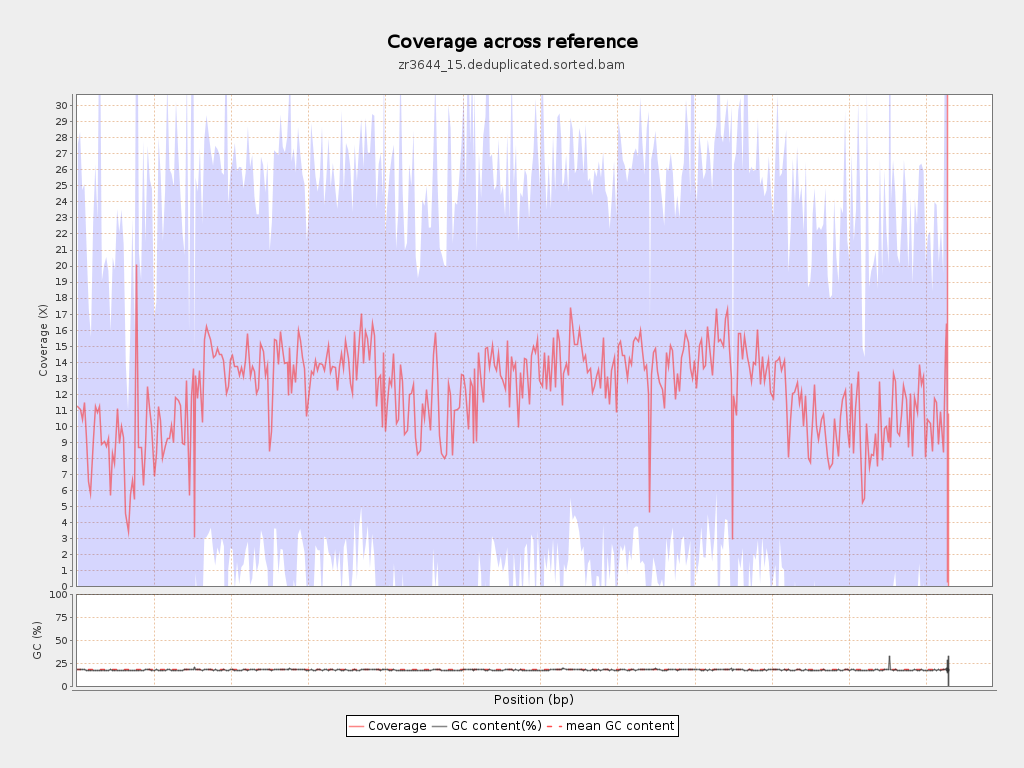
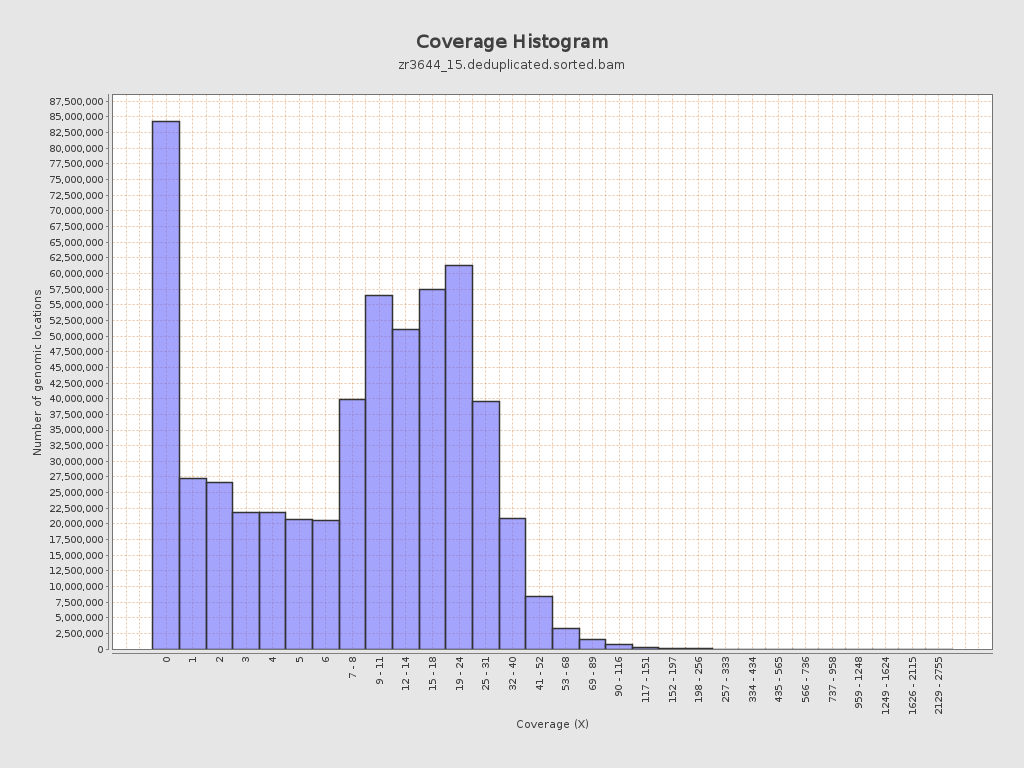
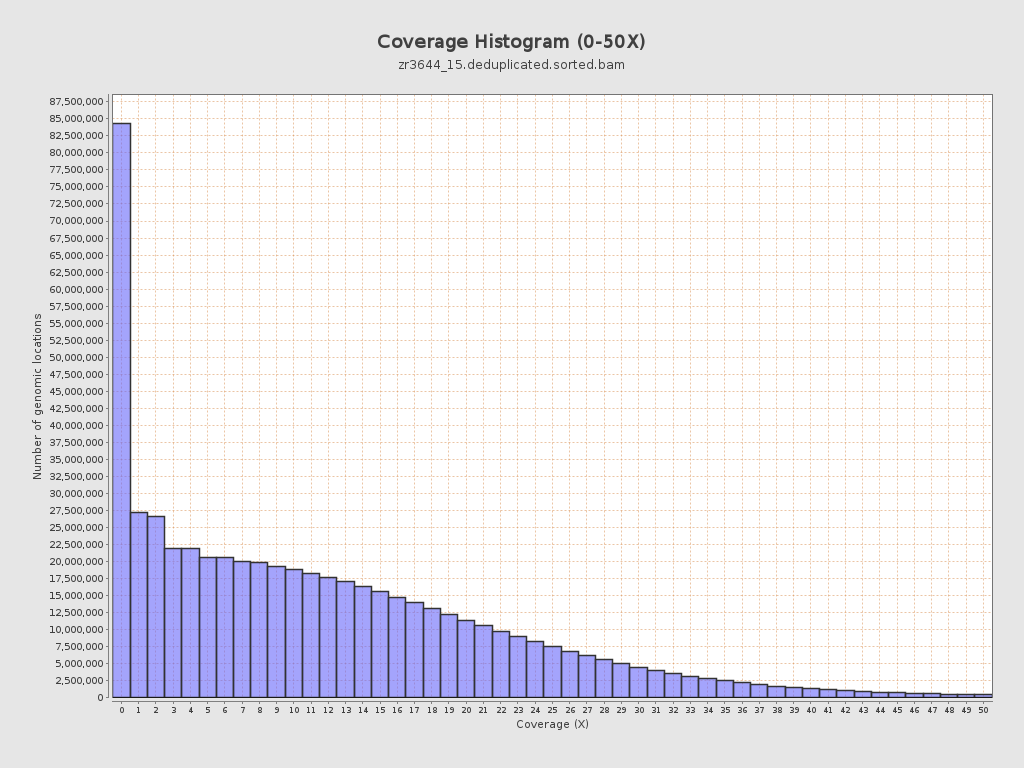
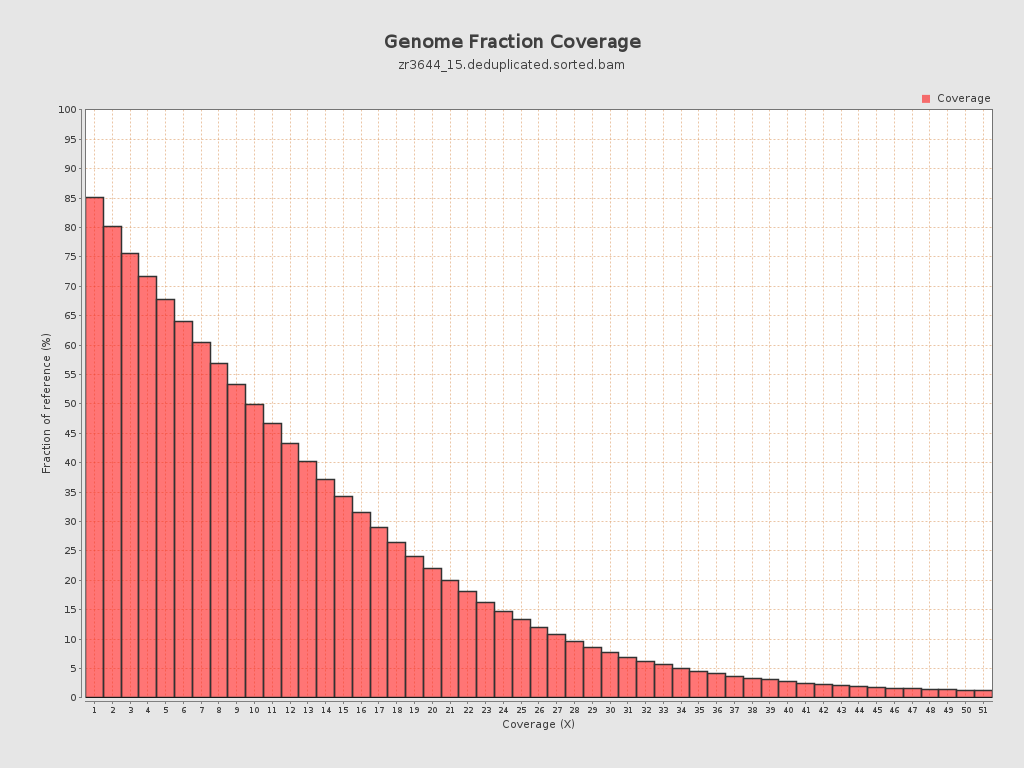
Coverage
| Mean | 12.2813 |
| Standard Deviation | 13.2218 |
| Mean (paired-end reads overlap ignored) | 8.78 |
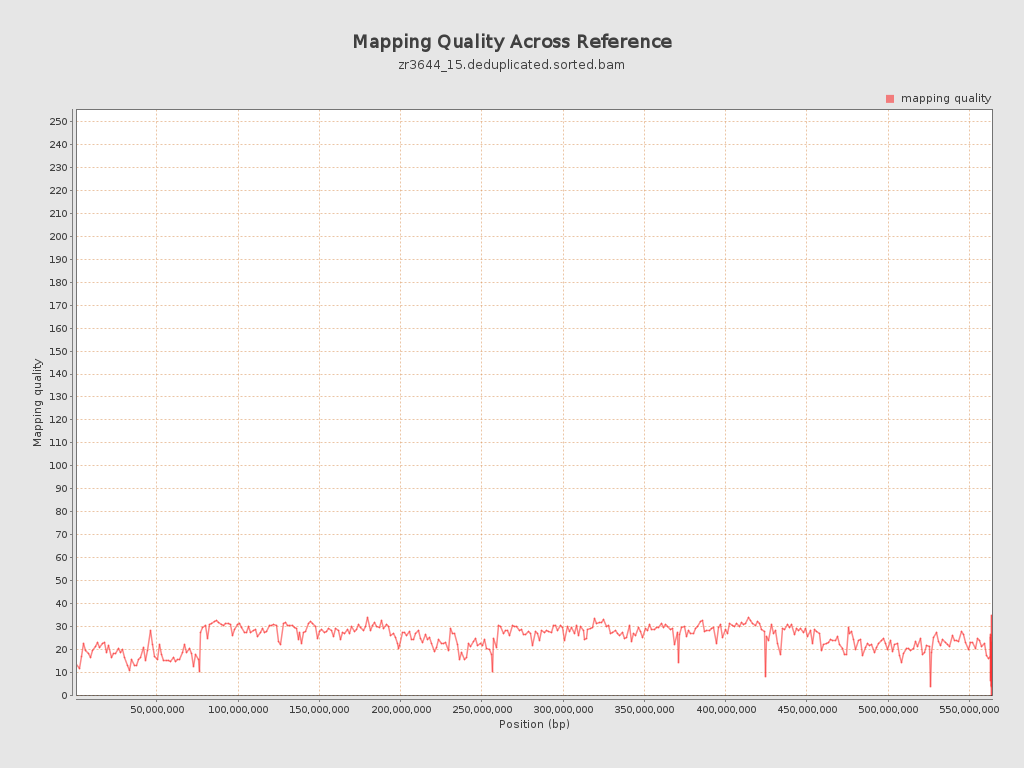
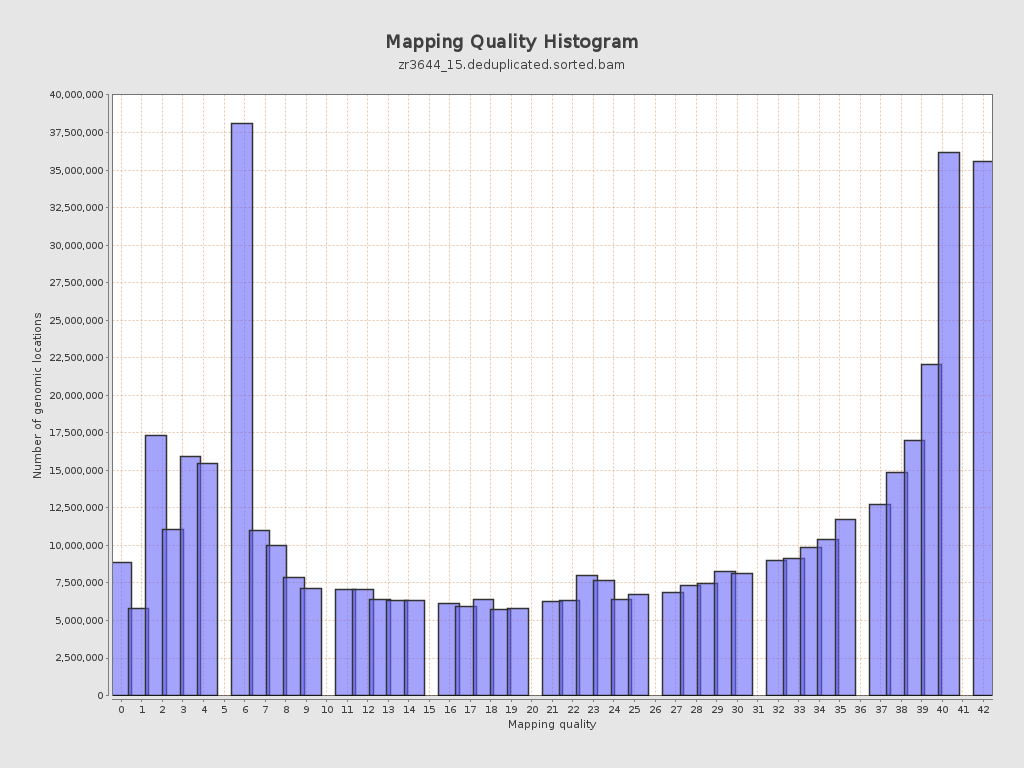
Mapping Quality
| Mean Mapping Quality | 24.65 |
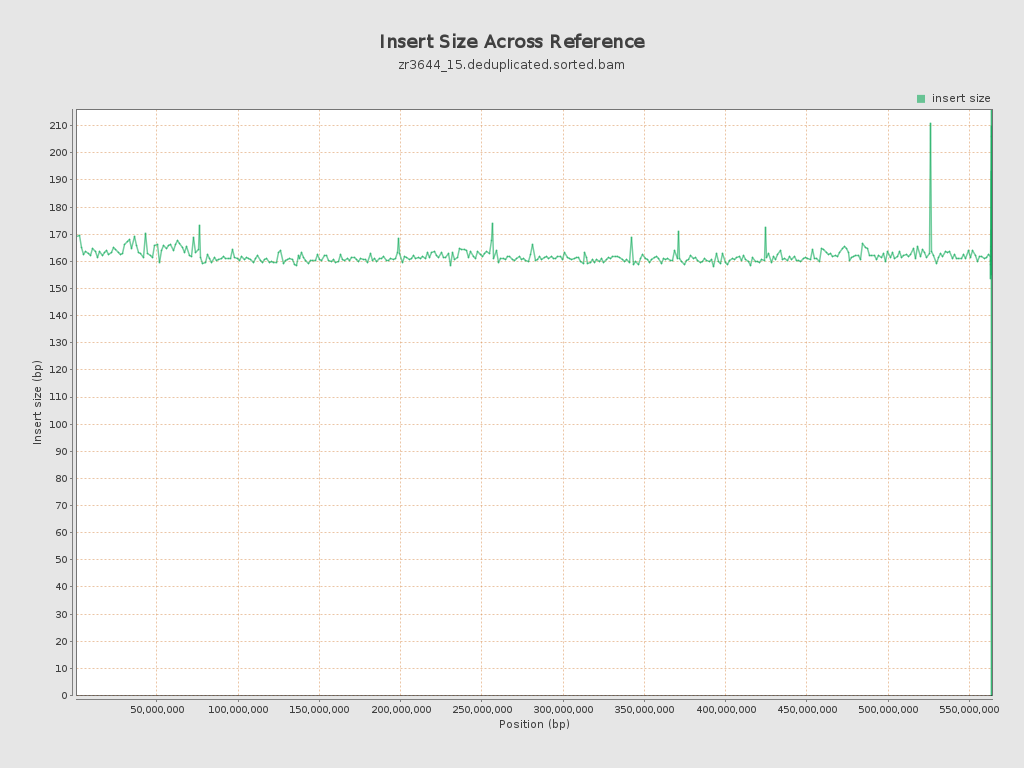
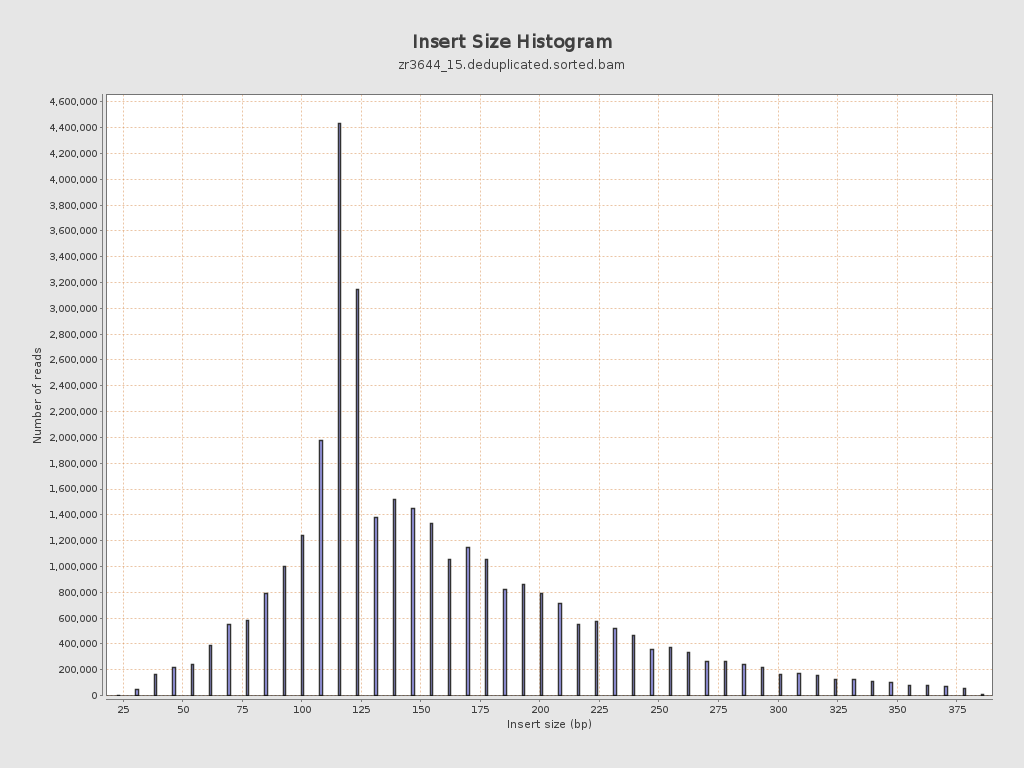
Insert size
| Mean | 161.63 |
| Standard Deviation | 71.15 |
| P25/Median/P75 | 117 / 140 / 193 |
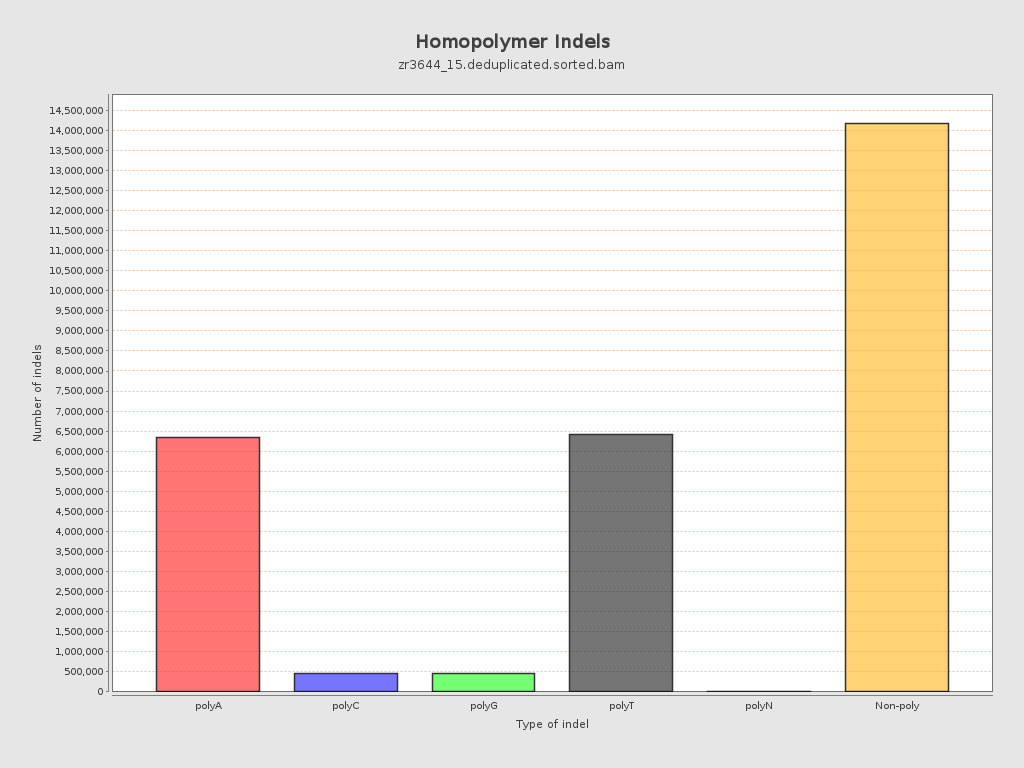
Mismatches and indels
| General error rate | 19.43% |
| Mismatches | 1,306,209,051 |
| Insertions | 14,707,122 |
| Mapped reads with at least one insertion | 16.96% |
| Deletions | 13,111,769 |
| Mapped reads with at least one deletion | 16.53% |
| Homopolymer indels | 49.02% |
Chromosome stats
| Name | Length | Mapped bases | Mean coverage | Standard deviation |
| NC_088853.1 | 76070991 | 709994315 | 9.3333 | 14.762 |
| NC_088854.1 | 61469542 | 842963832 | 13.7135 | 12.4375 |
| NC_088855.1 | 61039741 | 844712562 | 13.8387 | 12.23 |
| NC_088856.1 | 57946171 | 654372450 | 11.2928 | 13.7684 |
| NC_088857.1 | 57274926 | 772631882 | 13.4899 | 12.9488 |
| NC_088858.1 | 56905015 | 796819207 | 14.0026 | 12.1337 |
| NC_088859.1 | 53672946 | 765485993 | 14.262 | 13.1383 |
| NC_088860.1 | 51133819 | 648701843 | 12.6864 | 13.0296 |
| NC_088861.1 | 50364239 | 477591467 | 9.4827 | 12.7517 |
| NC_088862.1 | 37310742 | 408782273 | 10.9562 | 12.908 |
| NW_027062568.1 | 15579 | 142162 | 9.1252 | 8.4545 |
| NW_027062569.1 | 16498 | 130849 | 7.9312 | 13.8835 |
| NW_027062570.1 | 4000 | 264933 | 66.2332 | 57.0733 |
| NW_027062571.1 | 36893 | 7994 | 0.2167 | 0.8634 |
| NW_027062572.1 | 51000 | 43367 | 0.8503 | 1.9447 |
| NW_027062573.1 | 2000 | 136256 | 68.128 | 60.8677 |
| NW_027062574.1 | 37061 | 8753 | 0.2362 | 0.8551 |
| NW_027062575.1 | 49428 | 375125 | 7.5893 | 14.7816 |
| NW_027062576.1 | 49232 | 225140 | 4.573 | 9.8008 |
| NW_027062577.1 | 17087 | 180755 | 10.5785 | 7.8185 |
| NW_027062578.1 | 34507 | 641154 | 18.5804 | 10.4452 |
| NW_027062579.1 | 64000 | 632607 | 9.8845 | 11.4551 |
| NW_027062580.1 | 24229 | 222557 | 9.1856 | 10.6289 |
| NW_027062581.1 | 5000 | 52150 | 10.43 | 12.6397 |
| NW_027062582.1 | 18808 | 203342 | 10.8115 | 11.4083 |
| NW_027062583.1 | 1000 | 0 | 0 | 0 |
| NW_027062584.1 | 74000 | 20620 | 0.2786 | 1.4497 |
| NW_027062585.1 | 39334 | 331078 | 8.4171 | 7.6646 |
| NW_027062586.1 | 258015 | 782073 | 3.0311 | 6.7753 |