Input data and parameters
QualiMap command line
| qualimap bamqc -bam zr3644_14.deduplicated.sorted.bam -nw 400 -hm 3 |
Alignment
| Command line: | "bismark -1 zr3644_14_R1_val_1_val_1_val_1.fq.gz -2 zr3644_14_R2_val_2_val_2_val_2.fq.gz --genome BismarkIndex --bam --score_min L,0,-0.8 --non_directional --prefix zr3644_14 --multicore 3" |
| Draw chromosome limits: | no |
| Analyze overlapping paired-end reads: | yes |
| Program: | Bismark (v0.24.2) |
| Analysis date: | Wed Apr 16 03:38:34 GMT 2025 |
| Size of a homopolymer: | 3 |
| Skip duplicate alignments: | no |
| Number of windows: | 400 |
| BAM file: | zr3644_14.deduplicated.sorted.bam |
Summary
Globals
| Reference size | 563,985,803 |
| Number of reads | 41,476,432 |
| Mapped reads | 41,476,432 / 100% |
| Unmapped reads | 0 / 0% |
| Mapped paired reads | 41,476,432 / 100% |
| Mapped reads, first in pair | 20,738,216 / 50% |
| Mapped reads, second in pair | 20,738,216 / 50% |
| Mapped reads, both in pair | 41,476,432 / 100% |
| Mapped reads, singletons | 0 / 0% |
| Secondary alignments | 0 |
| Read min/max/mean length | 20 / 115 / 105.53 |
| Overlapping read pairs | 17,489,279 / 84.33% |
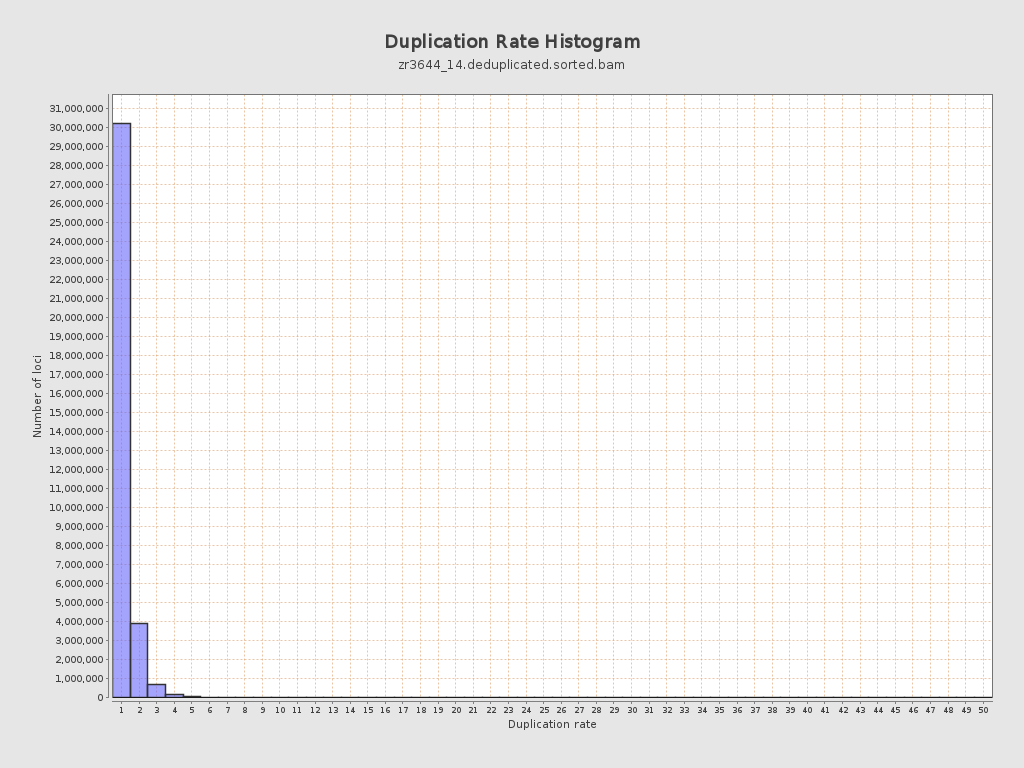
| Duplicated reads (estimated) | 6,358,734 / 15.33% |
| Duplication rate | 13.95% |
| Clipped reads | 0 / 0% |
ACGT Content
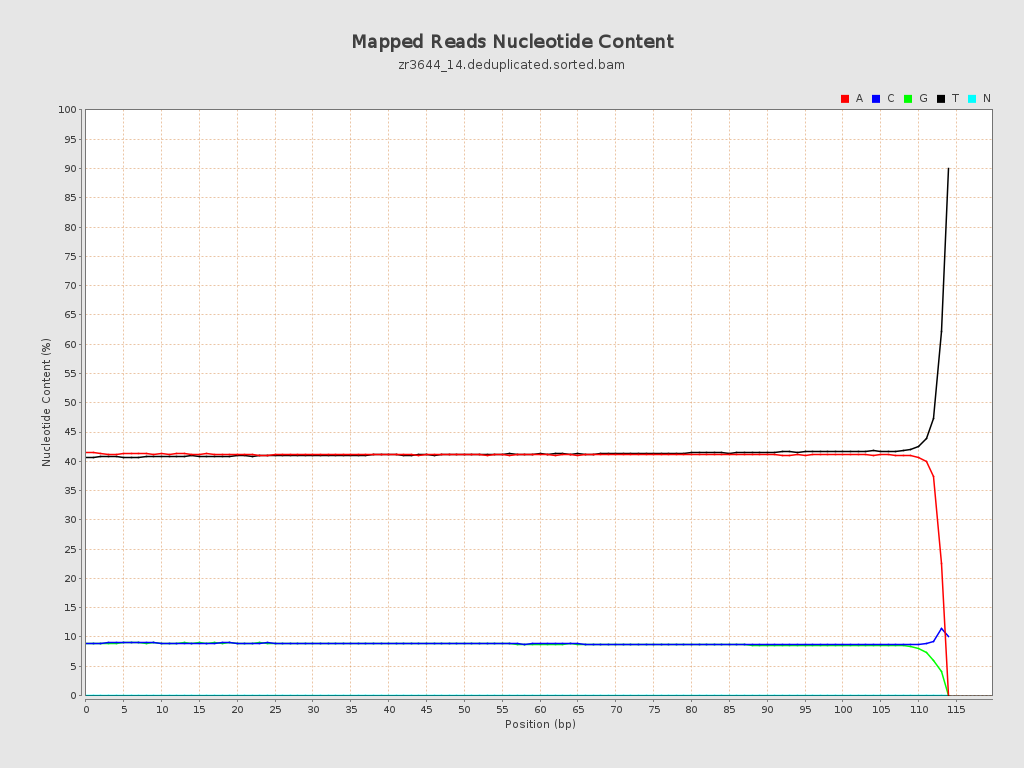
| Number/percentage of A's | 1,784,136,208 / 40.99% |
| Number/percentage of C's | 385,667,282 / 8.86% |
| Number/percentage of T's | 1,801,755,359 / 41.4% |
| Number/percentage of G's | 380,595,476 / 8.74% |
| Number/percentage of N's | 30,717 / 0% |
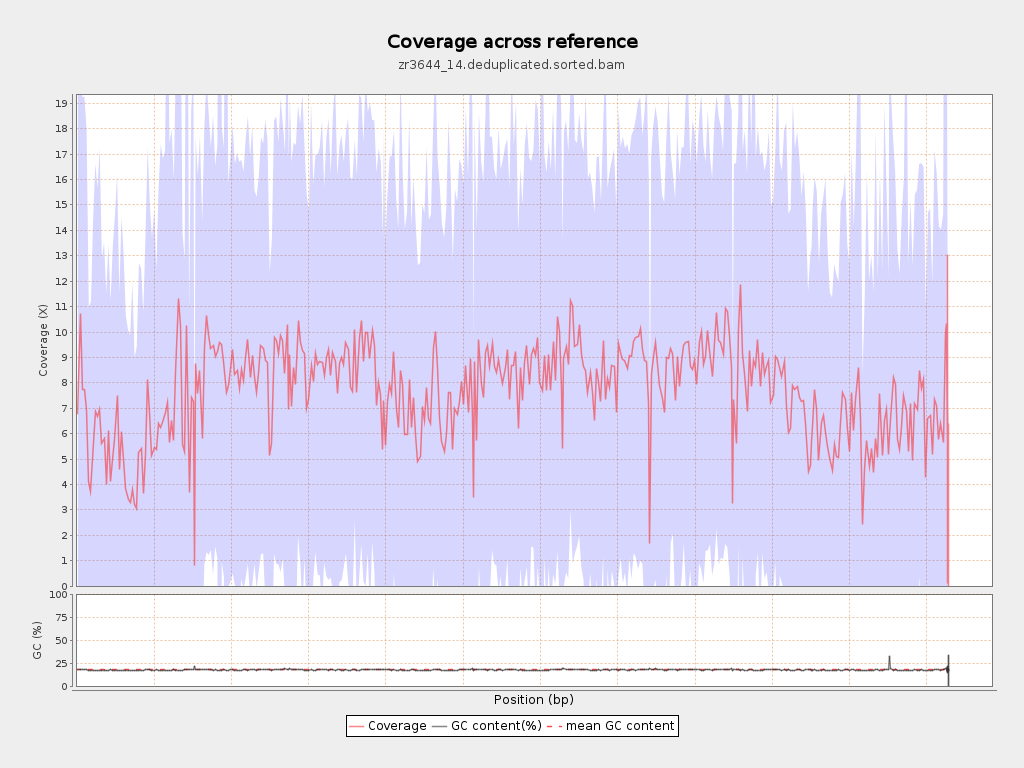
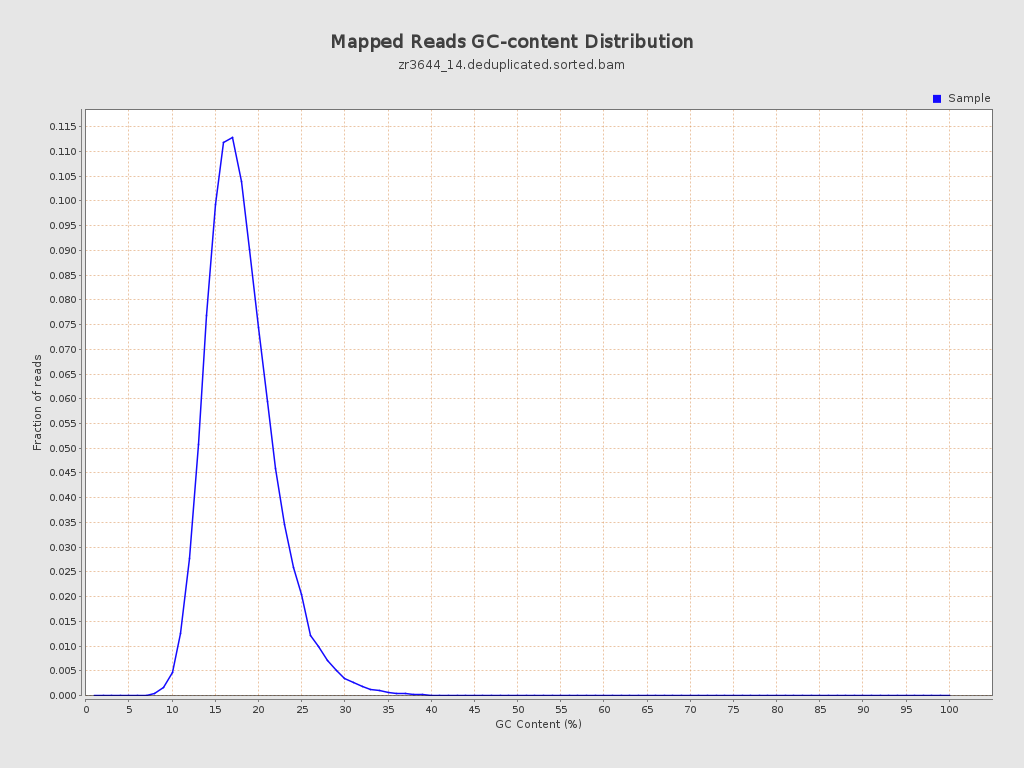
| GC Percentage | 17.61% |
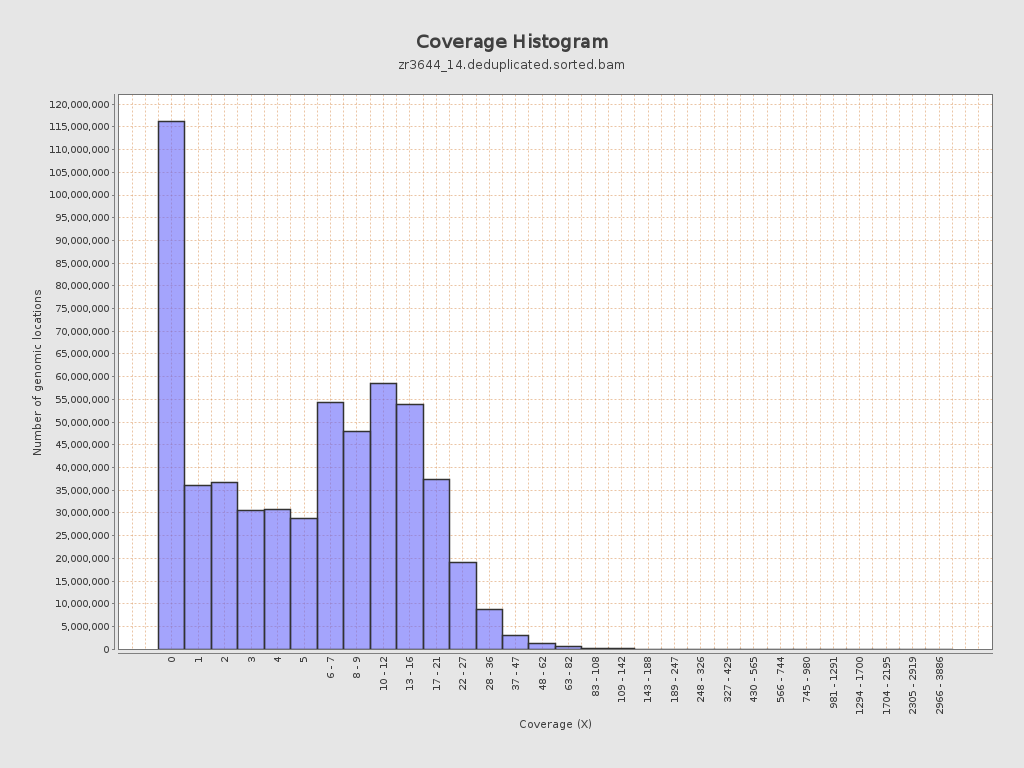
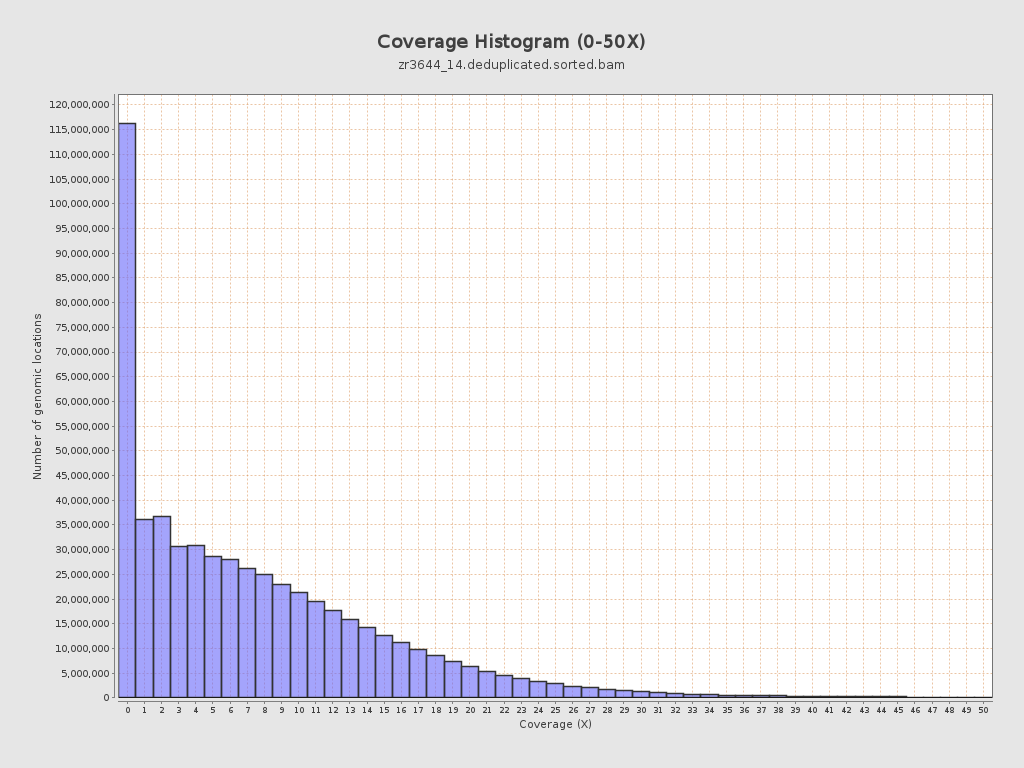
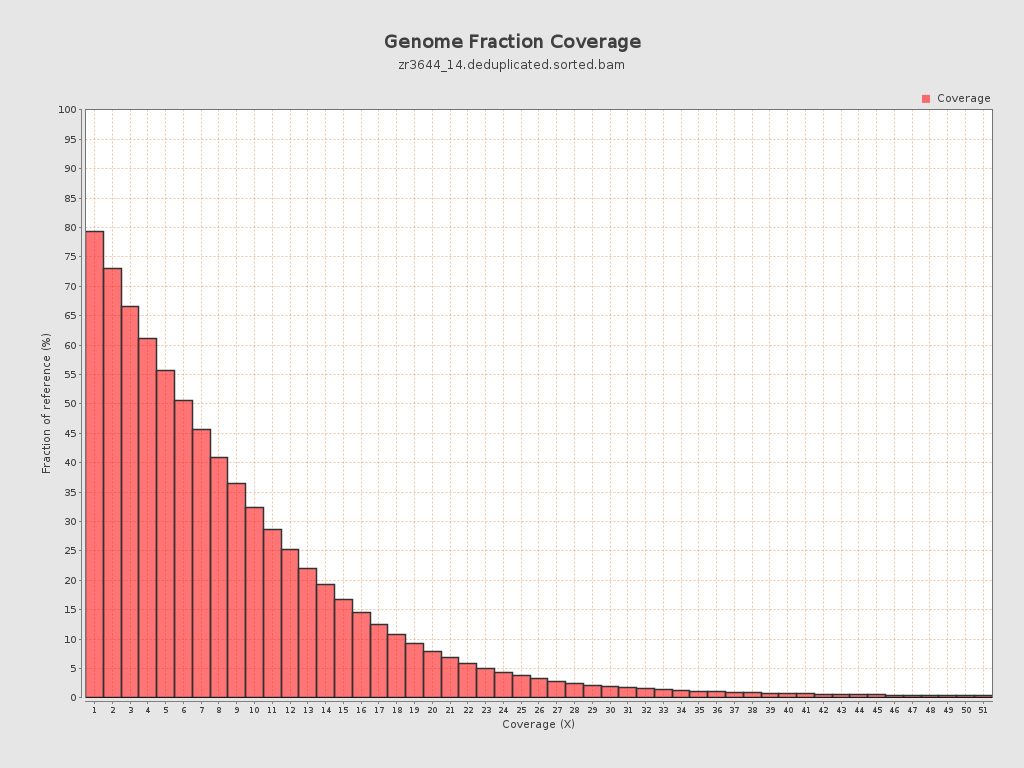
Coverage
| Mean | 7.7511 |
| Standard Deviation | 9.1514 |
| Mean (paired-end reads overlap ignored) | 5.53 |
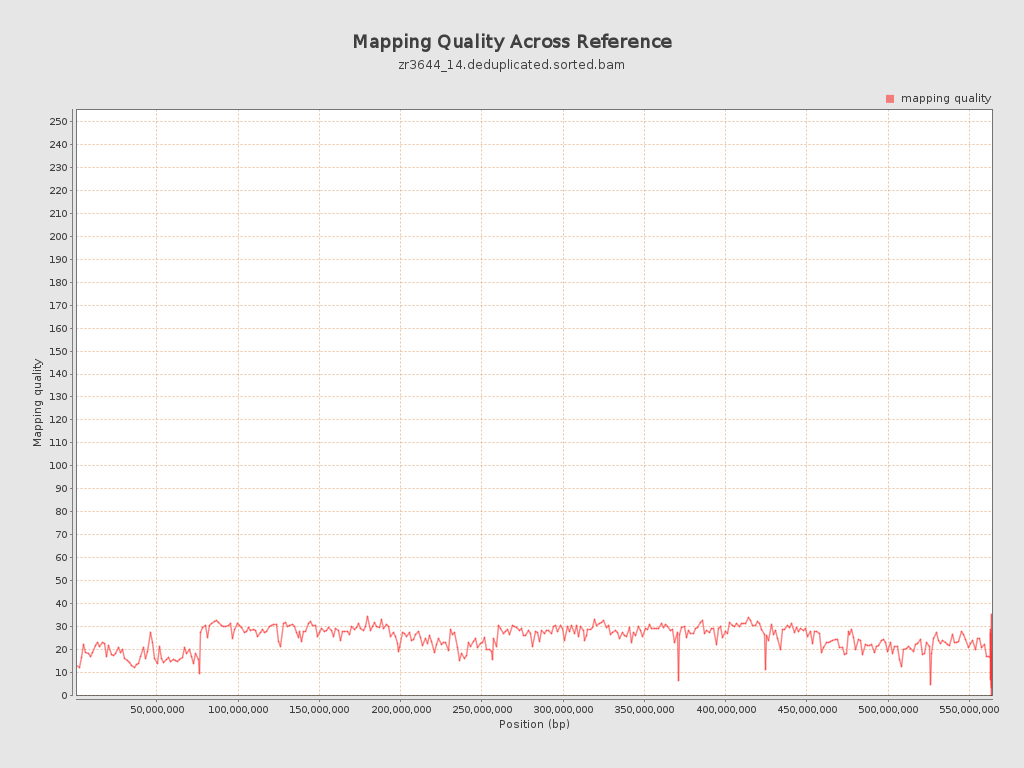
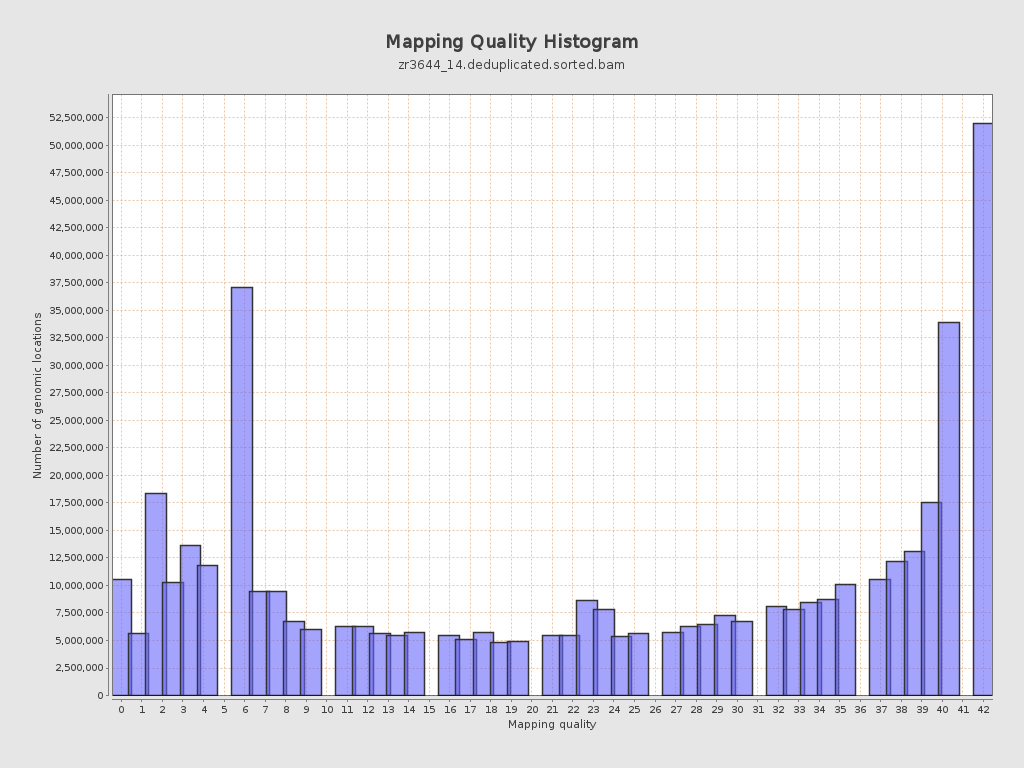
Mapping Quality
| Mean Mapping Quality | 24.58 |
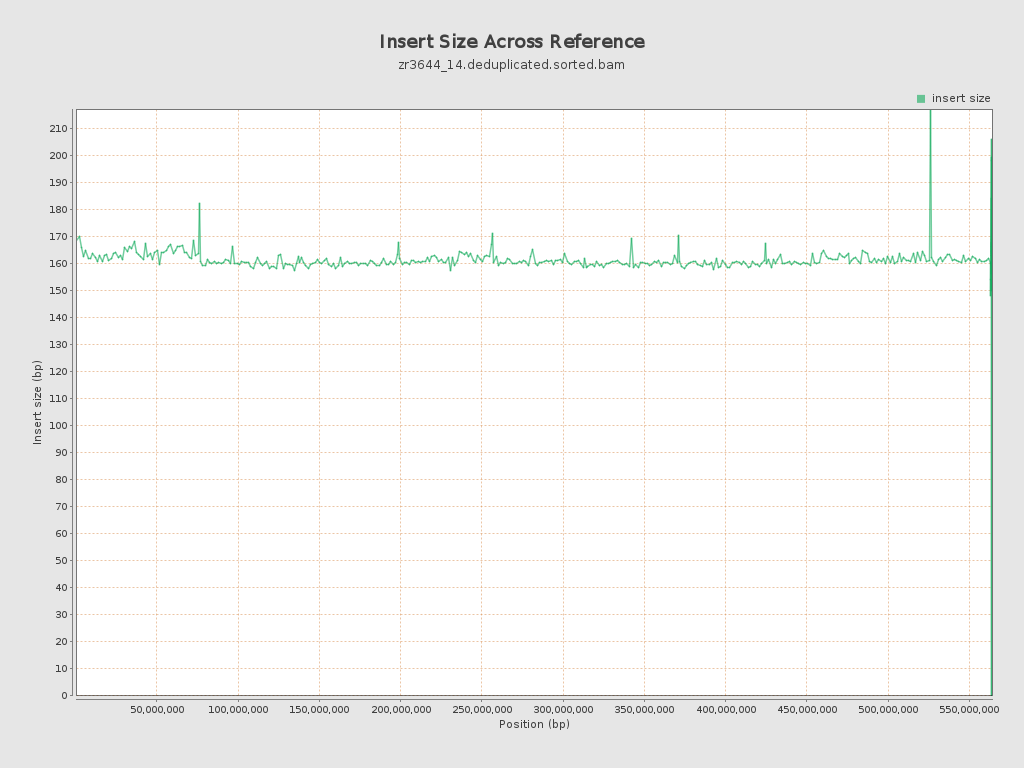
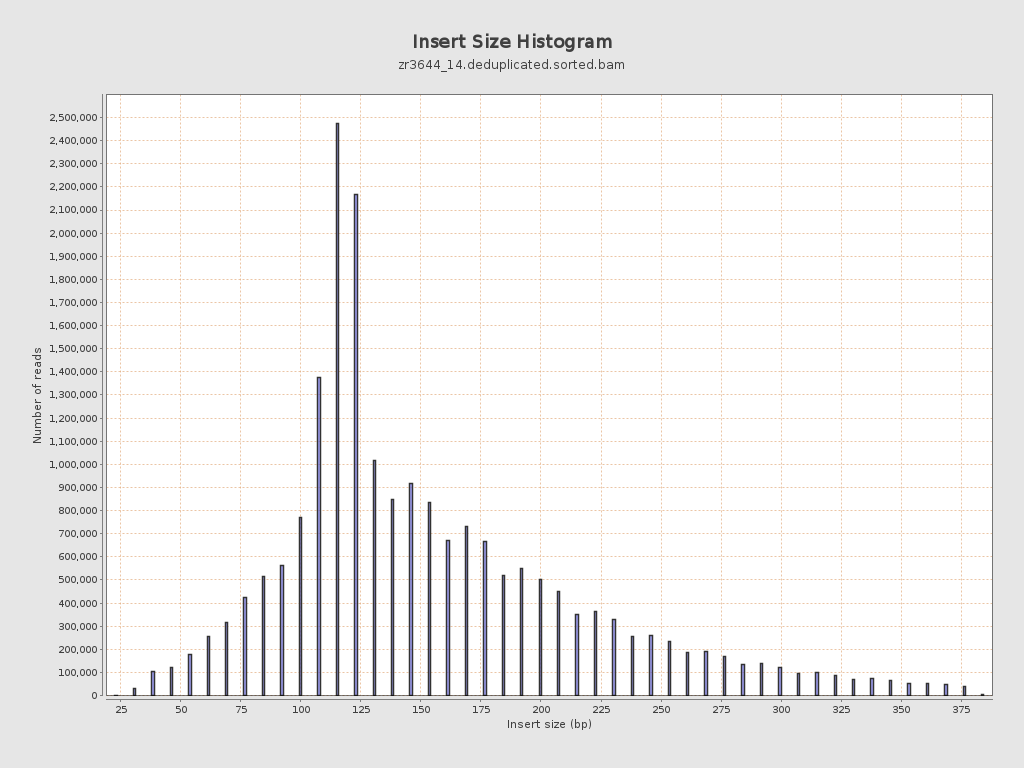
Insert size
| Mean | 161.01 |
| Standard Deviation | 71.2 |
| P25/Median/P75 | 117 / 139 / 192 |
Mismatches and indels
| General error rate | 19.46% |
| Mismatches | 825,828,598 |
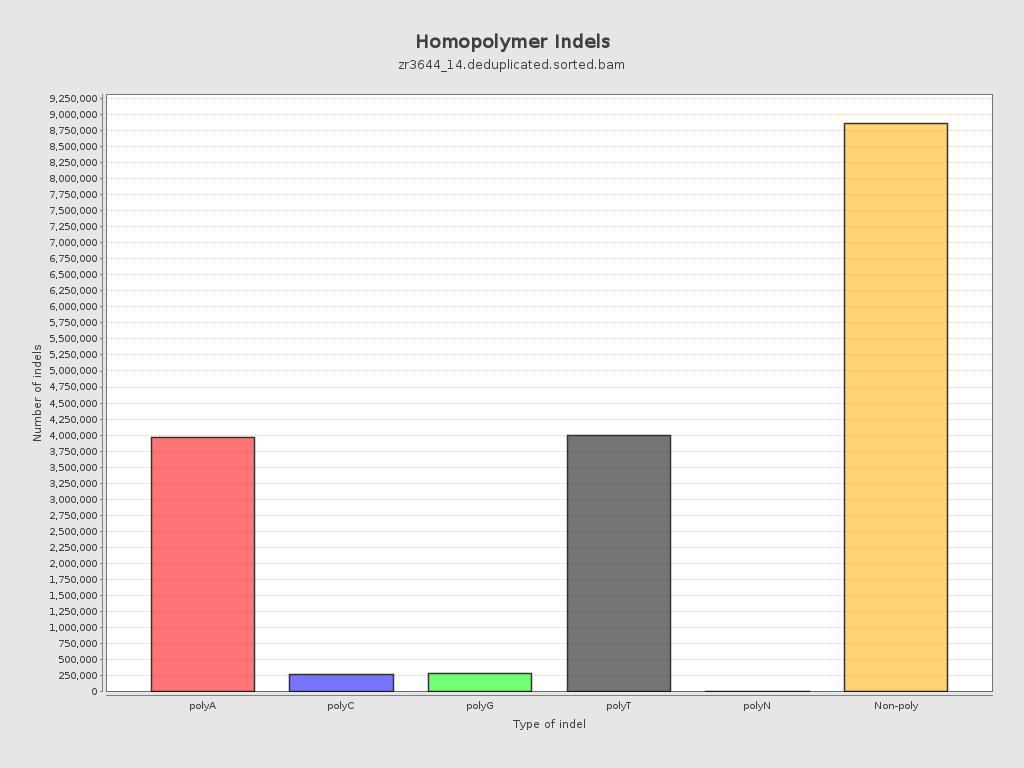
| Insertions | 9,170,651 |
| Mapped reads with at least one insertion | 16.77% |
| Deletions | 8,192,534 |
| Mapped reads with at least one deletion | 16.35% |
| Homopolymer indels | 48.95% |
Chromosome stats
| Name | Length | Mapped bases | Mean coverage | Standard deviation |
| NC_088853.1 | 76070991 | 457945471 | 6.02 | 10.1478 |
| NC_088854.1 | 61469542 | 533524983 | 8.6795 | 9.4594 |
| NC_088855.1 | 61039741 | 530967936 | 8.6987 | 8.3764 |
| NC_088856.1 | 57946171 | 411165770 | 7.0957 | 8.6667 |
| NC_088857.1 | 57274926 | 491603133 | 8.5832 | 8.6974 |
| NC_088858.1 | 56905015 | 500135993 | 8.789 | 8.3579 |
| NC_088859.1 | 53672946 | 484779961 | 9.0321 | 8.1949 |
| NC_088860.1 | 51133819 | 404676686 | 7.9141 | 9.2972 |
| NC_088861.1 | 50364239 | 300351171 | 5.9636 | 8.4299 |
| NC_088862.1 | 37310742 | 254182247 | 6.8126 | 11.0539 |
| NW_027062568.1 | 15579 | 85749 | 5.5041 | 6.2862 |
| NW_027062569.1 | 16498 | 42580 | 2.5809 | 5.8745 |
| NW_027062570.1 | 4000 | 29802 | 7.4505 | 6.6571 |
| NW_027062571.1 | 36893 | 5016 | 0.136 | 0.6627 |
| NW_027062572.1 | 51000 | 11807 | 0.2315 | 0.7318 |
| NW_027062573.1 | 2000 | 26085 | 13.0425 | 9.1221 |
| NW_027062574.1 | 37061 | 3517 | 0.0949 | 0.3722 |
| NW_027062575.1 | 49428 | 201022 | 4.067 | 7.0928 |
| NW_027062576.1 | 49232 | 148741 | 3.0212 | 6.198 |
| NW_027062577.1 | 17087 | 96270 | 5.6341 | 5.3217 |
| NW_027062578.1 | 34507 | 426106 | 12.3484 | 7.7468 |
| NW_027062579.1 | 64000 | 209269 | 3.2698 | 6.7608 |
| NW_027062580.1 | 24229 | 175881 | 7.2591 | 8.5457 |
| NW_027062581.1 | 5000 | 21694 | 4.3388 | 6.8019 |
| NW_027062582.1 | 18808 | 120487 | 6.4062 | 6.3531 |
| NW_027062583.1 | 1000 | 0 | 0 | 0 |
| NW_027062584.1 | 74000 | 7394 | 0.0999 | 0.6342 |
| NW_027062585.1 | 39334 | 204113 | 5.1892 | 5.7567 |
| NW_027062586.1 | 258015 | 380210 | 1.4736 | 6.6657 |