Input data and parameters
QualiMap command line
| qualimap bamqc -bam zr3644_13.deduplicated.sorted.bam -nw 400 -hm 3 |
Alignment
| Command line: | "bismark -1 zr3644_13_R1_val_1_val_1_val_1.fq.gz -2 zr3644_13_R2_val_2_val_2_val_2.fq.gz --genome BismarkIndex --bam --score_min L,0,-0.8 --non_directional --prefix zr3644_13 --multicore 3" |
| Draw chromosome limits: | no |
| Analyze overlapping paired-end reads: | yes |
| Program: | Bismark (v0.24.2) |
| Analysis date: | Wed Apr 16 07:55:50 GMT 2025 |
| Size of a homopolymer: | 3 |
| Skip duplicate alignments: | no |
| Number of windows: | 400 |
| BAM file: | zr3644_13.deduplicated.sorted.bam |
Summary
Globals
| Reference size | 563,985,803 |
| Number of reads | 59,496,470 |
| Mapped reads | 59,496,470 / 100% |
| Unmapped reads | 0 / 0% |
| Mapped paired reads | 59,496,470 / 100% |
| Mapped reads, first in pair | 29,748,235 / 50% |
| Mapped reads, second in pair | 29,748,235 / 50% |
| Mapped reads, both in pair | 59,496,470 / 100% |
| Mapped reads, singletons | 0 / 0% |
| Secondary alignments | 0 |
| Read min/max/mean length | 20 / 115 / 106.21 |
| Overlapping read pairs | 24,701,129 / 83.03% |
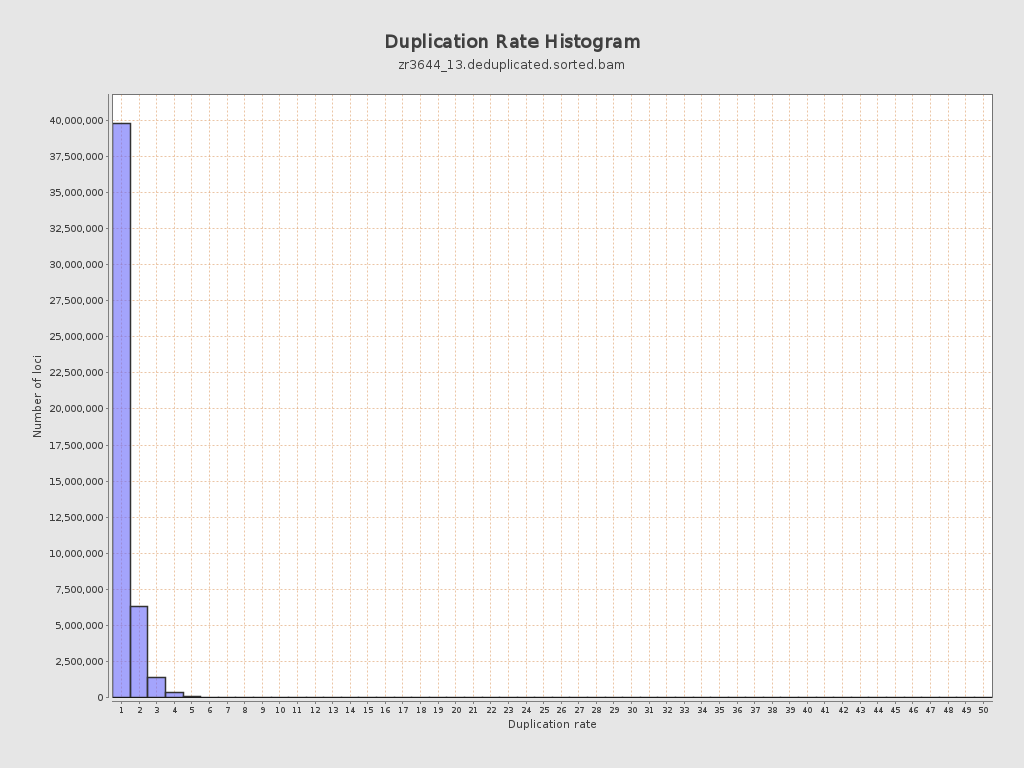
| Duplicated reads (estimated) | 11,412,608 / 19.18% |
| Duplication rate | 17.33% |
| Clipped reads | 0 / 0% |
ACGT Content
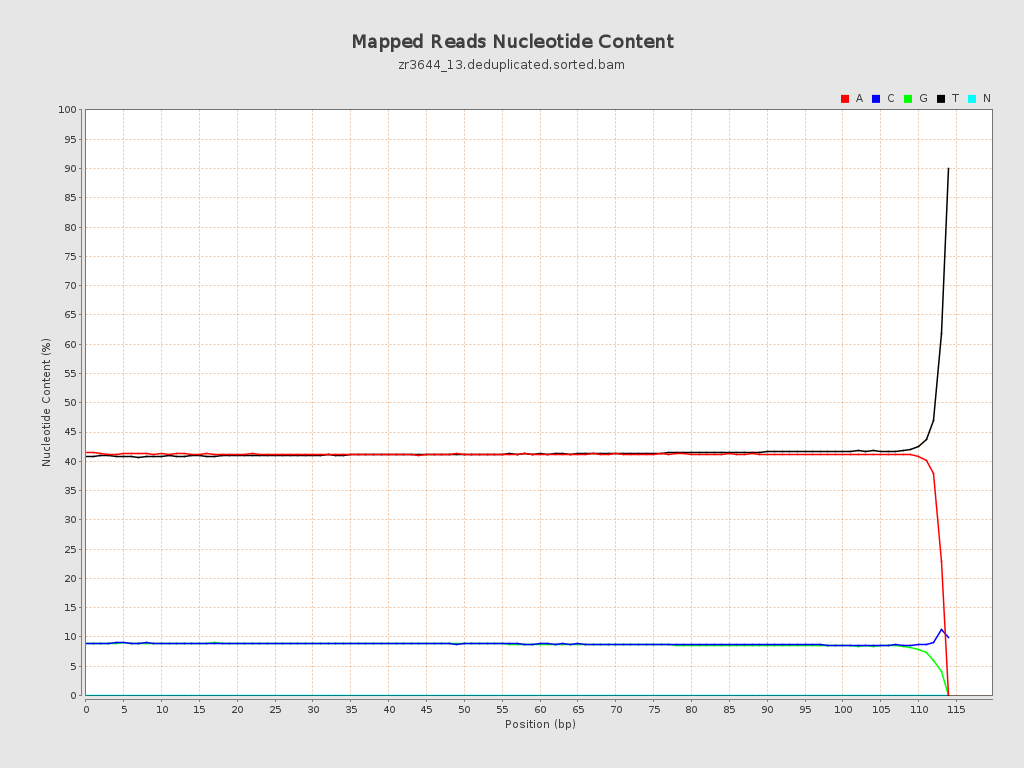
| Number/percentage of A's | 2,578,394,900 / 41.04% |
| Number/percentage of C's | 554,351,359 / 8.82% |
| Number/percentage of T's | 2,604,222,643 / 41.45% |
| Number/percentage of G's | 546,114,941 / 8.69% |
| Number/percentage of N's | 47,078 / 0% |
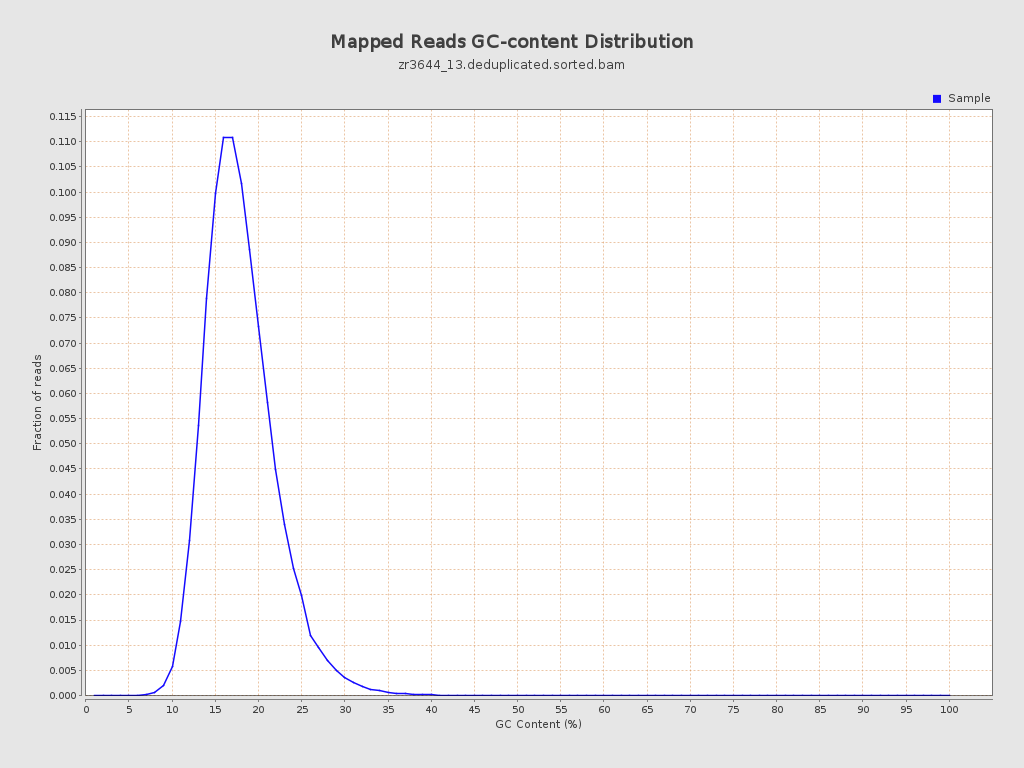
| GC Percentage | 17.51% |
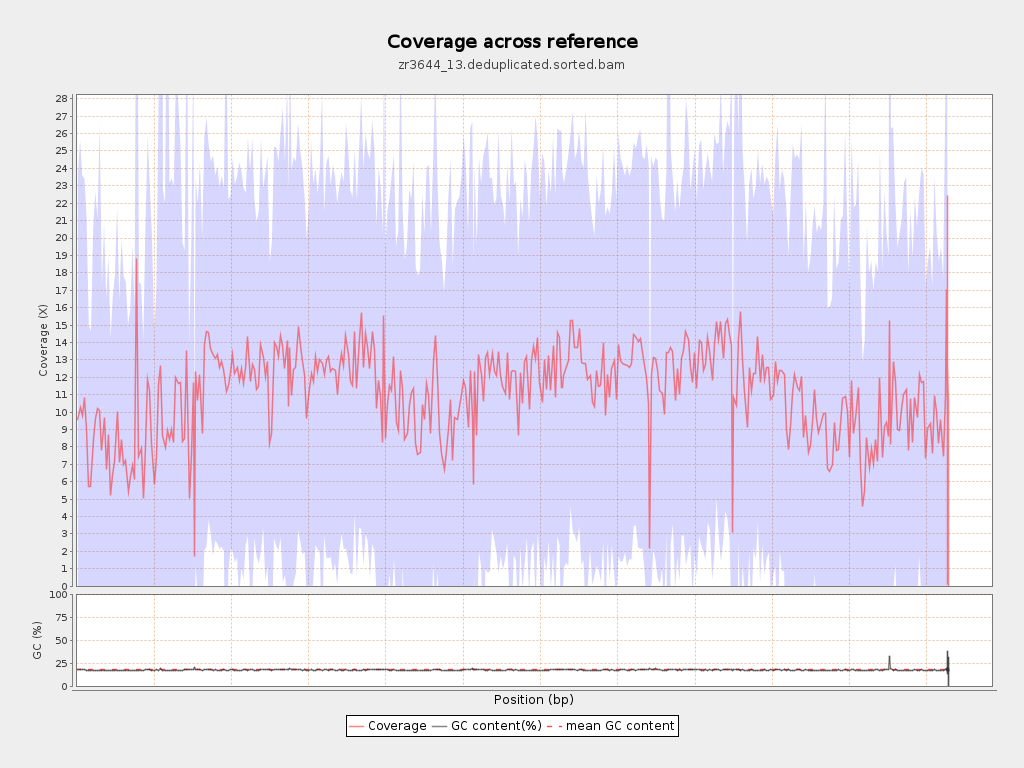
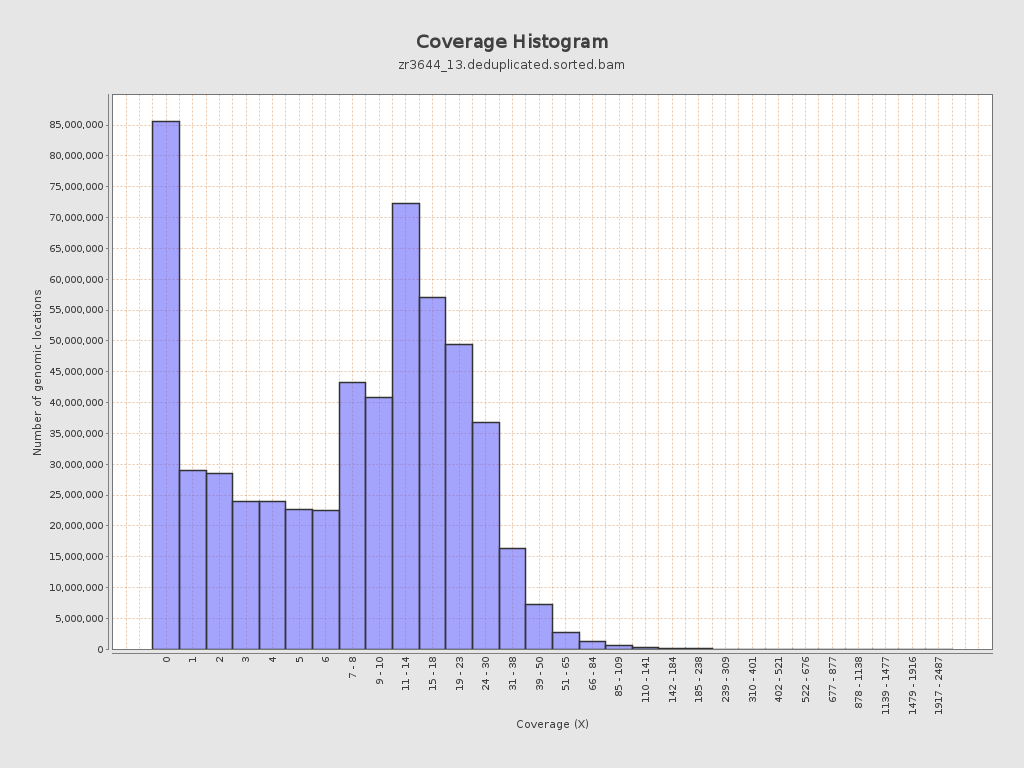
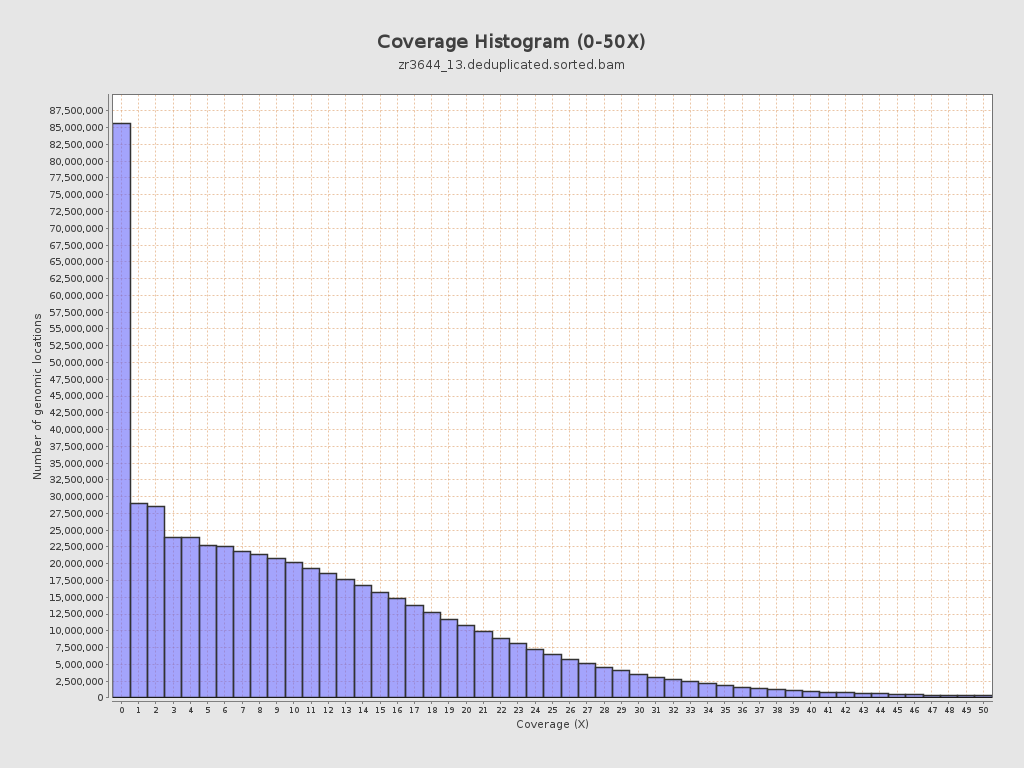
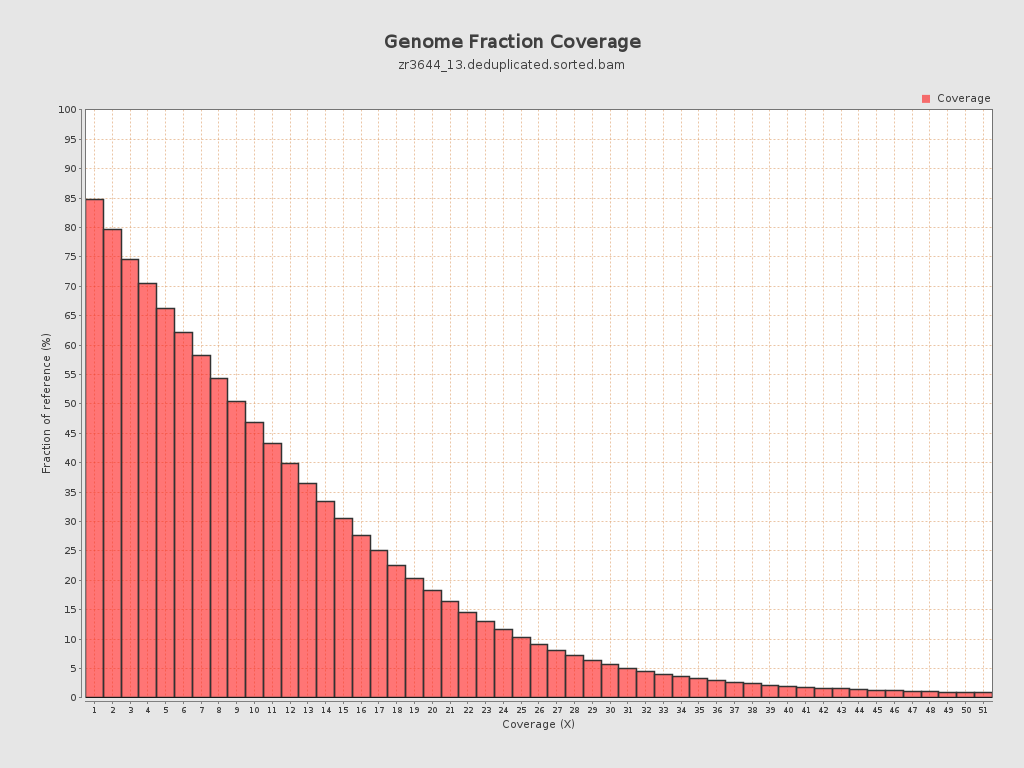
Coverage
| Mean | 11.1906 |
| Standard Deviation | 12.4682 |
| Mean (paired-end reads overlap ignored) | 8.07 |
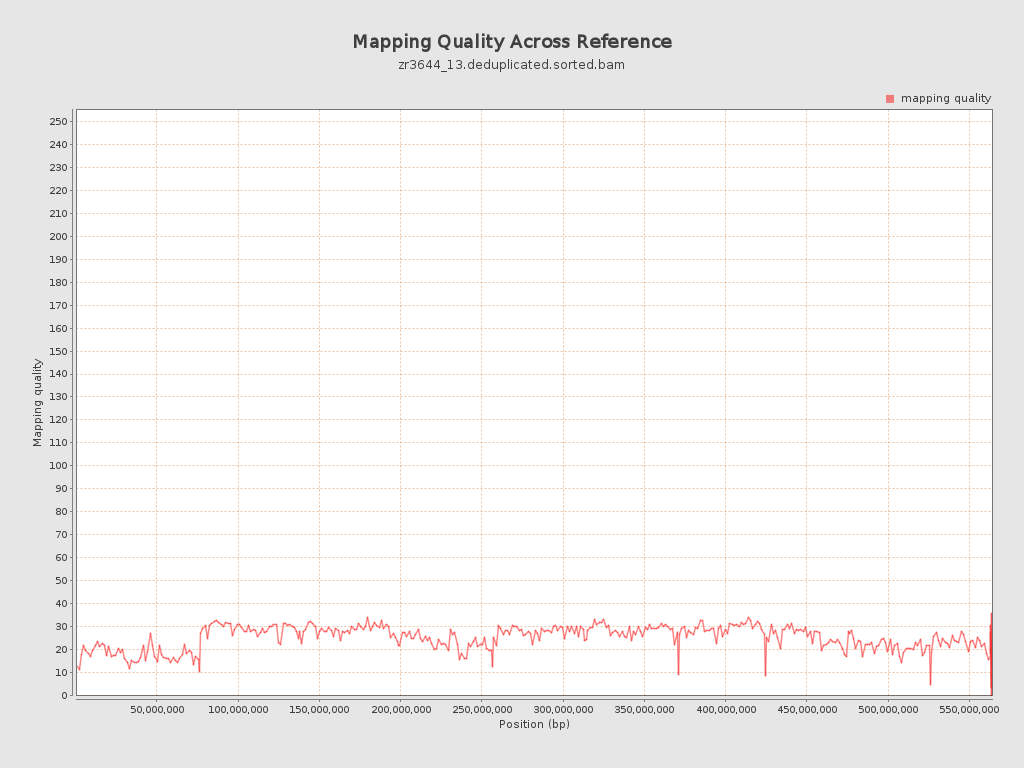
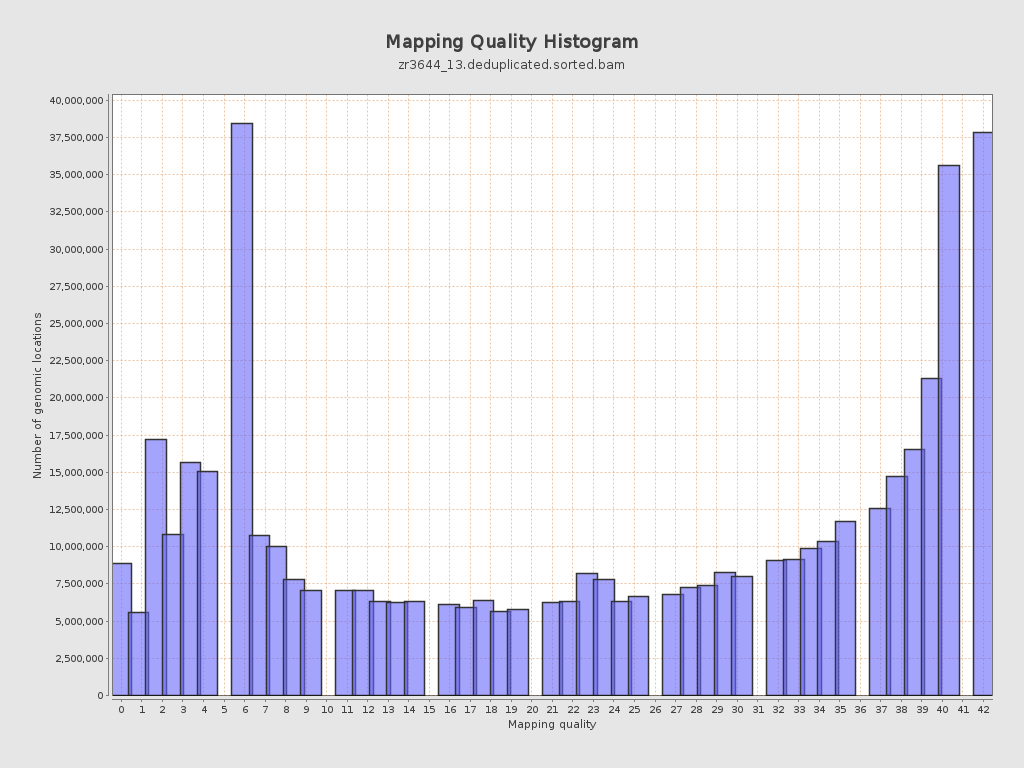
Mapping Quality
| Mean Mapping Quality | 24.71 |
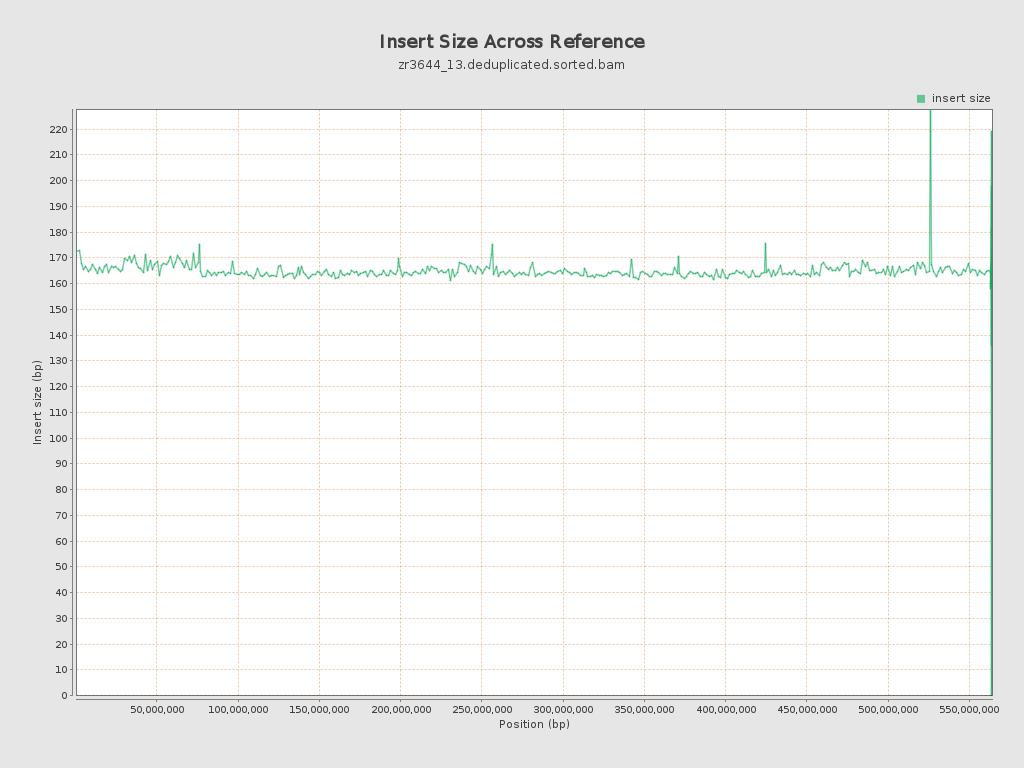
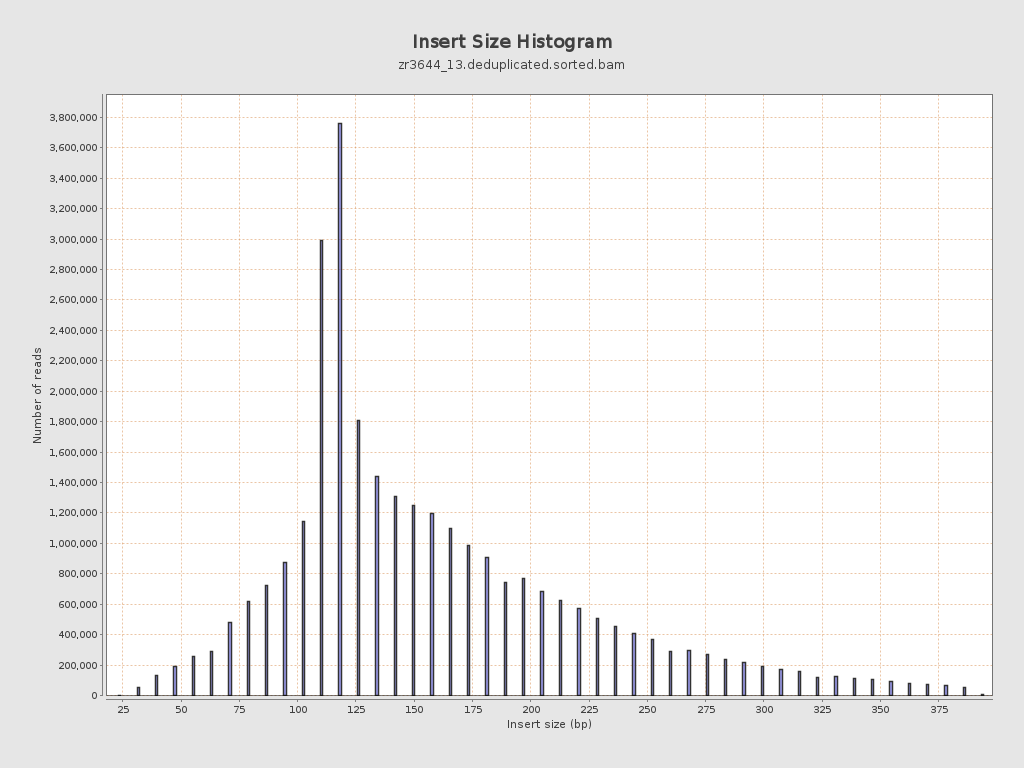
Insert size
| Mean | 164.61 |
| Standard Deviation | 73.03 |
| P25/Median/P75 | 118 / 142 / 197 |
Mismatches and indels
| General error rate | 19.43% |
| Mismatches | 1,190,067,209 |
| Insertions | 13,337,622 |
| Mapped reads with at least one insertion | 16.96% |
| Deletions | 11,922,223 |
| Mapped reads with at least one deletion | 16.57% |
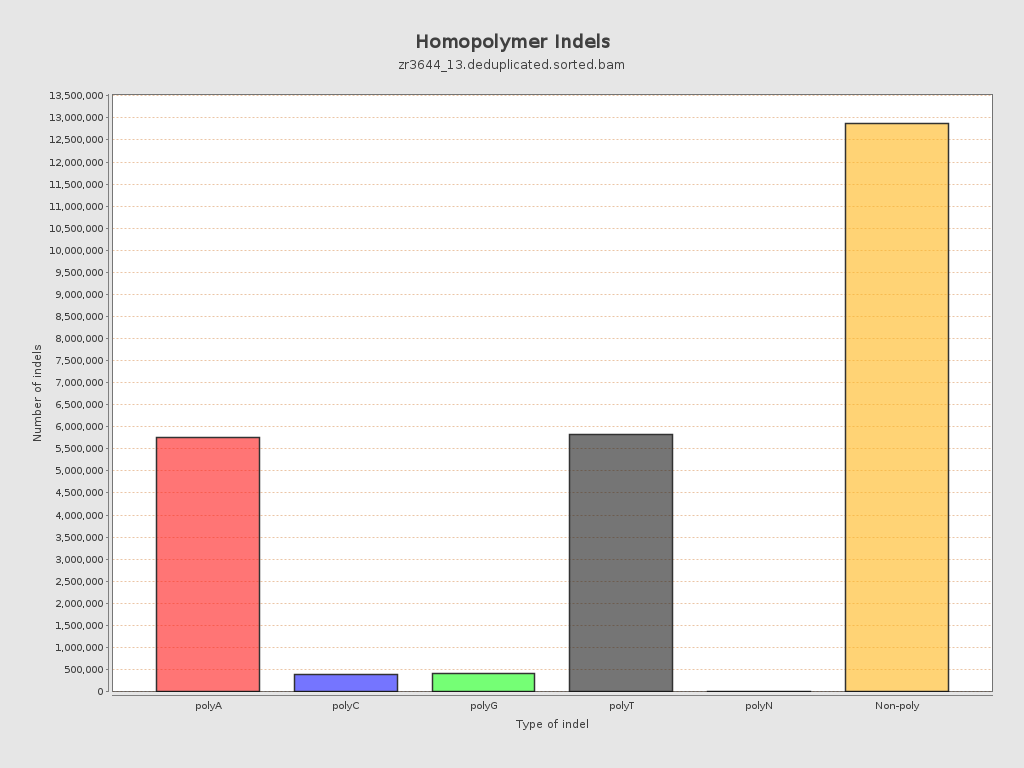
| Homopolymer indels | 49.02% |
Chromosome stats
| Name | Length | Mapped bases | Mean coverage | Standard deviation |
| NC_088853.1 | 76070991 | 665839824 | 8.7529 | 17.0853 |
| NC_088854.1 | 61469542 | 767554533 | 12.4867 | 11.2647 |
| NC_088855.1 | 61039741 | 769055400 | 12.5993 | 11.0436 |
| NC_088856.1 | 57946171 | 586802011 | 10.1267 | 11.91 |
| NC_088857.1 | 57274926 | 699421775 | 12.2117 | 11.1009 |
| NC_088858.1 | 56905015 | 722509007 | 12.6968 | 10.8636 |
| NC_088859.1 | 53672946 | 703438002 | 13.106 | 11.7407 |
| NC_088860.1 | 51133819 | 581848010 | 11.3789 | 12.2288 |
| NC_088861.1 | 50364239 | 437754595 | 8.6918 | 11.3652 |
| NC_088862.1 | 37310742 | 373273087 | 10.0044 | 11.6776 |
| NW_027062568.1 | 15579 | 150202 | 9.6413 | 8.5657 |
| NW_027062569.1 | 16498 | 238539 | 14.4587 | 16.5628 |
| NW_027062570.1 | 4000 | 65344 | 16.336 | 16.3881 |
| NW_027062571.1 | 36893 | 7370 | 0.1998 | 1.1009 |
| NW_027062572.1 | 51000 | 51298 | 1.0058 | 3.0455 |
| NW_027062573.1 | 2000 | 44900 | 22.45 | 11.78 |
| NW_027062574.1 | 37061 | 3464 | 0.0935 | 0.6785 |
| NW_027062575.1 | 49428 | 438336 | 8.8682 | 17.226 |
| NW_027062576.1 | 49232 | 213208 | 4.3307 | 9.3807 |
| NW_027062577.1 | 17087 | 161989 | 9.4802 | 6.4677 |
| NW_027062578.1 | 34507 | 594109 | 17.2171 | 8.982 |
| NW_027062579.1 | 64000 | 476636 | 7.4474 | 10.9006 |
| NW_027062580.1 | 24229 | 309862 | 12.7889 | 12.1889 |
| NW_027062581.1 | 5000 | 51367 | 10.2734 | 12.5313 |
| NW_027062582.1 | 18808 | 204445 | 10.8701 | 11.5645 |
| NW_027062583.1 | 1000 | 0 | 0 | 0 |
| NW_027062584.1 | 74000 | 16597 | 0.2243 | 1.3383 |
| NW_027062585.1 | 39334 | 328076 | 8.3408 | 7.9528 |
| NW_027062586.1 | 258015 | 507734 | 1.9678 | 5.8242 |