Input data and parameters
QualiMap command line
| qualimap bamqc -bam zr3644_12.deduplicated.sorted.bam -nw 400 -hm 3 |
Alignment
| Command line: | "bismark -1 zr3644_12_R1_val_1_val_1_val_1.fq.gz -2 zr3644_12_R2_val_2_val_2_val_2.fq.gz --genome BismarkIndex --bam --score_min L,0,-0.8 --non_directional --prefix zr3644_12 --multicore 2" |
| Draw chromosome limits: | no |
| Analyze overlapping paired-end reads: | yes |
| Program: | Bismark (v0.24.2) |
| Analysis date: | Wed Apr 16 03:05:43 GMT 2025 |
| Size of a homopolymer: | 3 |
| Skip duplicate alignments: | no |
| Number of windows: | 400 |
| BAM file: | zr3644_12.deduplicated.sorted.bam |
Summary
Globals
| Reference size | 563,985,803 |
| Number of reads | 46,444,264 |
| Mapped reads | 46,444,264 / 100% |
| Unmapped reads | 0 / 0% |
| Mapped paired reads | 46,444,264 / 100% |
| Mapped reads, first in pair | 23,222,132 / 50% |
| Mapped reads, second in pair | 23,222,132 / 50% |
| Mapped reads, both in pair | 46,444,264 / 100% |
| Mapped reads, singletons | 0 / 0% |
| Secondary alignments | 0 |
| Read min/max/mean length | 20 / 115 / 105.43 |
| Overlapping read pairs | 19,809,731 / 85.31% |
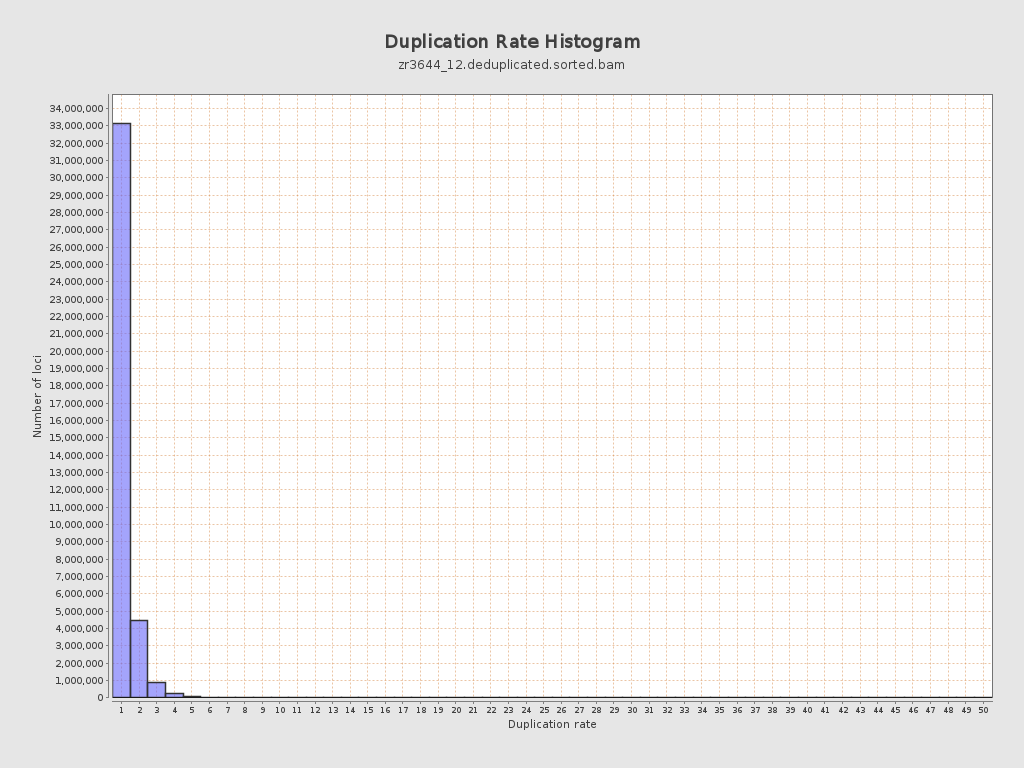
| Duplicated reads (estimated) | 7,617,196 / 16.4% |
| Duplication rate | 14.69% |
| Clipped reads | 0 / 0% |
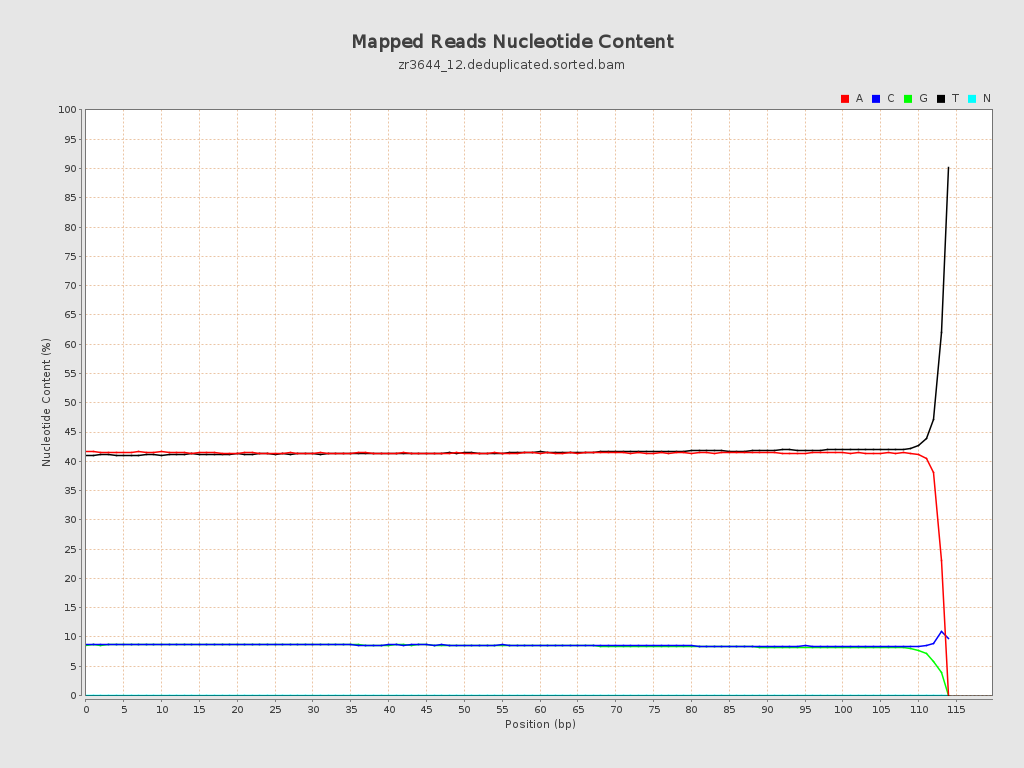
ACGT Content
| Number/percentage of A's | 2,008,969,581 / 41.27% |
| Number/percentage of C's | 417,929,034 / 8.59% |
| Number/percentage of T's | 2,028,721,724 / 41.68% |
| Number/percentage of G's | 411,665,484 / 8.46% |
| Number/percentage of N's | 33,214 / 0% |
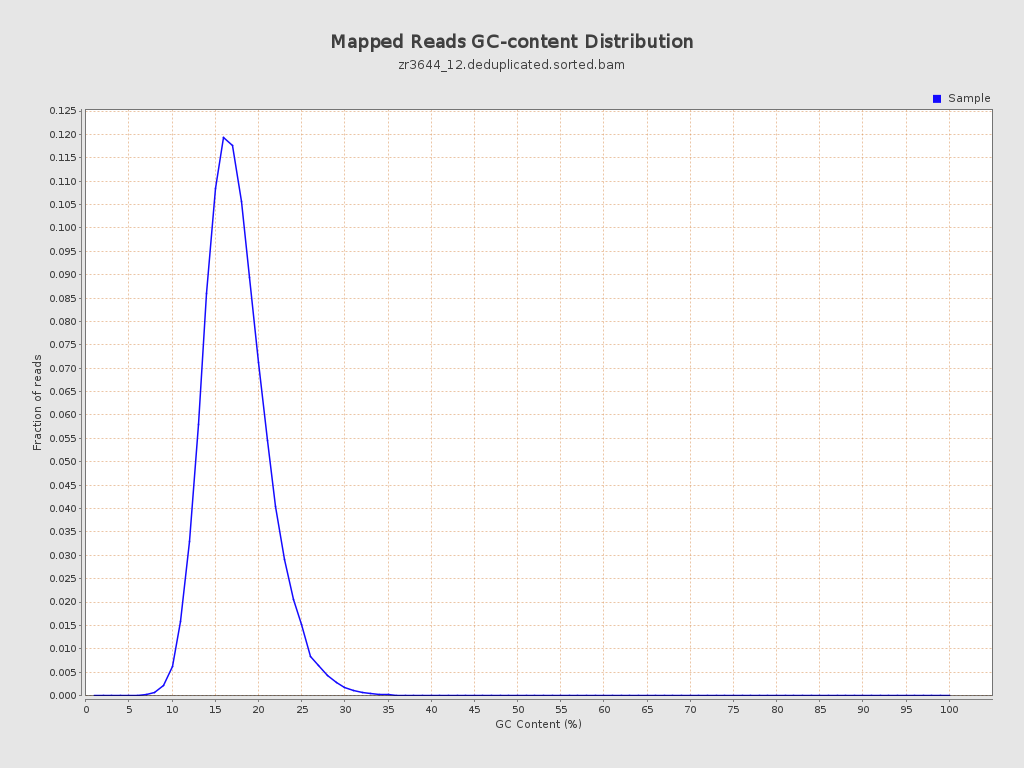
| GC Percentage | 17.04% |
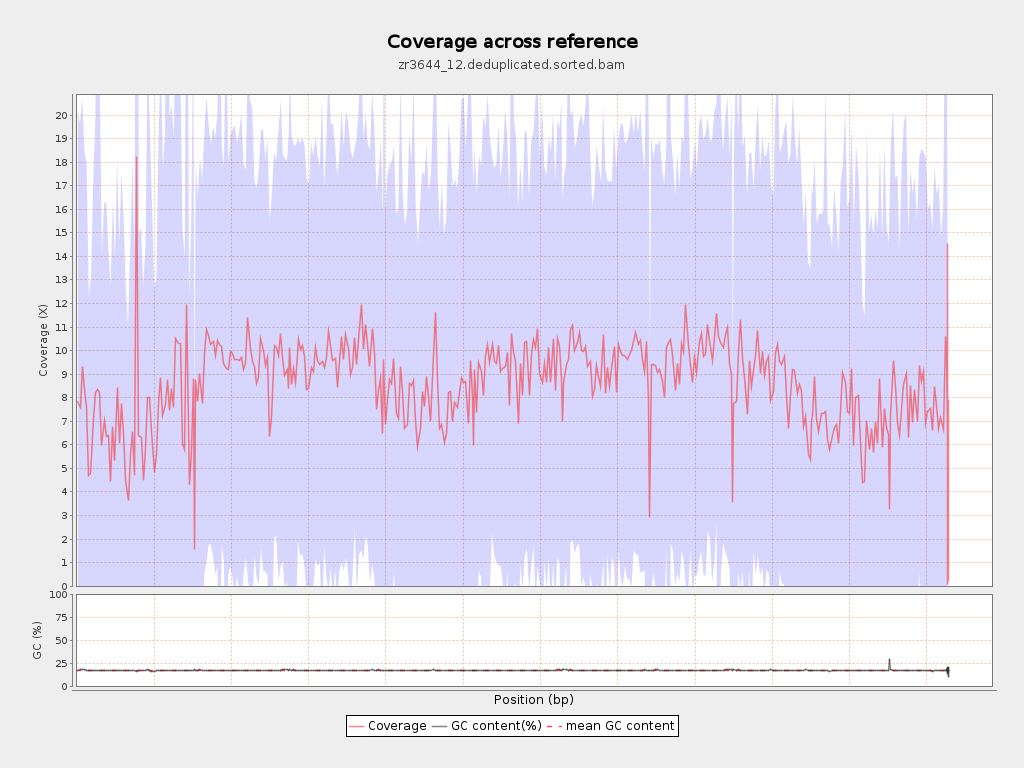
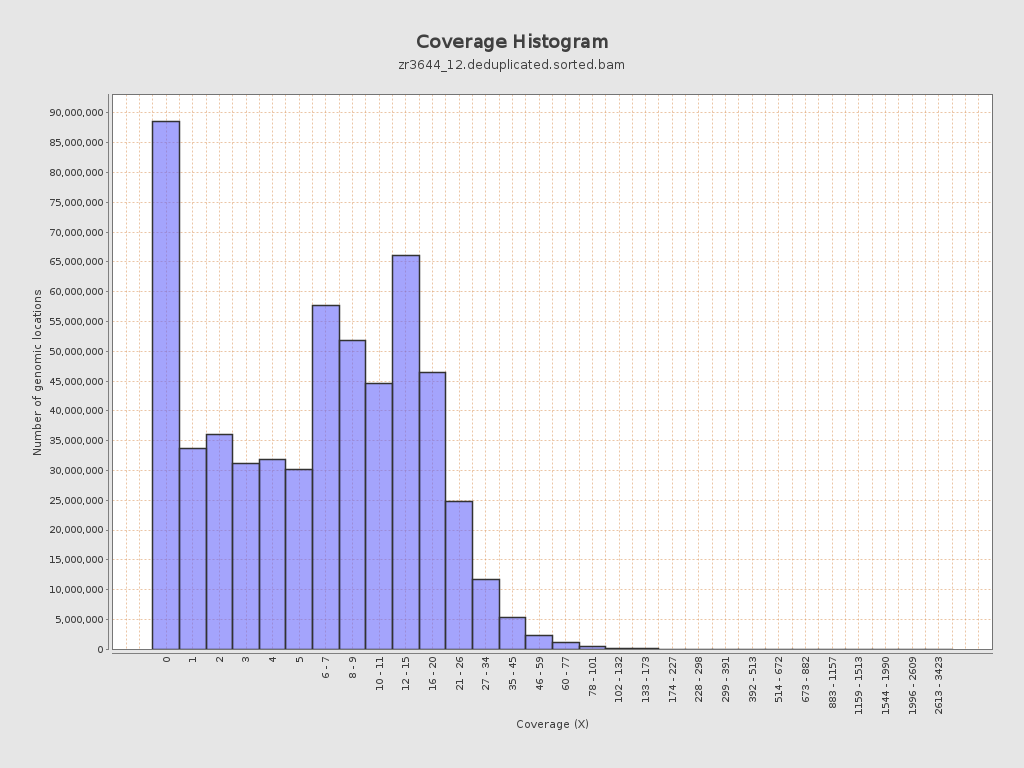
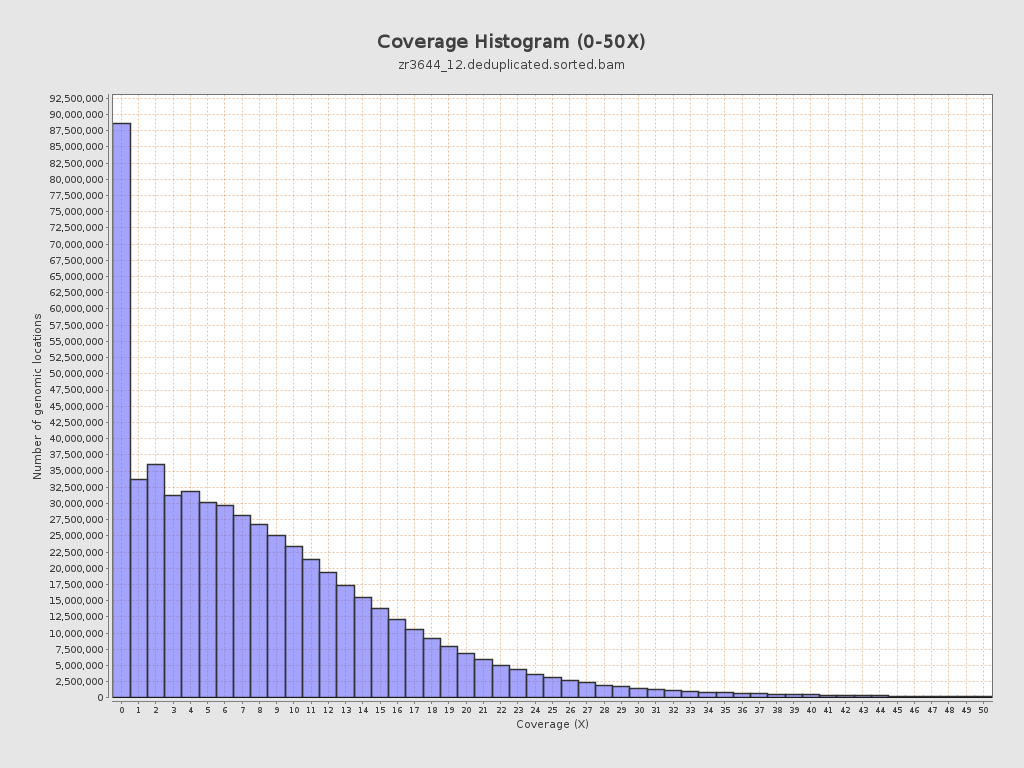
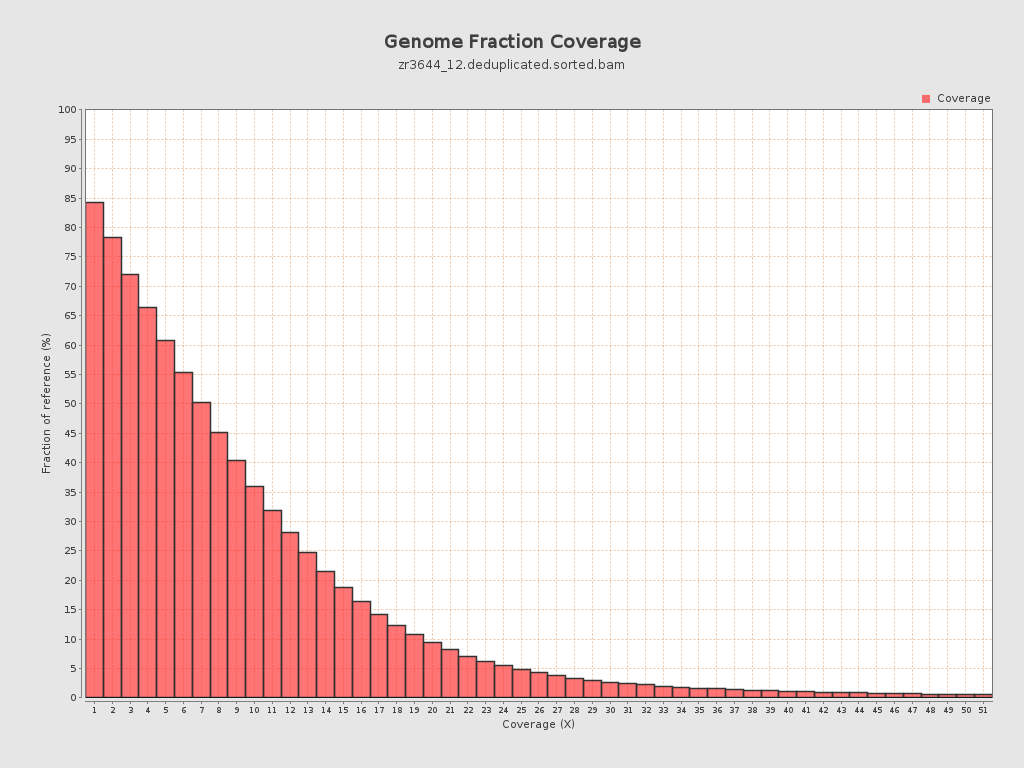
Coverage
| Mean | 8.6704 |
| Standard Deviation | 9.7745 |
| Mean (paired-end reads overlap ignored) | 6.14 |
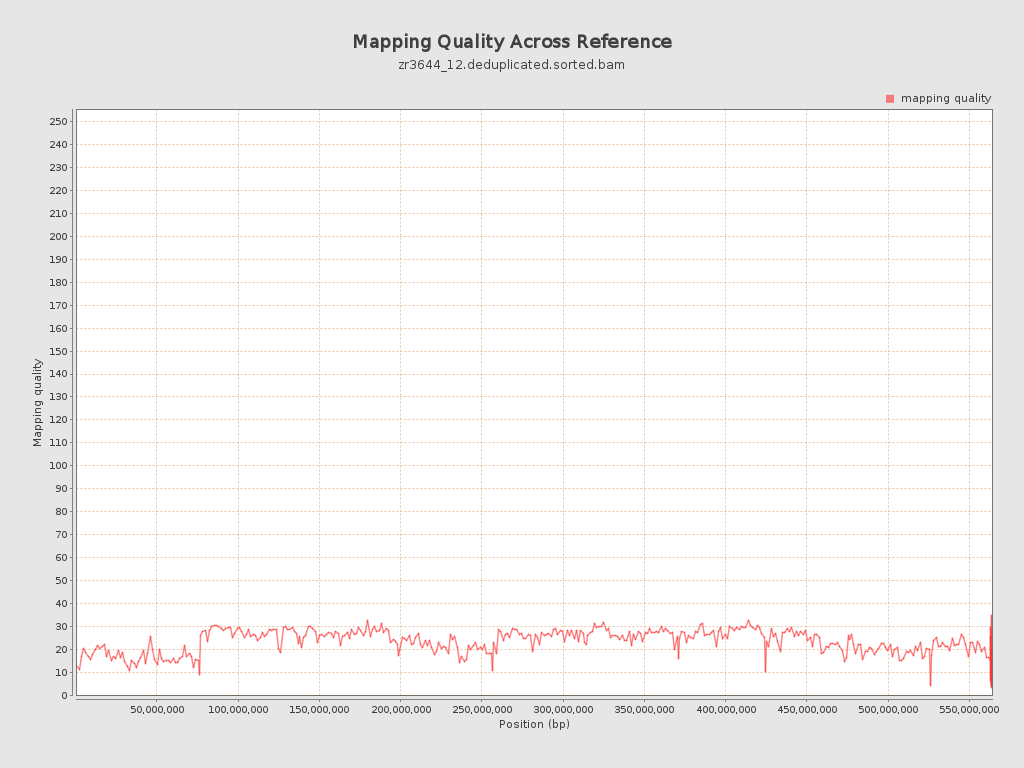
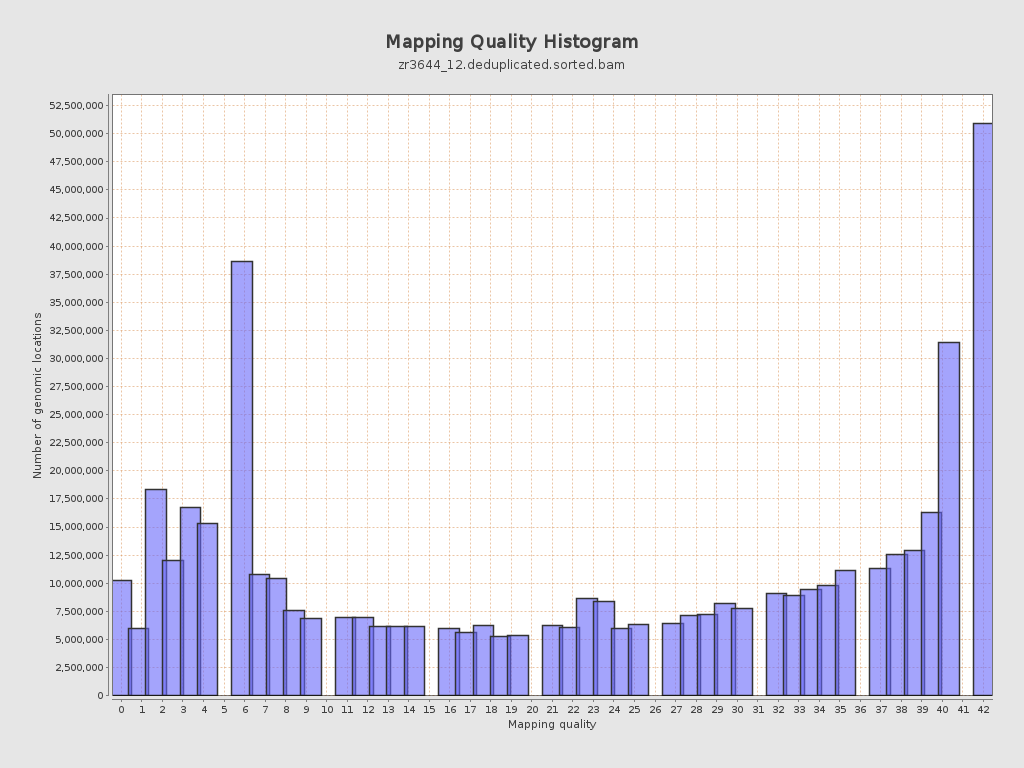
Mapping Quality
| Mean Mapping Quality | 23.17 |
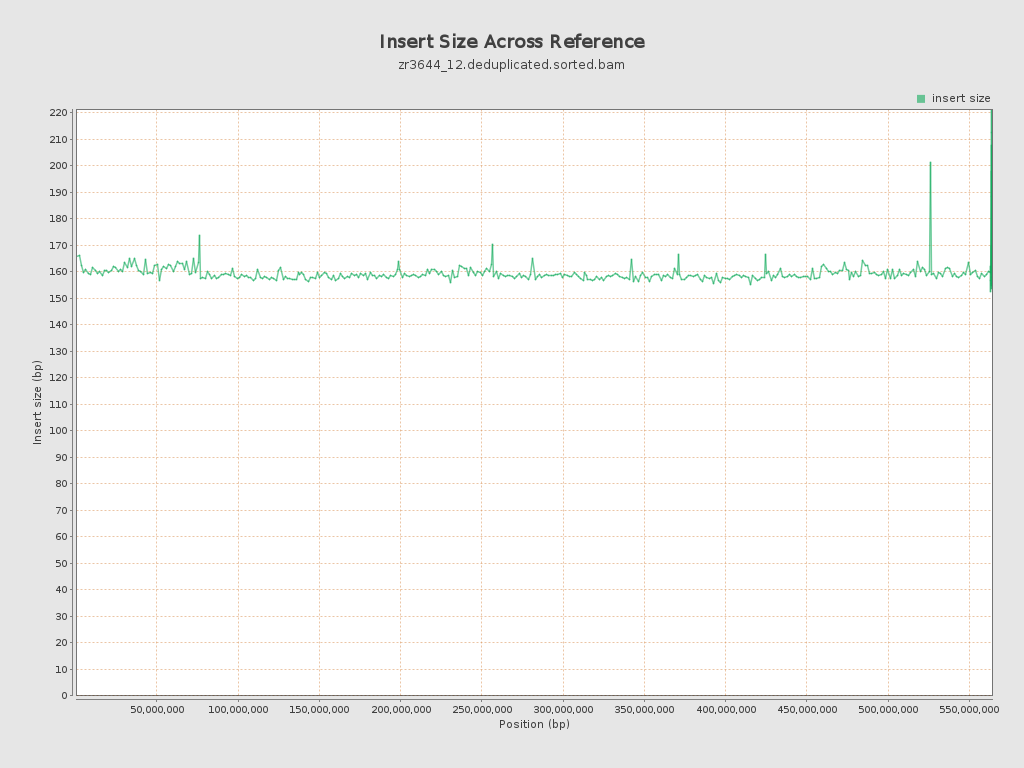
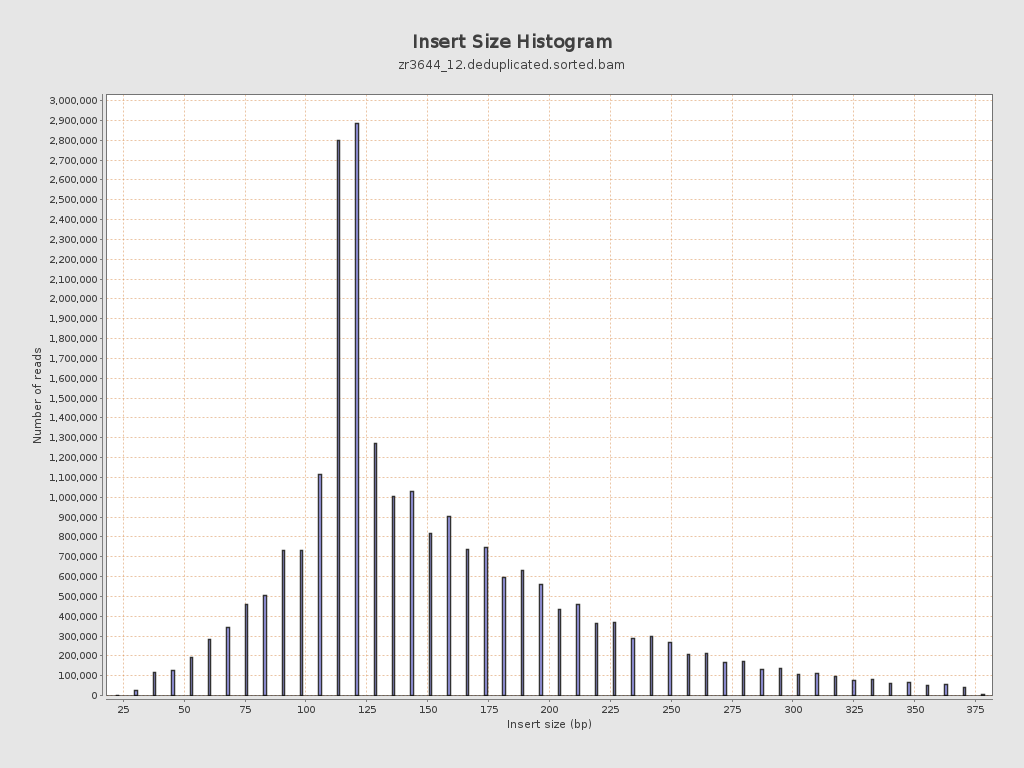
Insert size
| Mean | 158.89 |
| Standard Deviation | 69.87 |
| P25/Median/P75 | 117 / 137 / 189 |
Mismatches and indels
| General error rate | 19.56% |
| Mismatches | 927,266,514 |
| Insertions | 10,987,036 |
| Mapped reads with at least one insertion | 17.84% |
| Deletions | 9,705,964 |
| Mapped reads with at least one deletion | 17.23% |
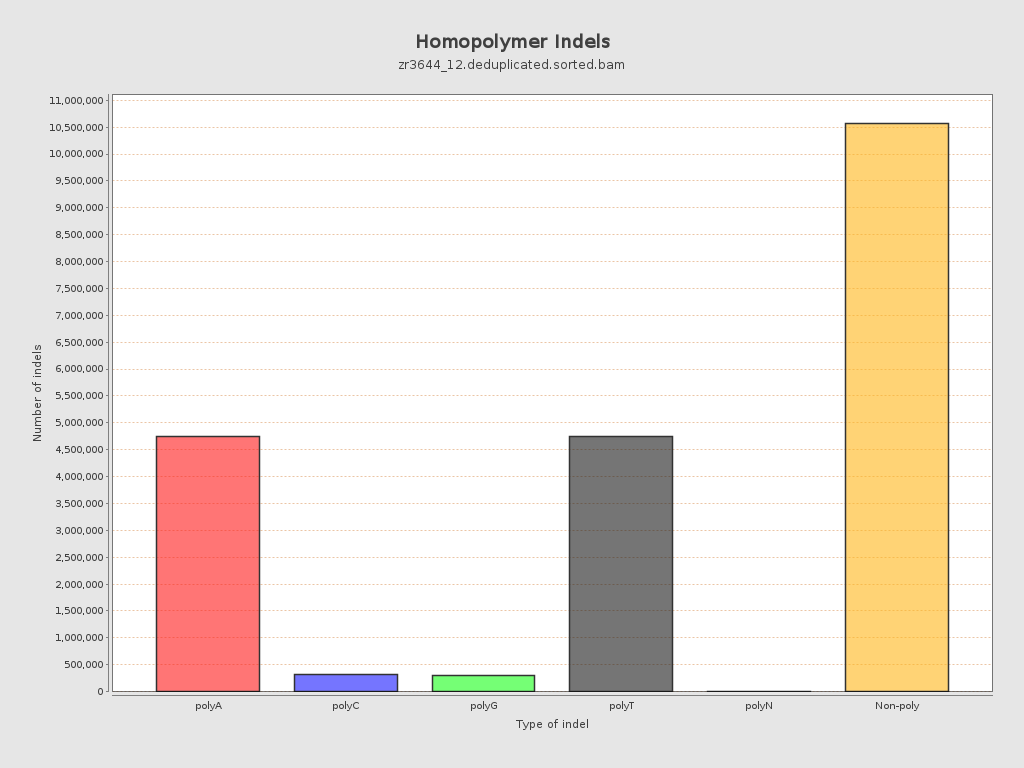
| Homopolymer indels | 48.92% |
Chromosome stats
| Name | Length | Mapped bases | Mean coverage | Standard deviation |
| NC_088853.1 | 76070991 | 549388324 | 7.222 | 11.54 |
| NC_088854.1 | 61469542 | 585833824 | 9.5305 | 9.1451 |
| NC_088855.1 | 61039741 | 587305930 | 9.6217 | 8.9613 |
| NC_088856.1 | 57946171 | 462434732 | 7.9804 | 9.7738 |
| NC_088857.1 | 57274926 | 538597922 | 9.4037 | 9.1563 |
| NC_088858.1 | 56905015 | 546688743 | 9.607 | 9.0767 |
| NC_088859.1 | 53672946 | 528518487 | 9.847 | 10.2585 |
| NC_088860.1 | 51133819 | 445270107 | 8.7079 | 9.4957 |
| NC_088861.1 | 50364239 | 349198971 | 6.9335 | 9.2078 |
| NC_088862.1 | 37310742 | 293567811 | 7.8682 | 9.6567 |
| NW_027062568.1 | 15579 | 102608 | 6.5863 | 5.0816 |
| NW_027062569.1 | 16498 | 117392 | 7.1155 | 13.5476 |
| NW_027062570.1 | 4000 | 31953 | 7.9882 | 8.5644 |
| NW_027062571.1 | 36893 | 21598 | 0.5854 | 2.1338 |
| NW_027062572.1 | 51000 | 58947 | 1.1558 | 4.0911 |
| NW_027062573.1 | 2000 | 29138 | 14.569 | 10.1368 |
| NW_027062574.1 | 37061 | 2602 | 0.0702 | 0.3486 |
| NW_027062575.1 | 49428 | 295911 | 5.9867 | 9.1948 |
| NW_027062576.1 | 49232 | 182483 | 3.7066 | 6.5238 |
| NW_027062577.1 | 17087 | 122477 | 7.1678 | 6.0841 |
| NW_027062578.1 | 34507 | 318750 | 9.2373 | 6.6341 |
| NW_027062579.1 | 64000 | 530317 | 8.2862 | 10.9121 |
| NW_027062580.1 | 24229 | 145476 | 6.0042 | 7.5447 |
| NW_027062581.1 | 5000 | 36123 | 7.2246 | 10.0211 |
| NW_027062582.1 | 18808 | 149103 | 7.9276 | 8.3021 |
| NW_027062583.1 | 1000 | 230 | 0.23 | 0.4417 |
| NW_027062584.1 | 74000 | 15961 | 0.2157 | 0.7379 |
| NW_027062585.1 | 39334 | 261459 | 6.6472 | 8.215 |
| NW_027062586.1 | 258015 | 752983 | 2.9184 | 6.5799 |