Input data and parameters
QualiMap command line
| qualimap bamqc -bam zr3644_11.deduplicated.sorted.bam -nw 400 -hm 3 |
Alignment
| Command line: | "bismark -1 zr3644_11_R1_val_1_val_1_val_1.fq.gz -2 zr3644_11_R2_val_2_val_2_val_2.fq.gz --genome BismarkIndex --bam --score_min L,0,-0.8 --non_directional --prefix zr3644_11 --multicore 3" |
| Draw chromosome limits: | no |
| Analyze overlapping paired-end reads: | yes |
| Program: | Bismark (v0.24.2) |
| Analysis date: | Wed Apr 16 08:00:42 GMT 2025 |
| Size of a homopolymer: | 3 |
| Skip duplicate alignments: | no |
| Number of windows: | 400 |
| BAM file: | zr3644_11.deduplicated.sorted.bam |
Summary
Globals
| Reference size | 563,985,803 |
| Number of reads | 62,468,064 |
| Mapped reads | 62,468,064 / 100% |
| Unmapped reads | 0 / 0% |
| Mapped paired reads | 62,468,064 / 100% |
| Mapped reads, first in pair | 31,234,032 / 50% |
| Mapped reads, second in pair | 31,234,032 / 50% |
| Mapped reads, both in pair | 62,468,064 / 100% |
| Mapped reads, singletons | 0 / 0% |
| Secondary alignments | 0 |
| Read min/max/mean length | 20 / 115 / 105.3 |
| Overlapping read pairs | 26,538,560 / 84.97% |
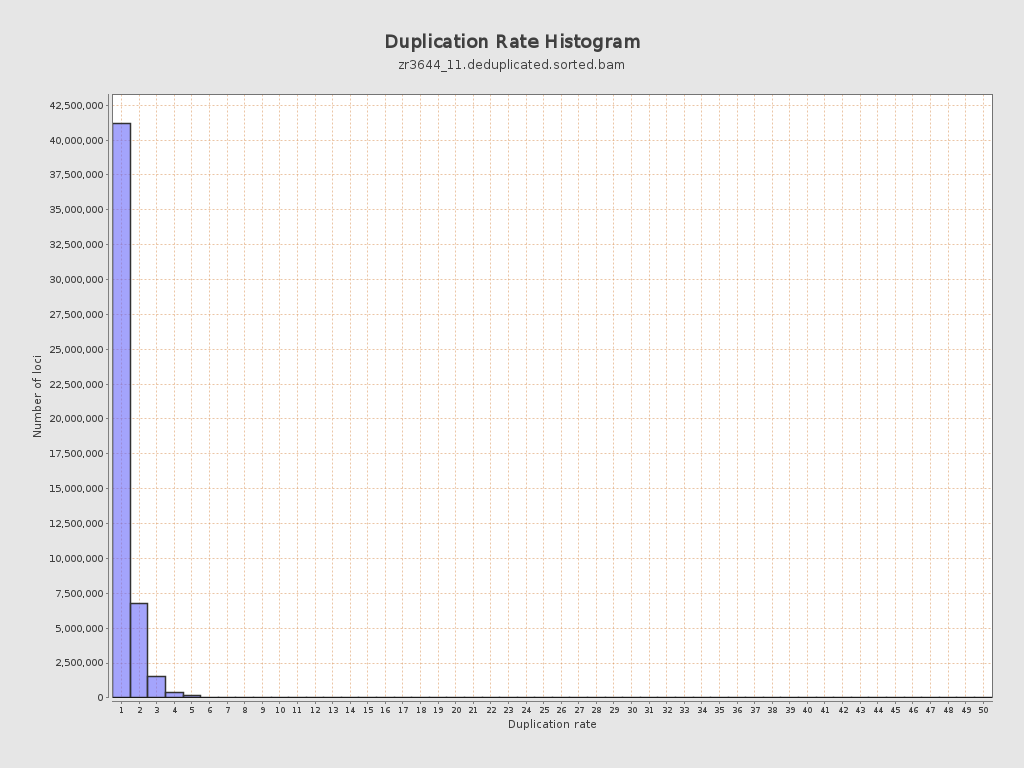
| Duplicated reads (estimated) | 12,360,661 / 19.79% |
| Duplication rate | 17.82% |
| Clipped reads | 0 / 0% |
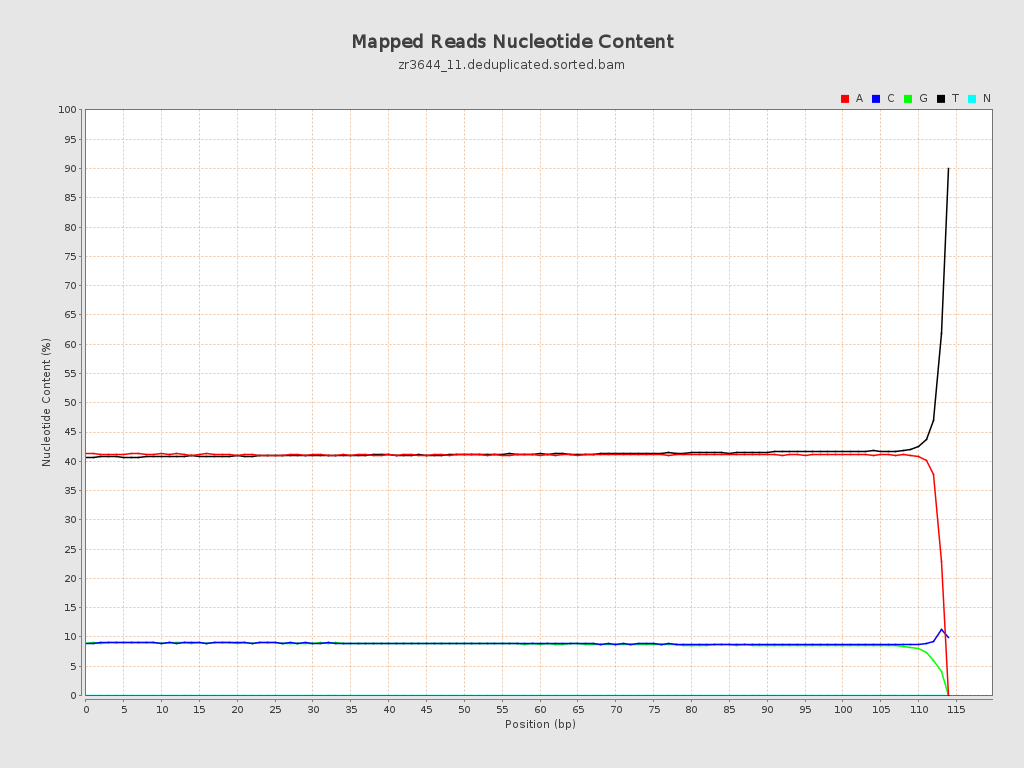
ACGT Content
| Number/percentage of A's | 2,679,500,764 / 40.97% |
| Number/percentage of C's | 581,228,239 / 8.89% |
| Number/percentage of T's | 2,706,993,988 / 41.39% |
| Number/percentage of G's | 572,391,560 / 8.75% |
| Number/percentage of N's | 48,272 / 0% |
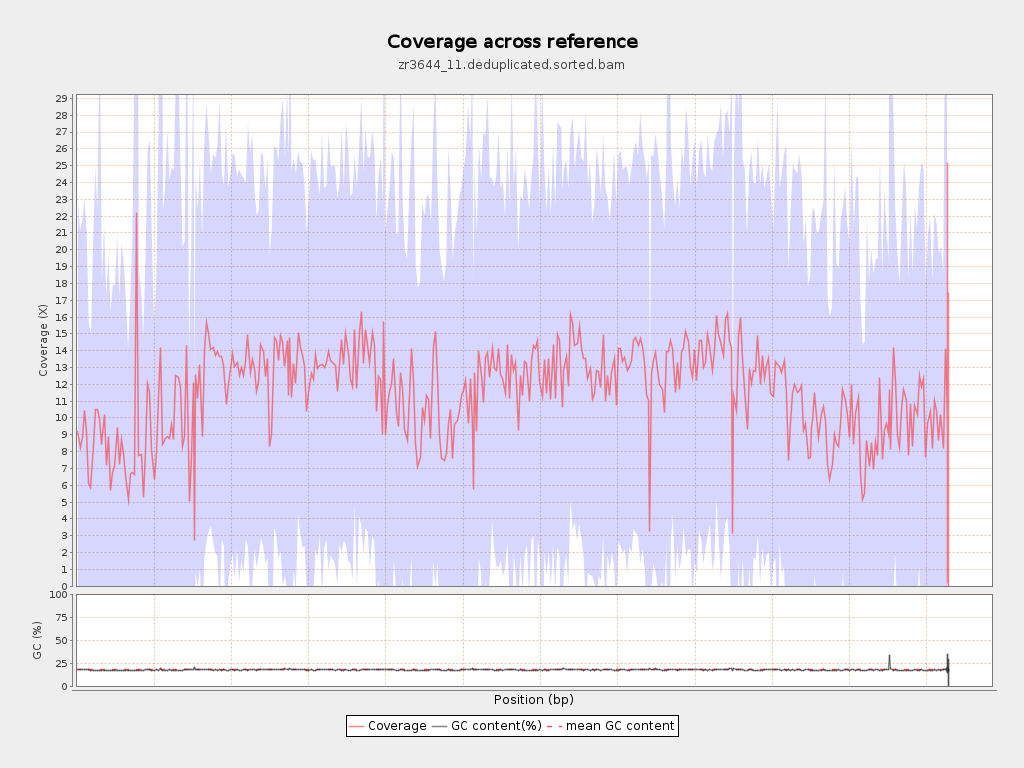
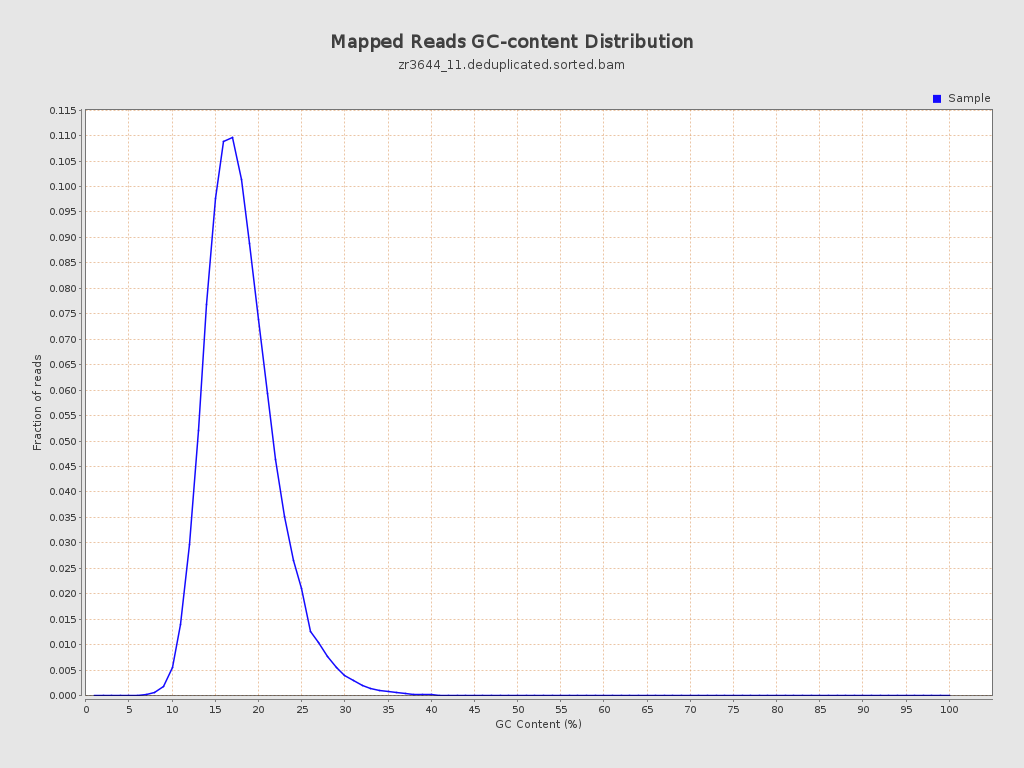
| GC Percentage | 17.64% |
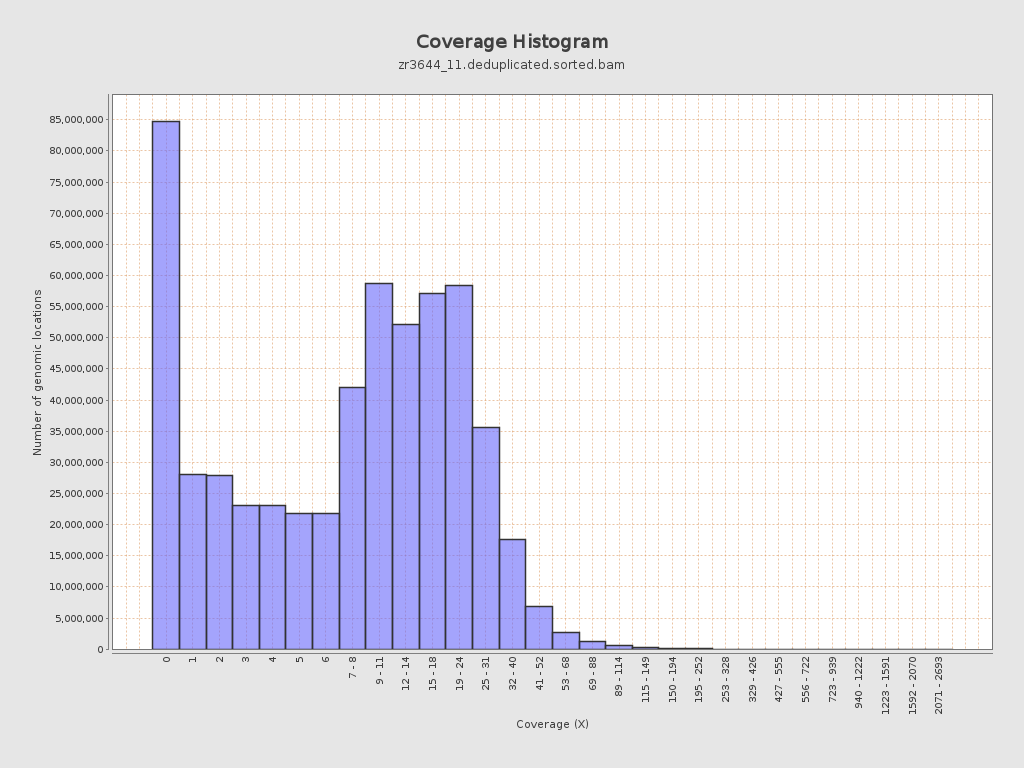
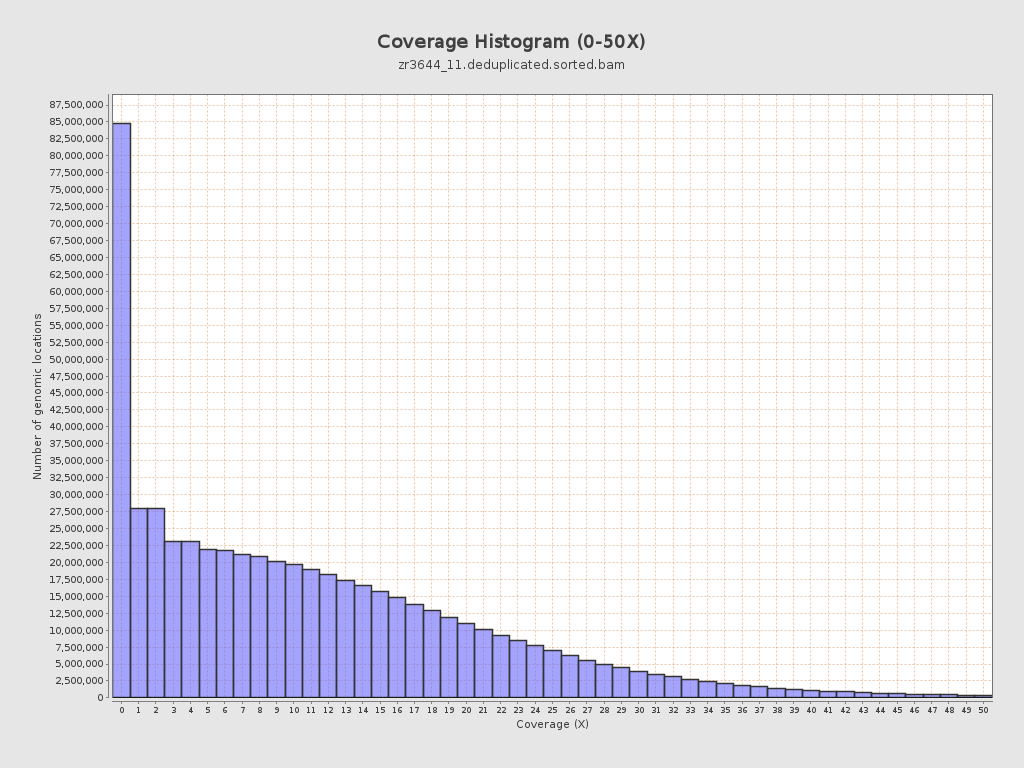
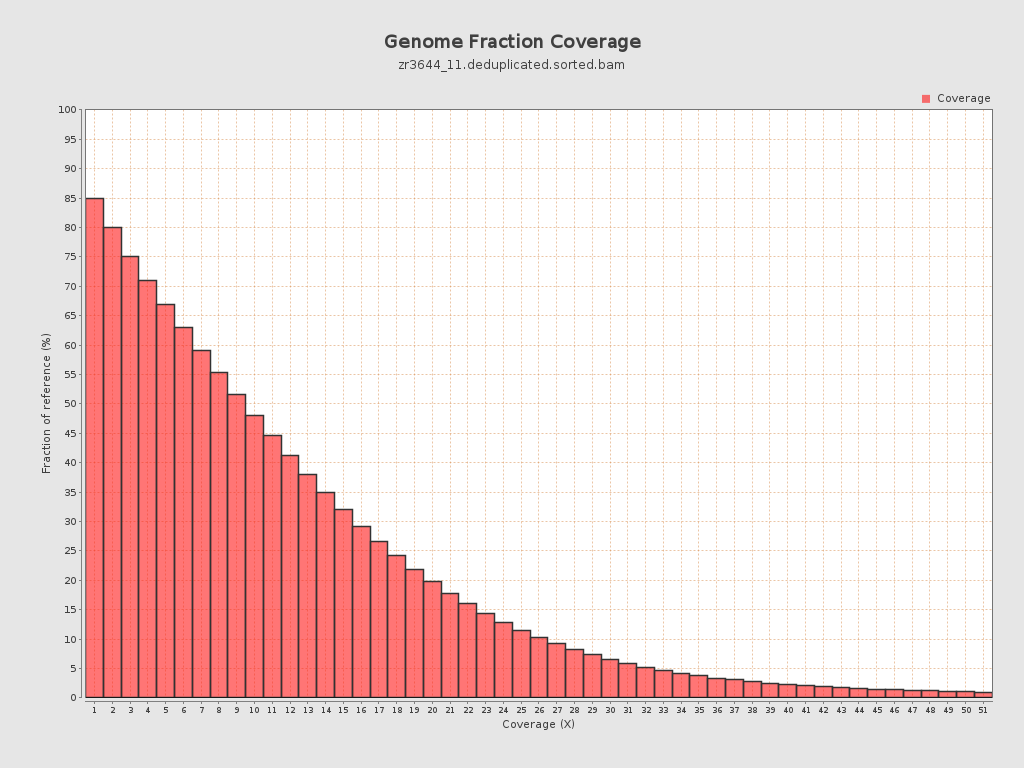
Coverage
| Mean | 11.6482 |
| Standard Deviation | 13.167 |
| Mean (paired-end reads overlap ignored) | 8.27 |
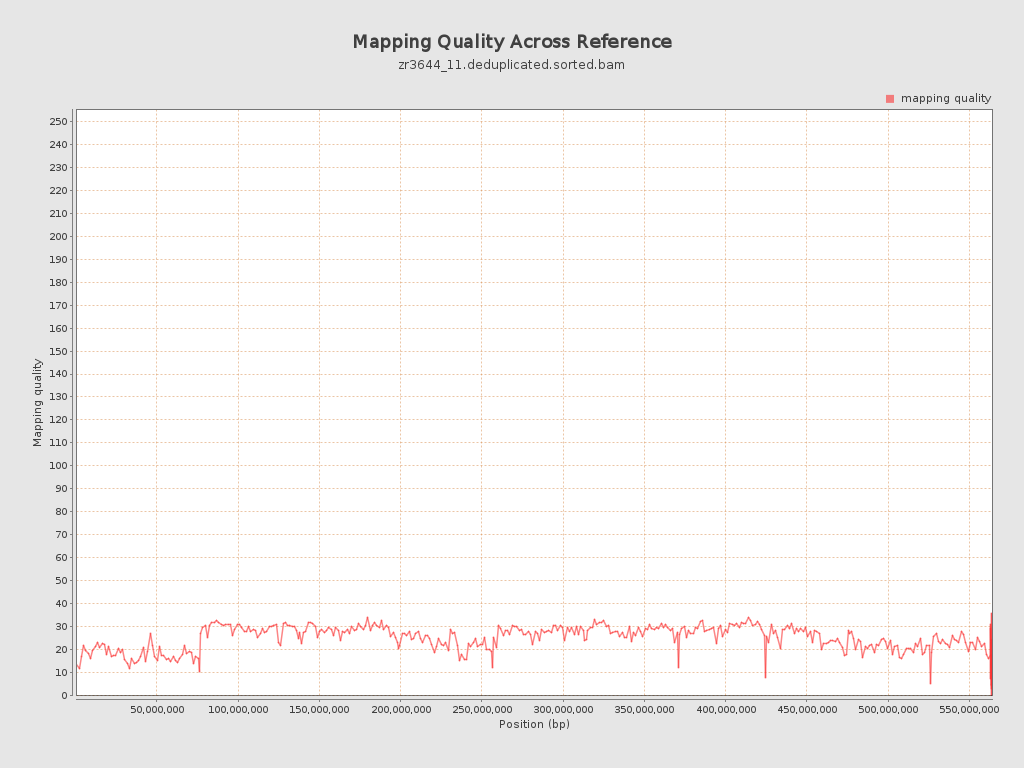
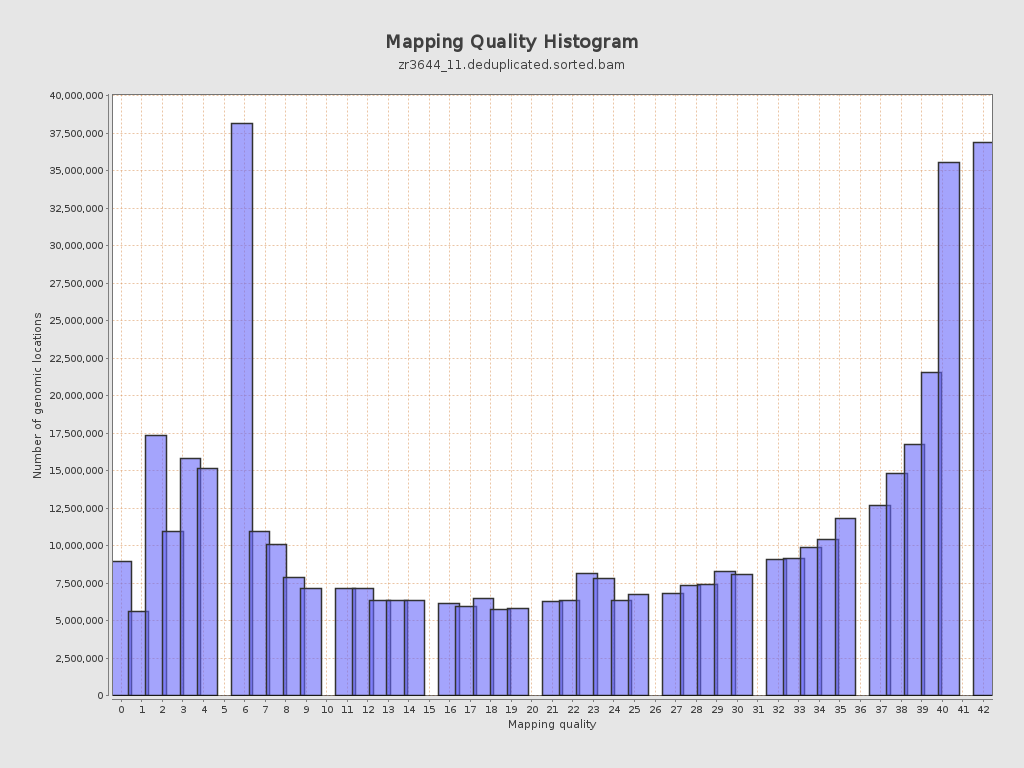
Mapping Quality
| Mean Mapping Quality | 24.67 |
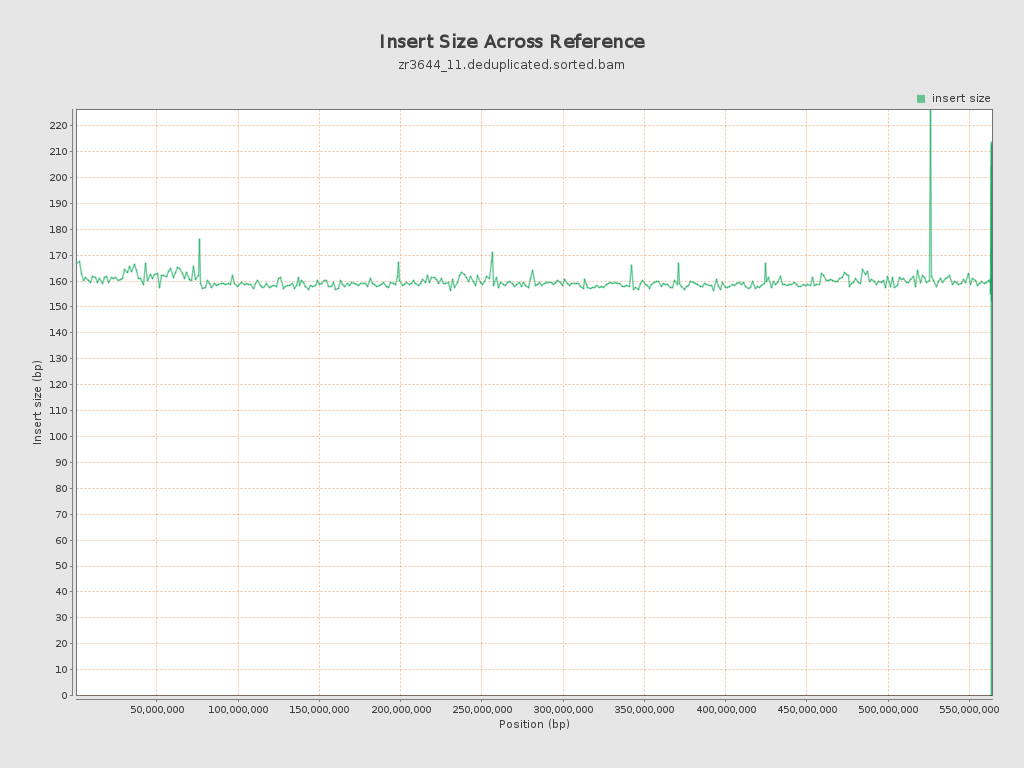
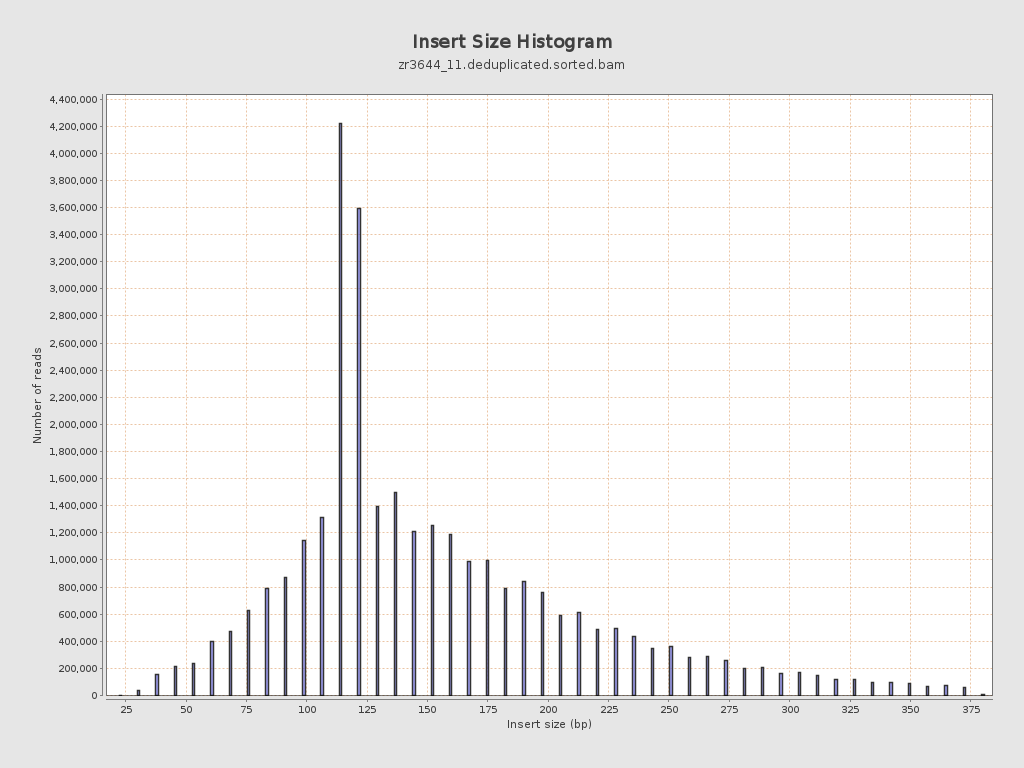
Insert size
| Mean | 159.43 |
| Standard Deviation | 70.42 |
| P25/Median/P75 | 117 / 137 / 190 |
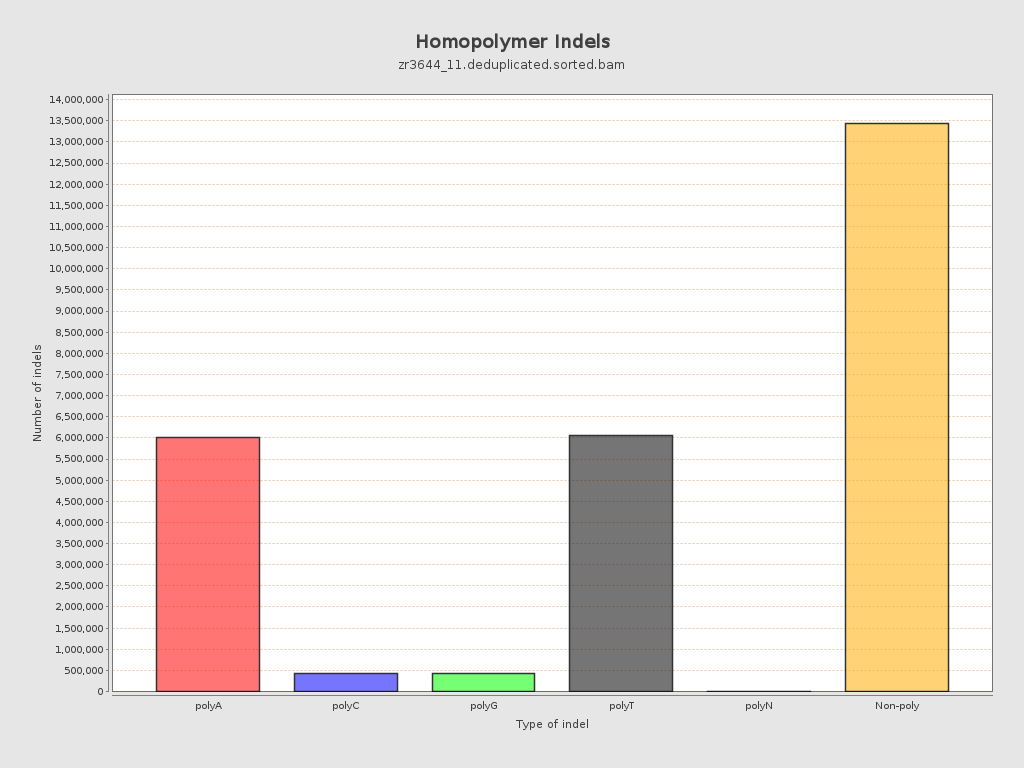
Mismatches and indels
| General error rate | 19.47% |
| Mismatches | 1,241,100,621 |
| Insertions | 13,930,254 |
| Mapped reads with at least one insertion | 16.84% |
| Deletions | 12,405,298 |
| Mapped reads with at least one deletion | 16.43% |
| Homopolymer indels | 48.97% |
Chromosome stats
| Name | Length | Mapped bases | Mean coverage | Standard deviation |
| NC_088853.1 | 76070991 | 683607240 | 8.9864 | 18.2083 |
| NC_088854.1 | 61469542 | 803525139 | 13.0719 | 11.6466 |
| NC_088855.1 | 61039741 | 805905084 | 13.203 | 11.5696 |
| NC_088856.1 | 57946171 | 608904690 | 10.5081 | 12.8298 |
| NC_088857.1 | 57274926 | 729617799 | 12.7389 | 11.983 |
| NC_088858.1 | 56905015 | 753320405 | 13.2382 | 11.4411 |
| NC_088859.1 | 53672946 | 735059170 | 13.6952 | 12.3609 |
| NC_088860.1 | 51133819 | 605734028 | 11.8461 | 12.367 |
| NC_088861.1 | 50364239 | 452972393 | 8.9939 | 11.9301 |
| NC_088862.1 | 37310742 | 386160157 | 10.3498 | 12.4787 |
| NW_027062568.1 | 15579 | 150063 | 9.6324 | 7.8952 |
| NW_027062569.1 | 16498 | 117344 | 7.1126 | 14.5618 |
| NW_027062570.1 | 4000 | 79079 | 19.7697 | 19.1572 |
| NW_027062571.1 | 36893 | 9778 | 0.265 | 1.2834 |
| NW_027062572.1 | 51000 | 67064 | 1.315 | 2.757 |
| NW_027062573.1 | 2000 | 50435 | 25.2175 | 14.7119 |
| NW_027062574.1 | 37061 | 5493 | 0.1482 | 1.1346 |
| NW_027062575.1 | 49428 | 401381 | 8.1205 | 14.1149 |
| NW_027062576.1 | 49232 | 236790 | 4.8097 | 9.8205 |
| NW_027062577.1 | 17087 | 159890 | 9.3574 | 6.9451 |
| NW_027062578.1 | 34507 | 614401 | 17.8051 | 9.7253 |
| NW_027062579.1 | 64000 | 720987 | 11.2654 | 12.0713 |
| NW_027062580.1 | 24229 | 257450 | 10.6257 | 11.5461 |
| NW_027062581.1 | 5000 | 49467 | 9.8934 | 11.271 |
| NW_027062582.1 | 18808 | 327912 | 17.4347 | 14.2671 |
| NW_027062583.1 | 1000 | 0 | 0 | 0 |
| NW_027062584.1 | 74000 | 18828 | 0.2544 | 1.2869 |
| NW_027062585.1 | 39334 | 321205 | 8.1661 | 8.537 |
| NW_027062586.1 | 258015 | 1011675 | 3.921 | 7.4231 |