Input data and parameters
QualiMap command line
| qualimap bamqc -bam zr3644_10.deduplicated.sorted.bam -nw 400 -hm 3 |
Alignment
| Command line: | "bismark -1 zr3644_10_R1_val_1_val_1_val_1.fq.gz -2 zr3644_10_R2_val_2_val_2_val_2.fq.gz --genome BismarkIndex --bam --score_min L,0,-0.8 --non_directional --prefix zr3644_10 --multicore 3" |
| Draw chromosome limits: | no |
| Analyze overlapping paired-end reads: | yes |
| Program: | Bismark (v0.24.2) |
| Analysis date: | Wed Apr 16 07:20:20 GMT 2025 |
| Size of a homopolymer: | 3 |
| Skip duplicate alignments: | no |
| Number of windows: | 400 |
| BAM file: | zr3644_10.deduplicated.sorted.bam |
Summary
Globals
| Reference size | 563,985,803 |
| Number of reads | 57,723,916 |
| Mapped reads | 57,723,916 / 100% |
| Unmapped reads | 0 / 0% |
| Mapped paired reads | 57,723,916 / 100% |
| Mapped reads, first in pair | 28,861,958 / 50% |
| Mapped reads, second in pair | 28,861,958 / 50% |
| Mapped reads, both in pair | 57,723,916 / 100% |
| Mapped reads, singletons | 0 / 0% |
| Secondary alignments | 0 |
| Read min/max/mean length | 20 / 115 / 105.36 |
| Overlapping read pairs | 24,506,296 / 84.91% |
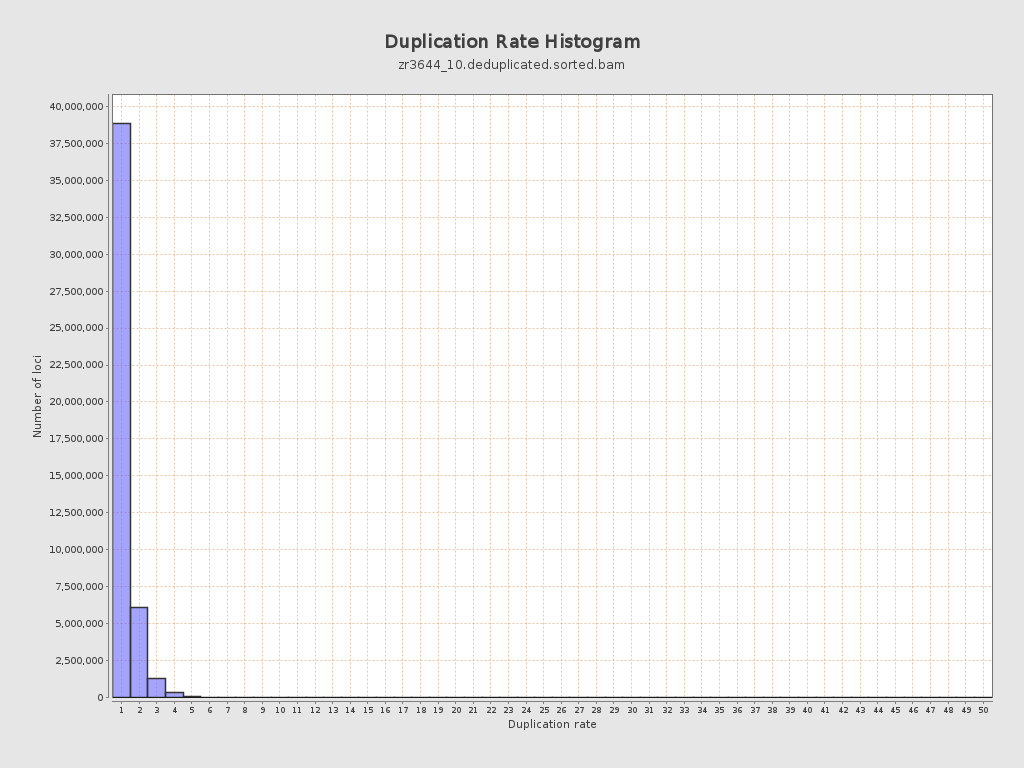
| Duplicated reads (estimated) | 10,912,649 / 18.9% |
| Duplication rate | 17.08% |
| Clipped reads | 0 / 0% |
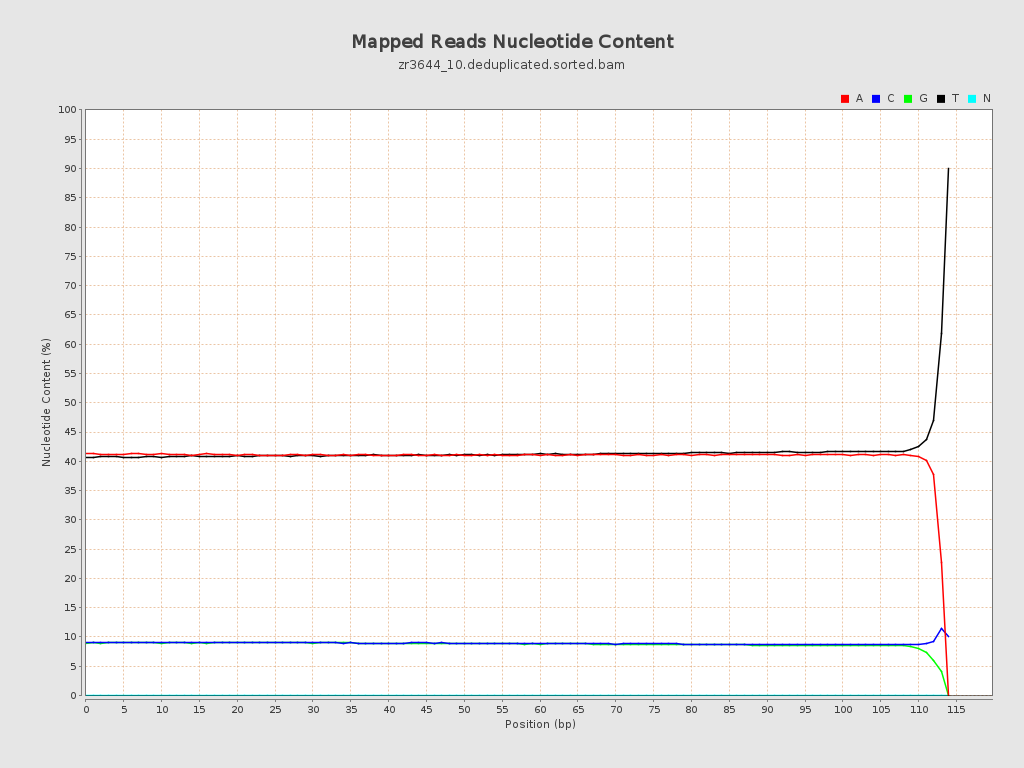
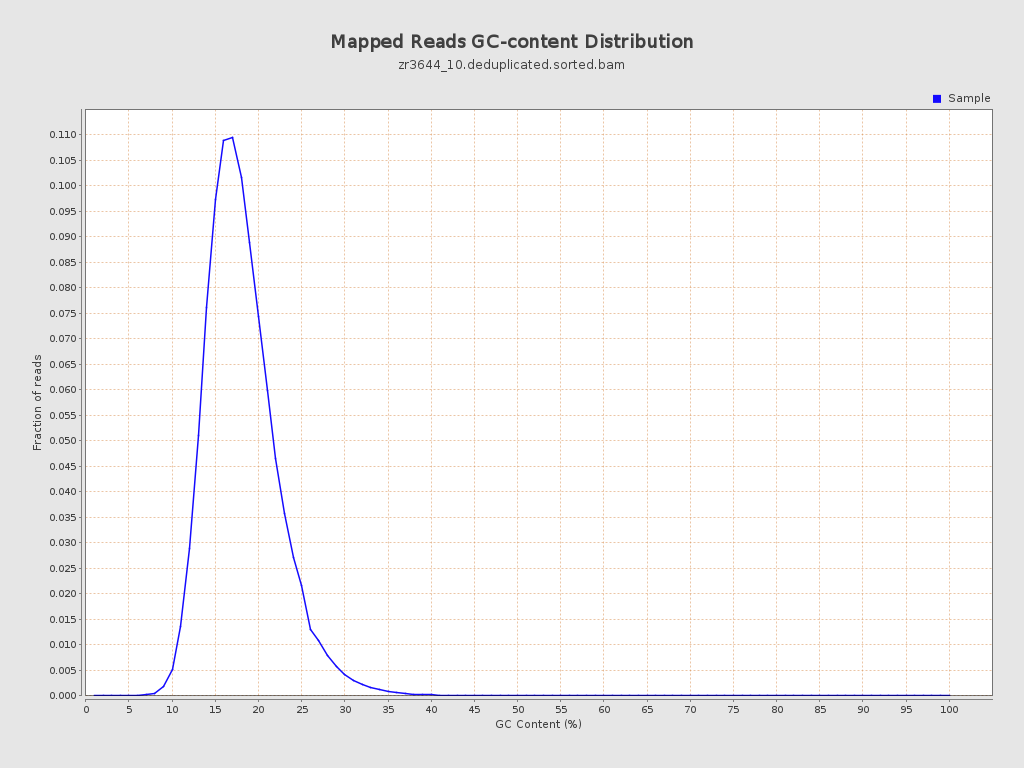
ACGT Content
| Number/percentage of A's | 2,475,984,566 / 40.94% |
| Number/percentage of C's | 539,185,855 / 8.92% |
| Number/percentage of T's | 2,501,043,116 / 41.36% |
| Number/percentage of G's | 530,951,086 / 8.78% |
| Number/percentage of N's | 47,327 / 0% |
| GC Percentage | 17.7% |
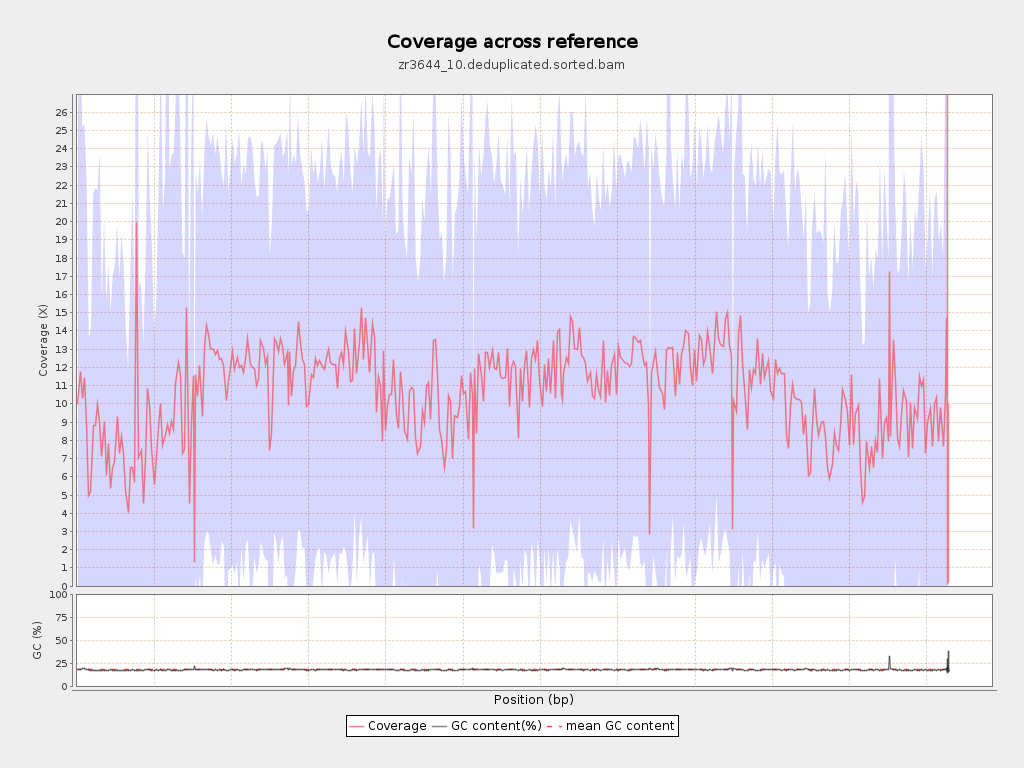
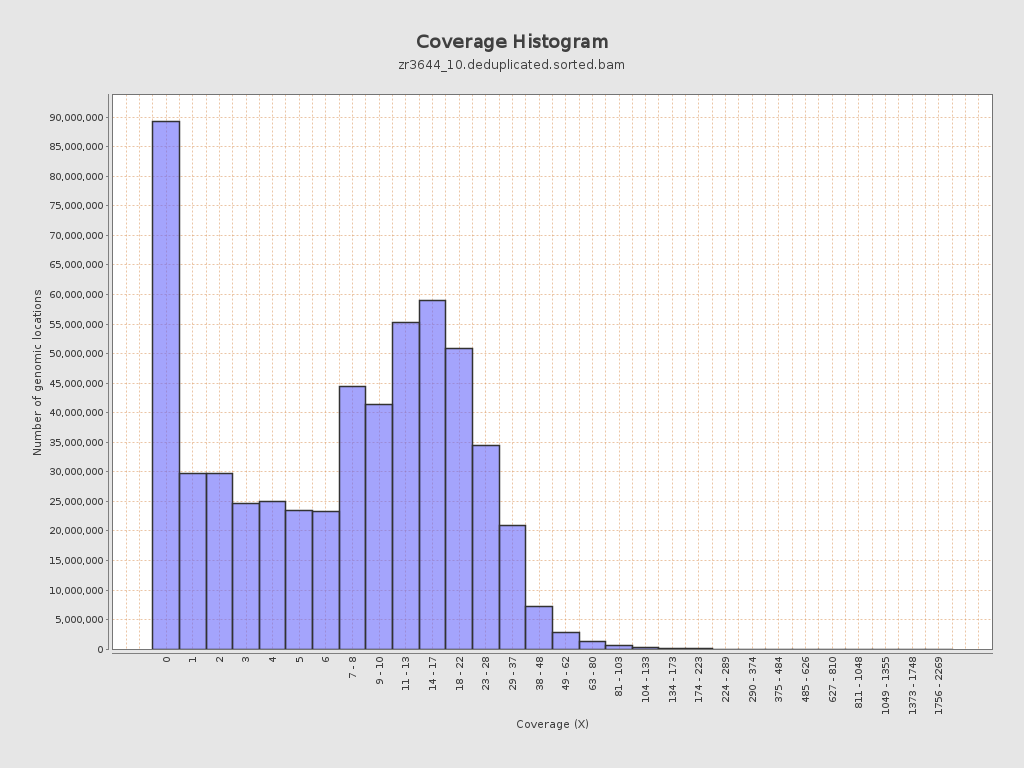
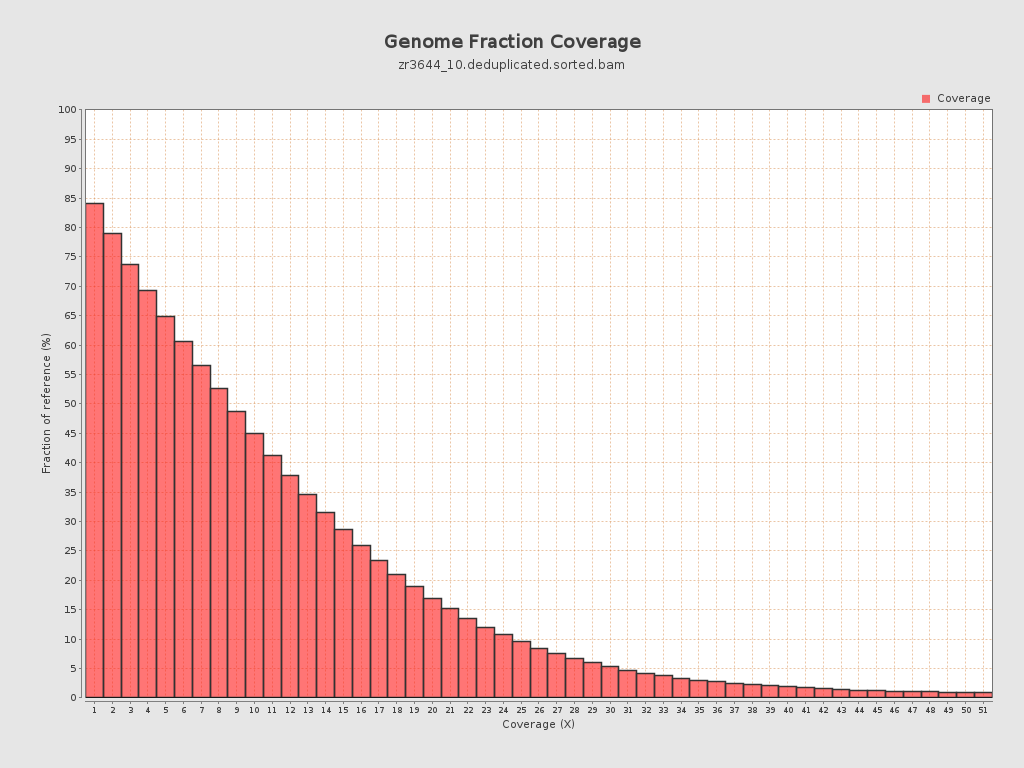
Coverage
| Mean | 10.7701 |
| Standard Deviation | 11.6988 |
| Mean (paired-end reads overlap ignored) | 7.65 |
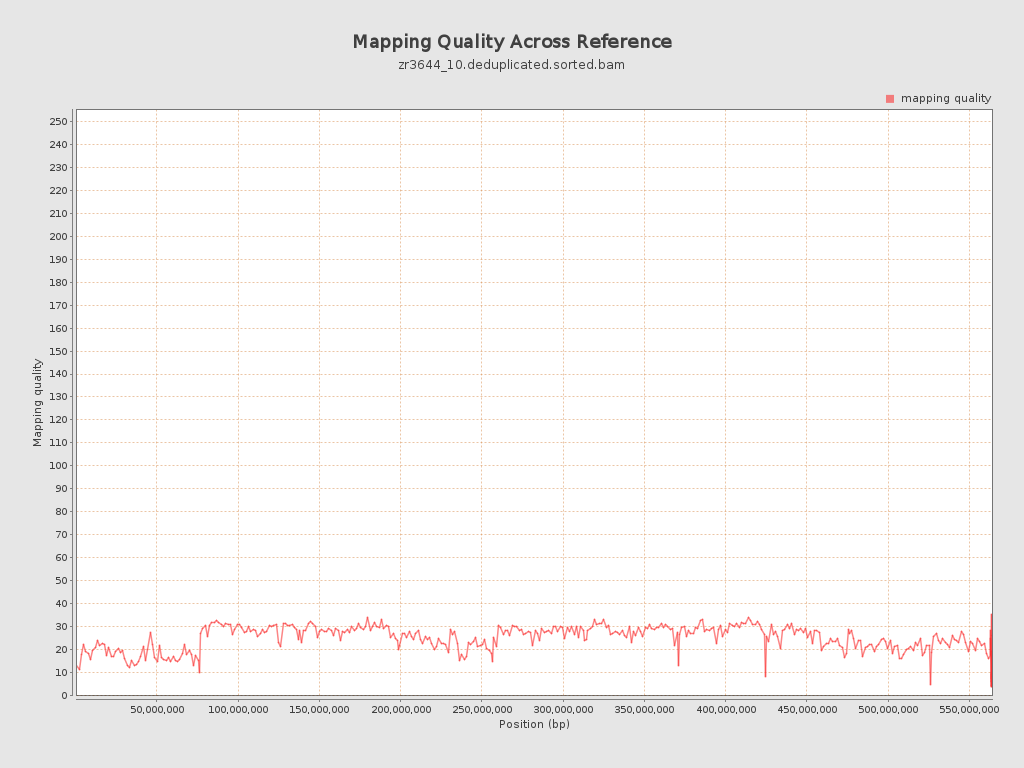
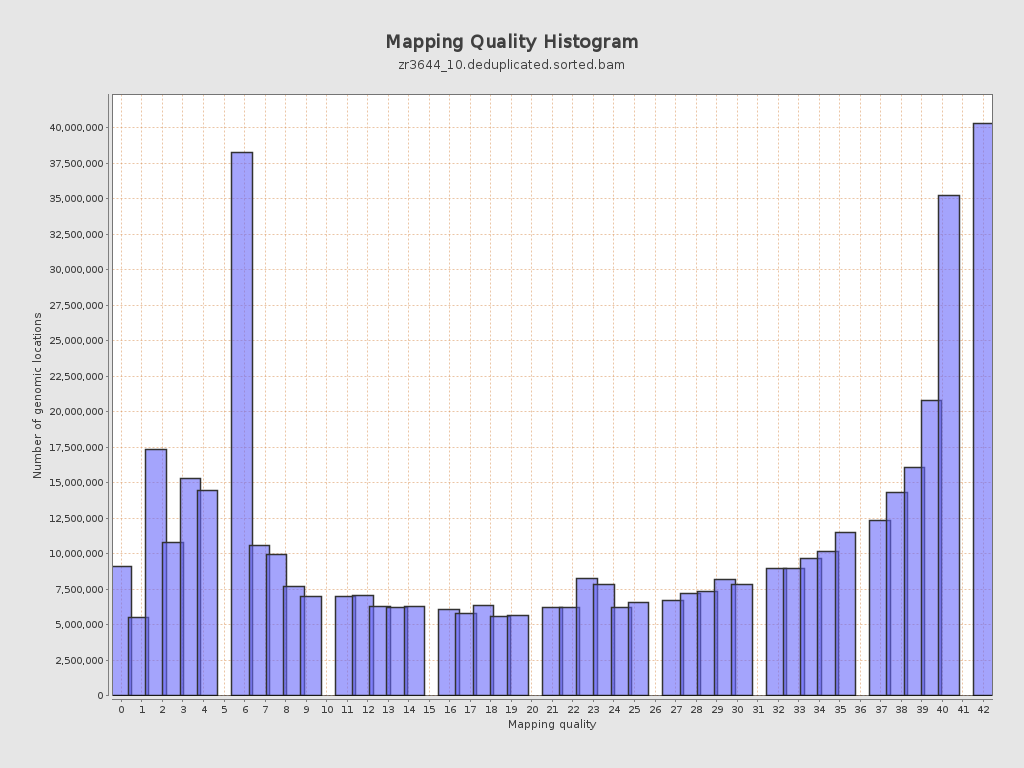
Mapping Quality
| Mean Mapping Quality | 24.67 |
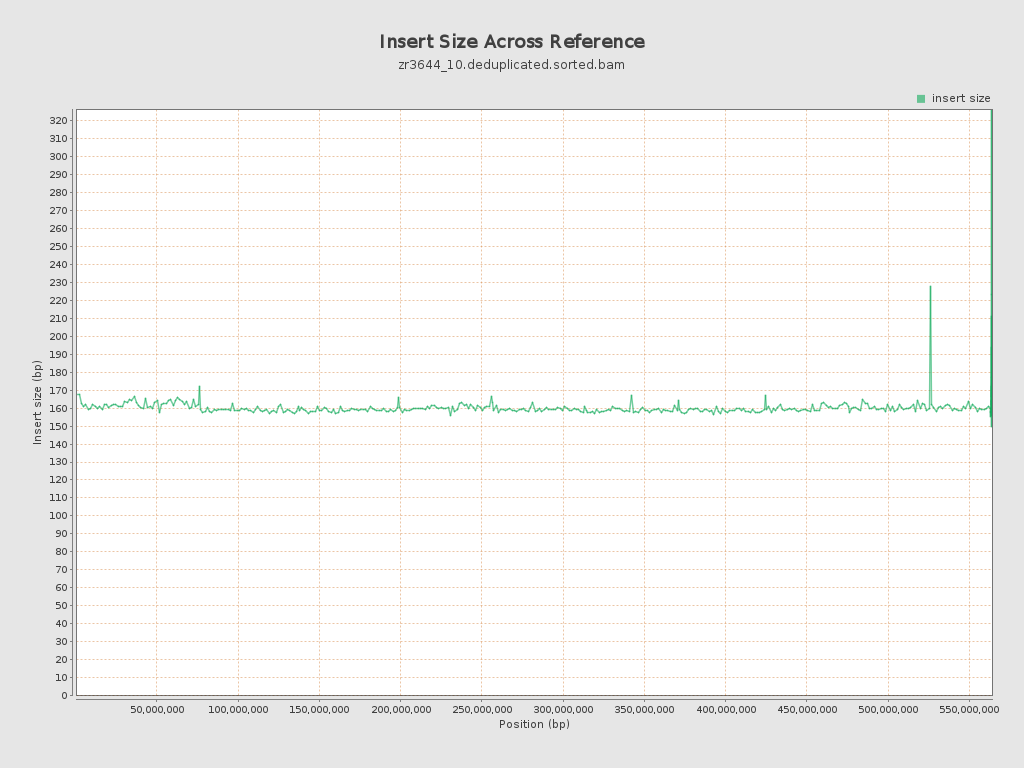
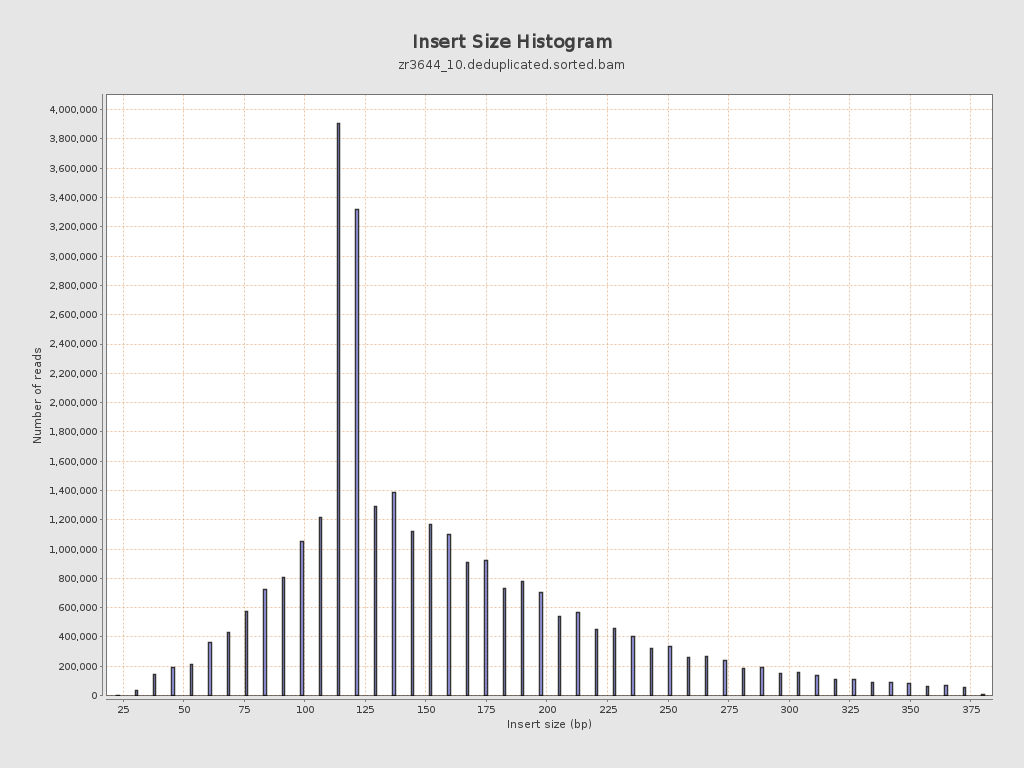
Insert size
| Mean | 159.62 |
| Standard Deviation | 70.51 |
| P25/Median/P75 | 117 / 137 / 190 |
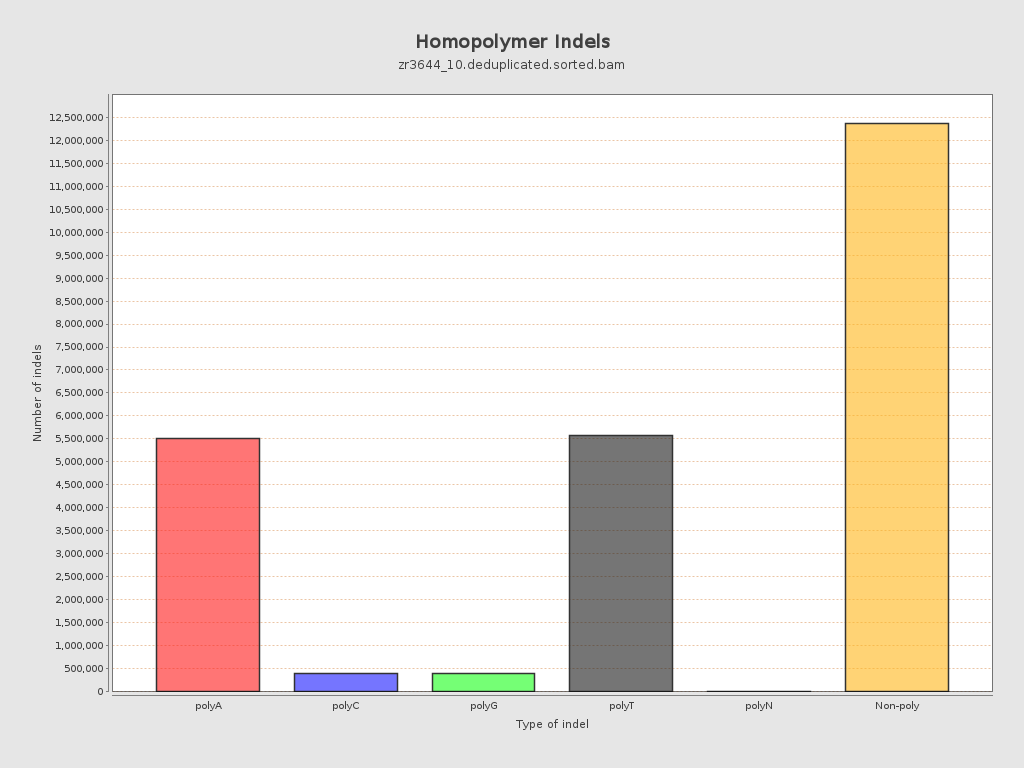
Mismatches and indels
| General error rate | 19.49% |
| Mismatches | 1,149,142,311 |
| Insertions | 12,803,428 |
| Mapped reads with at least one insertion | 16.77% |
| Deletions | 11,431,570 |
| Mapped reads with at least one deletion | 16.39% |
| Homopolymer indels | 48.96% |
Chromosome stats
| Name | Length | Mapped bases | Mean coverage | Standard deviation |
| NC_088853.1 | 76070991 | 640495269 | 8.4197 | 13.715 |
| NC_088854.1 | 61469542 | 745233927 | 12.1236 | 10.784 |
| NC_088855.1 | 61039741 | 746406554 | 12.2282 | 10.8925 |
| NC_088856.1 | 57946171 | 569816229 | 9.8335 | 12.1278 |
| NC_088857.1 | 57274926 | 672324176 | 11.7385 | 10.9916 |
| NC_088858.1 | 56905015 | 695048402 | 12.2142 | 10.6935 |
| NC_088859.1 | 53672946 | 679584383 | 12.6616 | 11.6008 |
| NC_088860.1 | 51133819 | 549740470 | 10.751 | 11.3888 |
| NC_088861.1 | 50364239 | 414269753 | 8.2255 | 10.7888 |
| NC_088862.1 | 37310742 | 357494722 | 9.5815 | 11.8725 |
| NW_027062568.1 | 15579 | 120222 | 7.7169 | 7.216 |
| NW_027062569.1 | 16498 | 219674 | 13.3152 | 16.324 |
| NW_027062570.1 | 4000 | 207094 | 51.7735 | 49.0071 |
| NW_027062571.1 | 36893 | 7465 | 0.2023 | 0.8891 |
| NW_027062572.1 | 51000 | 41959 | 0.8227 | 2.3342 |
| NW_027062573.1 | 2000 | 97330 | 48.665 | 47.7546 |
| NW_027062574.1 | 37061 | 3302 | 0.0891 | 0.5179 |
| NW_027062575.1 | 49428 | 398500 | 8.0622 | 15.4236 |
| NW_027062576.1 | 49232 | 192870 | 3.9176 | 8.1267 |
| NW_027062577.1 | 17087 | 146179 | 8.555 | 6.3136 |
| NW_027062578.1 | 34507 | 574168 | 16.6392 | 9.0637 |
| NW_027062579.1 | 64000 | 700211 | 10.9408 | 10.3552 |
| NW_027062580.1 | 24229 | 167827 | 6.9267 | 8.472 |
| NW_027062581.1 | 5000 | 50171 | 10.0342 | 11.2851 |
| NW_027062582.1 | 18808 | 147052 | 7.8186 | 5.7667 |
| NW_027062583.1 | 1000 | 227 | 0.227 | 0.4189 |
| NW_027062584.1 | 74000 | 16535 | 0.2234 | 1.7294 |
| NW_027062585.1 | 39334 | 203708 | 5.1789 | 6.1528 |
| NW_027062586.1 | 258015 | 464852 | 1.8016 | 5.3976 |
