Input data and parameters
QualiMap command line
| qualimap bamqc -bam zr3644_1.deduplicated.sorted.bam -nw 400 -hm 3 |
Alignment
| Command line: | "bismark -1 zr3644_1_R1_val_1_val_1_val_1.fq.gz -2 zr3644_1_R2_val_2_val_2_val_2.fq.gz --genome BismarkIndex --bam --score_min L,0,-0.8 --non_directional --prefix zr3644_1 --multicore 3" |
| Draw chromosome limits: | no |
| Analyze overlapping paired-end reads: | yes |
| Program: | Bismark (v0.24.2) |
| Analysis date: | Wed Apr 16 06:55:08 GMT 2025 |
| Size of a homopolymer: | 3 |
| Skip duplicate alignments: | no |
| Number of windows: | 400 |
| BAM file: | zr3644_1.deduplicated.sorted.bam |
Summary
Globals
| Reference size | 563,985,803 |
| Number of reads | 56,970,170 |
| Mapped reads | 56,970,170 / 100% |
| Unmapped reads | 0 / 0% |
| Mapped paired reads | 56,970,170 / 100% |
| Mapped reads, first in pair | 28,485,085 / 50% |
| Mapped reads, second in pair | 28,485,085 / 50% |
| Mapped reads, both in pair | 56,970,170 / 100% |
| Mapped reads, singletons | 0 / 0% |
| Secondary alignments | 0 |
| Read min/max/mean length | 20 / 115 / 104.83 |
| Overlapping read pairs | 24,674,126 / 86.62% |
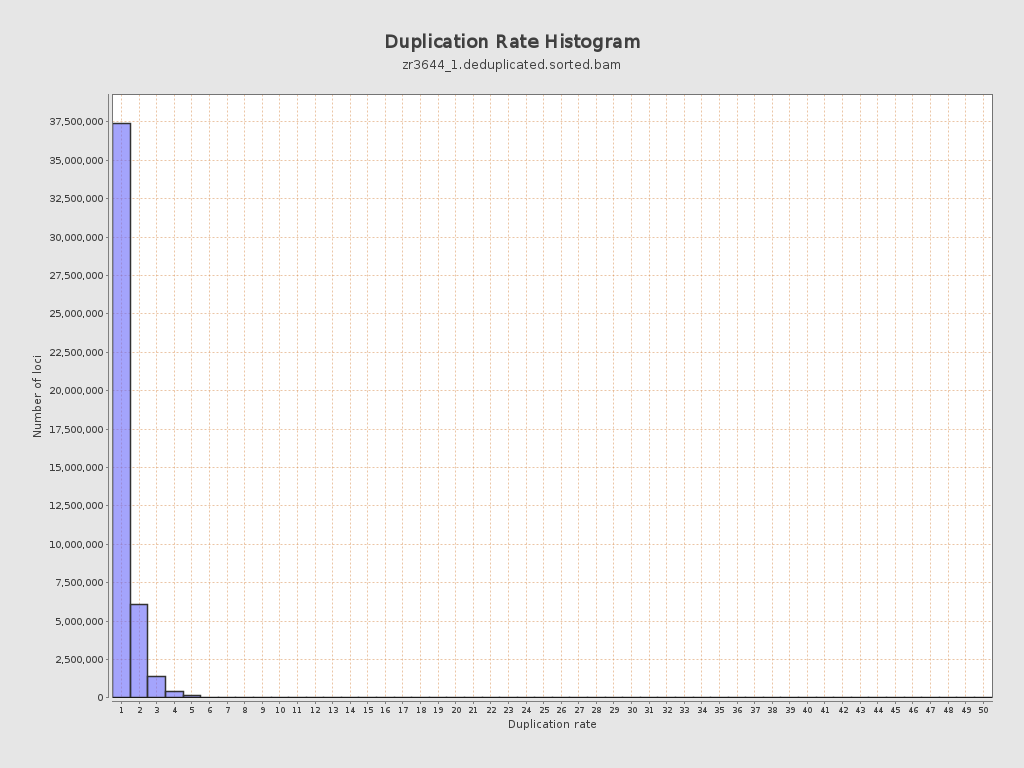
| Duplicated reads (estimated) | 11,428,255 / 20.06% |
| Duplication rate | 17.9% |
| Clipped reads | 0 / 0% |
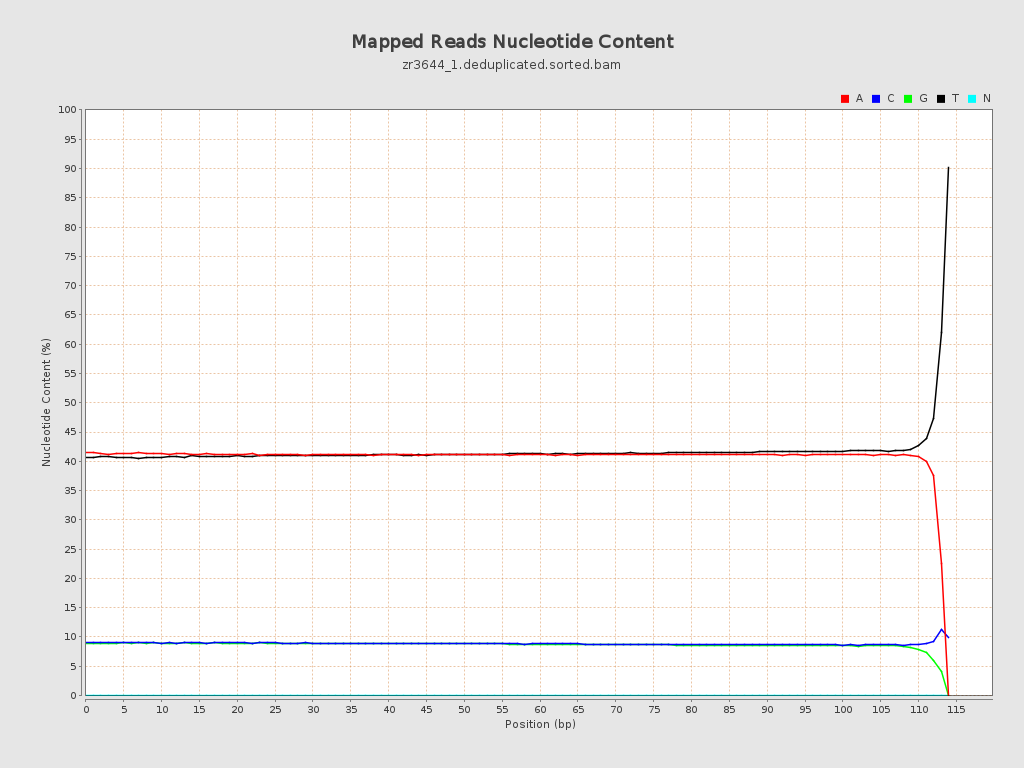
ACGT Content
| Number/percentage of A's | 2,435,573,174 / 41.01% |
| Number/percentage of C's | 526,471,850 / 8.87% |
| Number/percentage of T's | 2,458,720,826 / 41.4% |
| Number/percentage of G's | 517,829,811 / 8.72% |
| Number/percentage of N's | 44,882 / 0% |
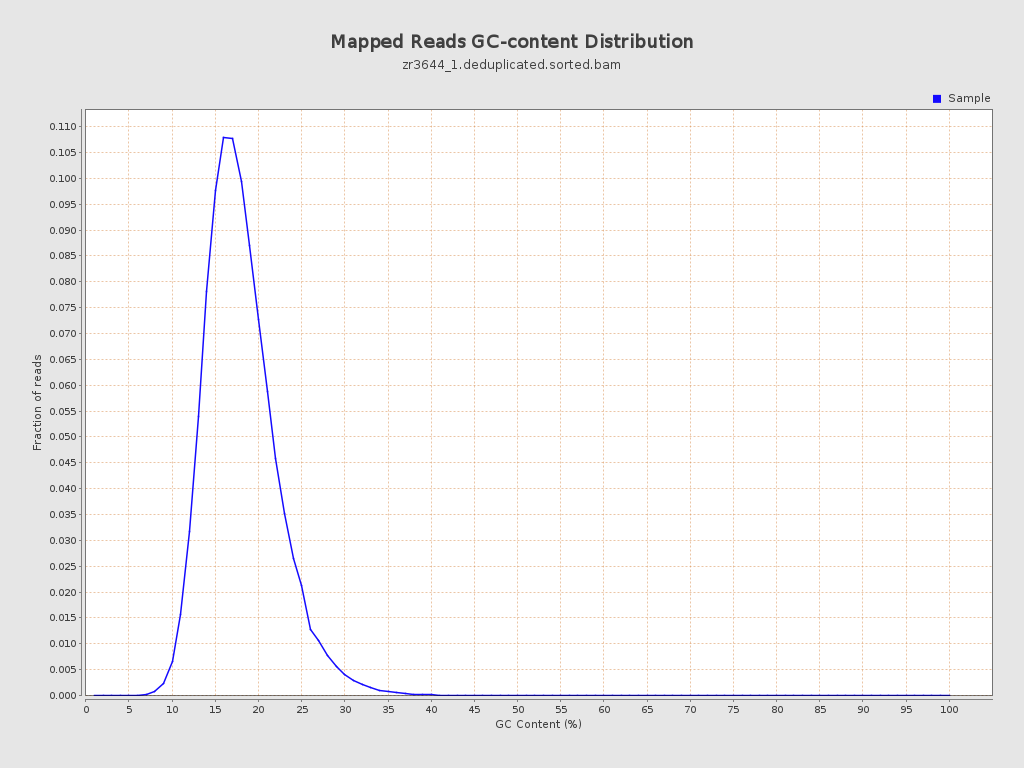
| GC Percentage | 17.58% |
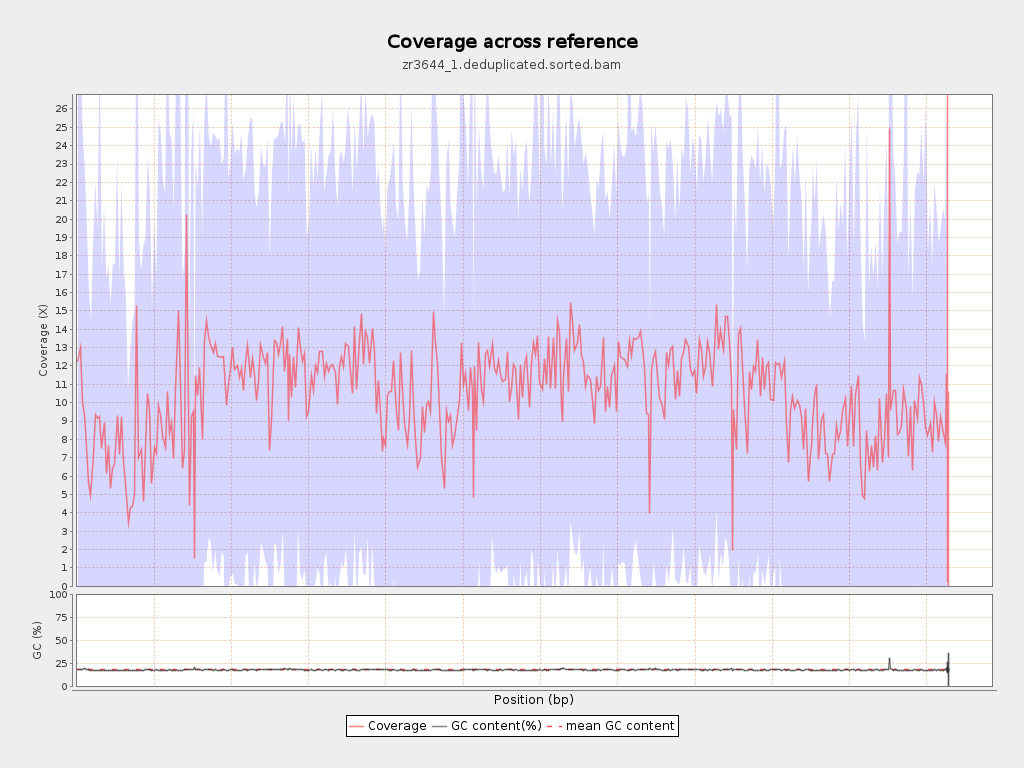
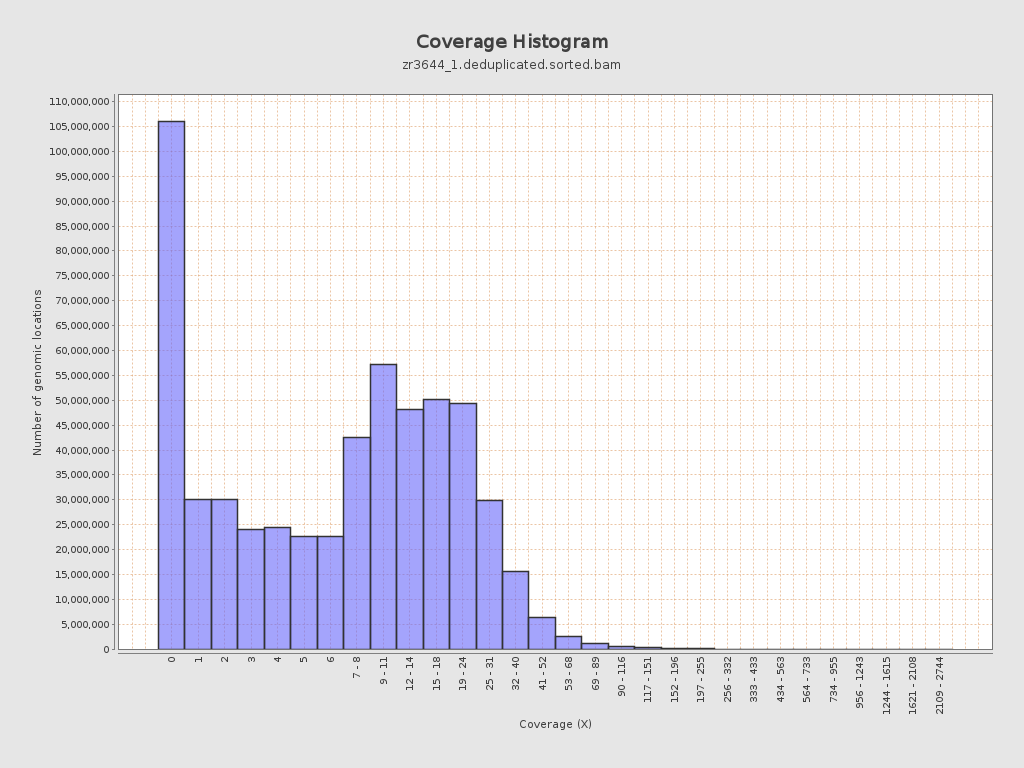
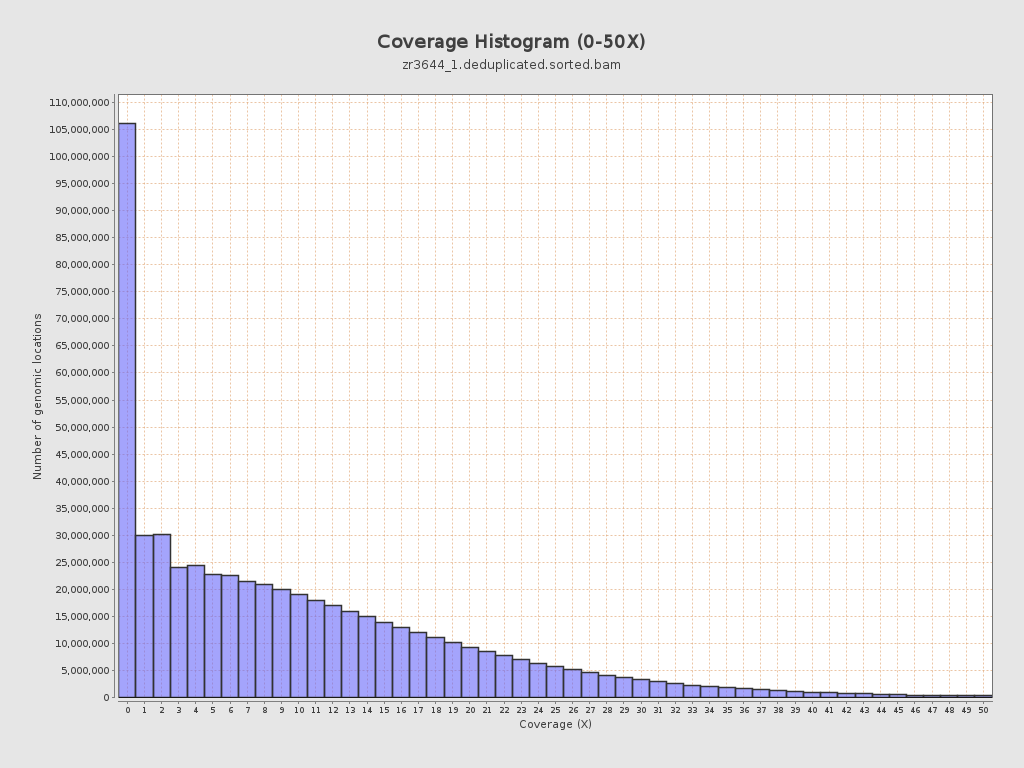
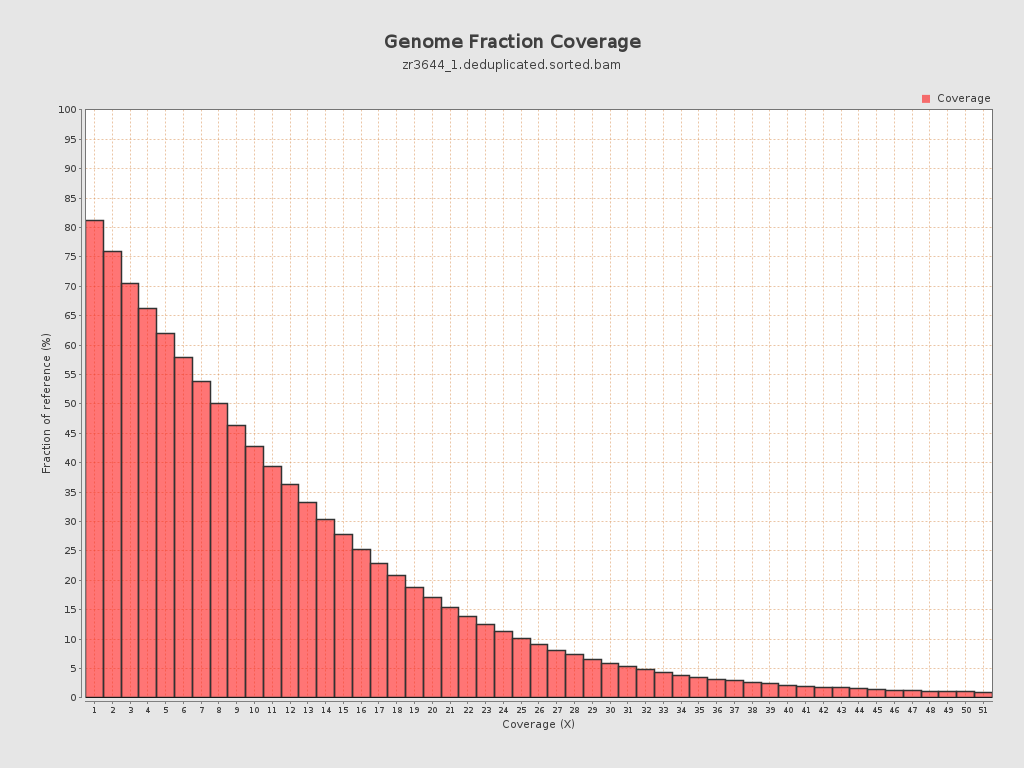
Coverage
| Mean | 10.5754 |
| Standard Deviation | 12.6075 |
| Mean (paired-end reads overlap ignored) | 7.41 |
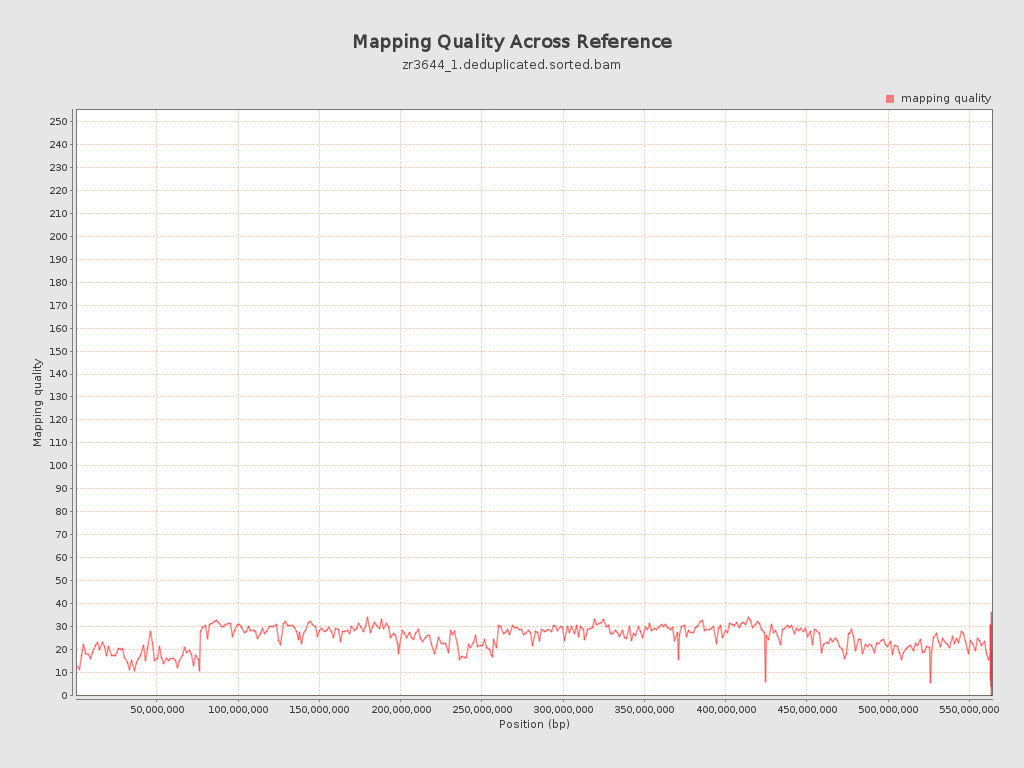
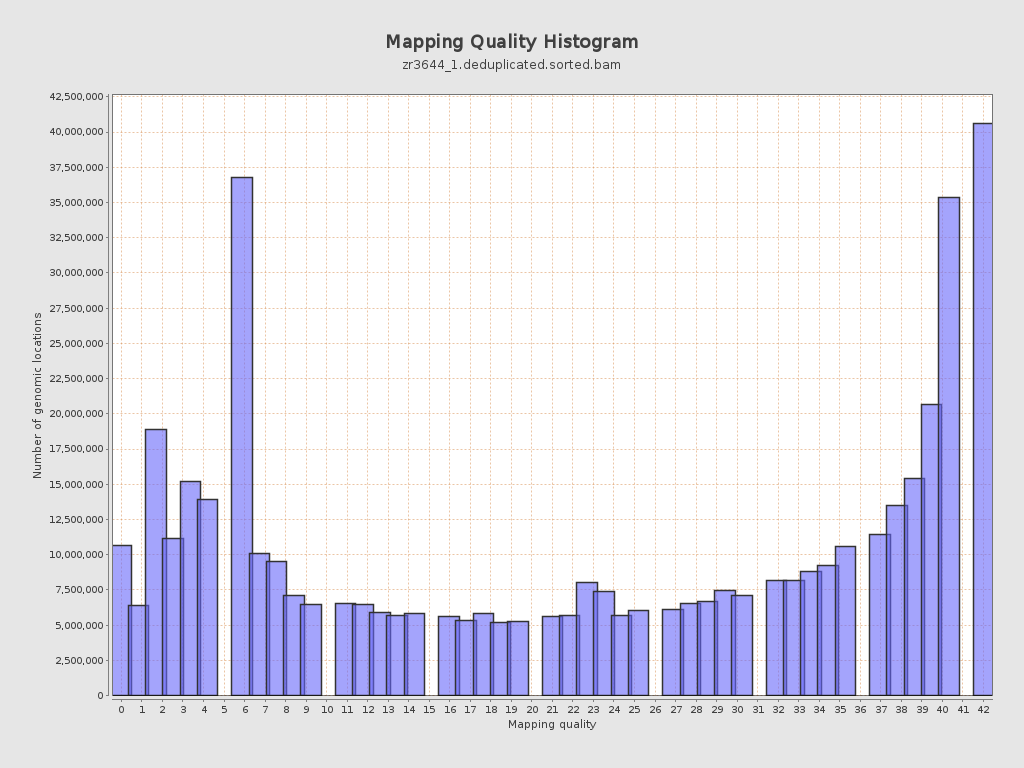
Mapping Quality
| Mean Mapping Quality | 24.62 |
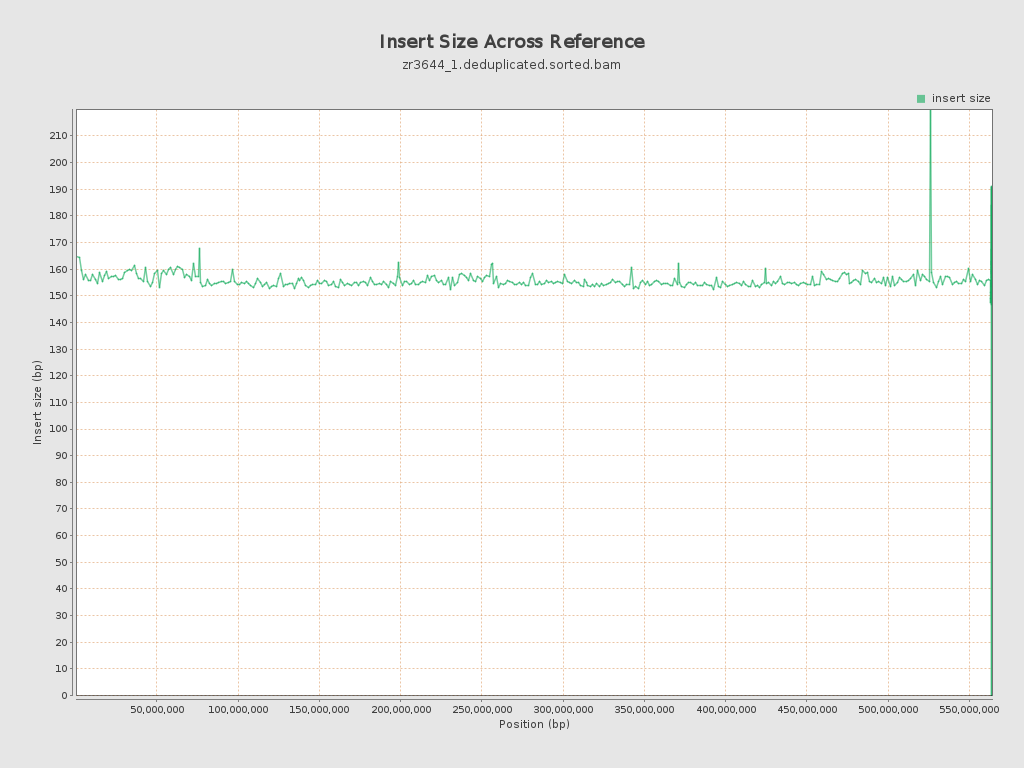
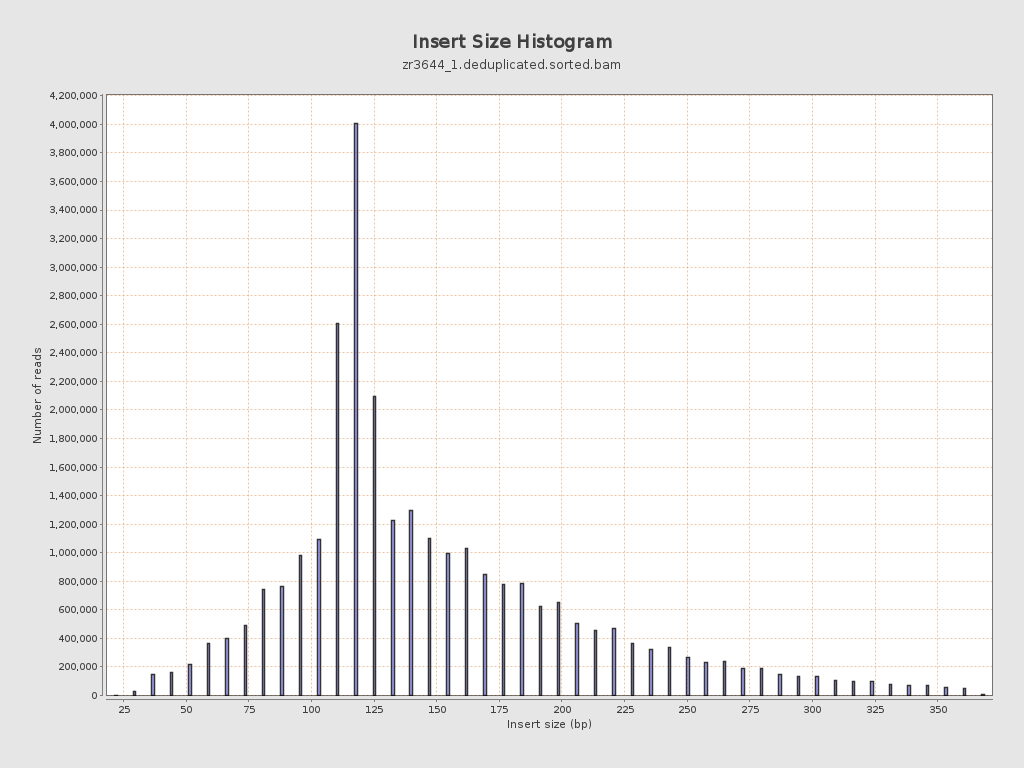
Insert size
| Mean | 155.35 |
| Standard Deviation | 67.45 |
| P25/Median/P75 | 116 / 133 / 184 |
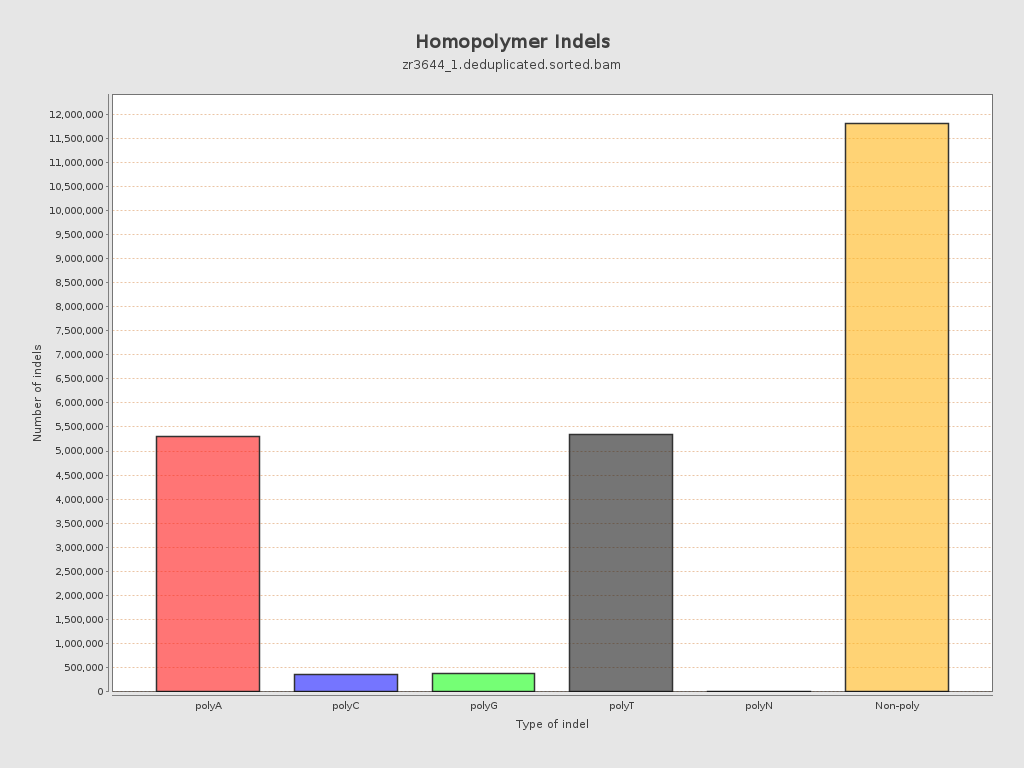
Mismatches and indels
| General error rate | 19.59% |
| Mismatches | 1,134,611,174 |
| Insertions | 12,421,519 |
| Mapped reads with at least one insertion | 16.56% |
| Deletions | 10,760,610 |
| Mapped reads with at least one deletion | 15.63% |
| Homopolymer indels | 49.05% |
Chromosome stats
| Name | Length | Mapped bases | Mean coverage | Standard deviation |
| NC_088853.1 | 76070991 | 631115793 | 8.2964 | 15.1478 |
| NC_088854.1 | 61469542 | 735079694 | 11.9584 | 11.8174 |
| NC_088855.1 | 61039741 | 725899562 | 11.8922 | 11.502 |
| NC_088856.1 | 57946171 | 570746153 | 9.8496 | 12.8472 |
| NC_088857.1 | 57274926 | 673882727 | 11.7658 | 12.3269 |
| NC_088858.1 | 56905015 | 680423713 | 11.9572 | 11.3899 |
| NC_088859.1 | 53672946 | 657532810 | 12.2507 | 11.1674 |
| NC_088860.1 | 51133819 | 532712800 | 10.418 | 12.5343 |
| NC_088861.1 | 50364239 | 411898178 | 8.1784 | 11.5574 |
| NC_088862.1 | 37310742 | 342031326 | 9.1671 | 13.6773 |
| NW_027062568.1 | 15579 | 118471 | 7.6045 | 9.255 |
| NW_027062569.1 | 16498 | 117782 | 7.1392 | 14.7839 |
| NW_027062570.1 | 4000 | 74041 | 18.5102 | 18.2847 |
| NW_027062571.1 | 36893 | 7155 | 0.1939 | 1.0821 |
| NW_027062572.1 | 51000 | 12400 | 0.2431 | 0.8 |
| NW_027062573.1 | 2000 | 63673 | 31.8365 | 17.6502 |
| NW_027062574.1 | 37061 | 9886 | 0.2667 | 1.0572 |
| NW_027062575.1 | 49428 | 355357 | 7.1894 | 17.1976 |
| NW_027062576.1 | 49232 | 206992 | 4.2044 | 8.5108 |
| NW_027062577.1 | 17087 | 146715 | 8.5864 | 6.7441 |
| NW_027062578.1 | 34507 | 560029 | 16.2294 | 9.7547 |
| NW_027062579.1 | 64000 | 278308 | 4.3486 | 10.4892 |
| NW_027062580.1 | 24229 | 202402 | 8.3537 | 9.7172 |
| NW_027062581.1 | 5000 | 19704 | 3.9408 | 7.3483 |
| NW_027062582.1 | 18808 | 199757 | 10.6209 | 11.2147 |
| NW_027062583.1 | 1000 | 0 | 0 | 0 |
| NW_027062584.1 | 74000 | 9701 | 0.1311 | 0.8252 |
| NW_027062585.1 | 39334 | 263581 | 6.7011 | 7.3057 |
| NW_027062586.1 | 258015 | 382169 | 1.4812 | 4.7657 |