Input data and parameters
QualiMap command line
| qualimap bamqc -bam /Users/strigg/Desktop/20200429/Sealice_F2_S22_R1_001_val_1_bismark_bt2_pe.deduplicated.sorted.bam -nw 400 -hm 3 |
Alignment
| Command line: | "bismark --score_min L,0,-0.6 -p 4 --non_directional --genome /gscratch/srlab/strigg/data/Caligus/GENOMES -1 /gscratch/scrubbed/strigg/analyses/20200427/TG_PE_FASTQS/cat_lanes/Sealice_F2_S22_R1_001_val_1.fq.gz -2 /gscratch/scrubbed/strigg/analyses/20200427/TG_PE_FASTQS/cat_lanes/Sealice_F2_S22_R2_001_val_2.fq.gz" |
| Draw chromosome limits: | no |
| Analyze overlapping paired-end reads: | no |
| Program: | Bismark (v0.22.3) |
| Analysis date: | Wed Apr 29 19:05:07 PDT 2020 |
| Size of a homopolymer: | 3 |
| Skip duplicate alignments: | no |
| Number of windows: | 400 |
| BAM file: | /Users/strigg/Desktop/20200429/Sealice_F2_S22_R1_001_val_1_bismark_bt2_pe.deduplicated.sorted.bam |
Summary
Globals
| Reference size | 506,970,227 |
| Number of reads | 52,851,202 |
| Mapped reads | 52,851,202 / 100% |
| Unmapped reads | 0 / 0% |
| Mapped paired reads | 52,851,202 / 100% |
| Mapped reads, first in pair | 26,425,601 / 50% |
| Mapped reads, second in pair | 26,425,601 / 50% |
| Mapped reads, both in pair | 52,851,202 / 100% |
| Mapped reads, singletons | 0 / 0% |
| Read min/max/mean length | 20 / 130 / 103.31 |
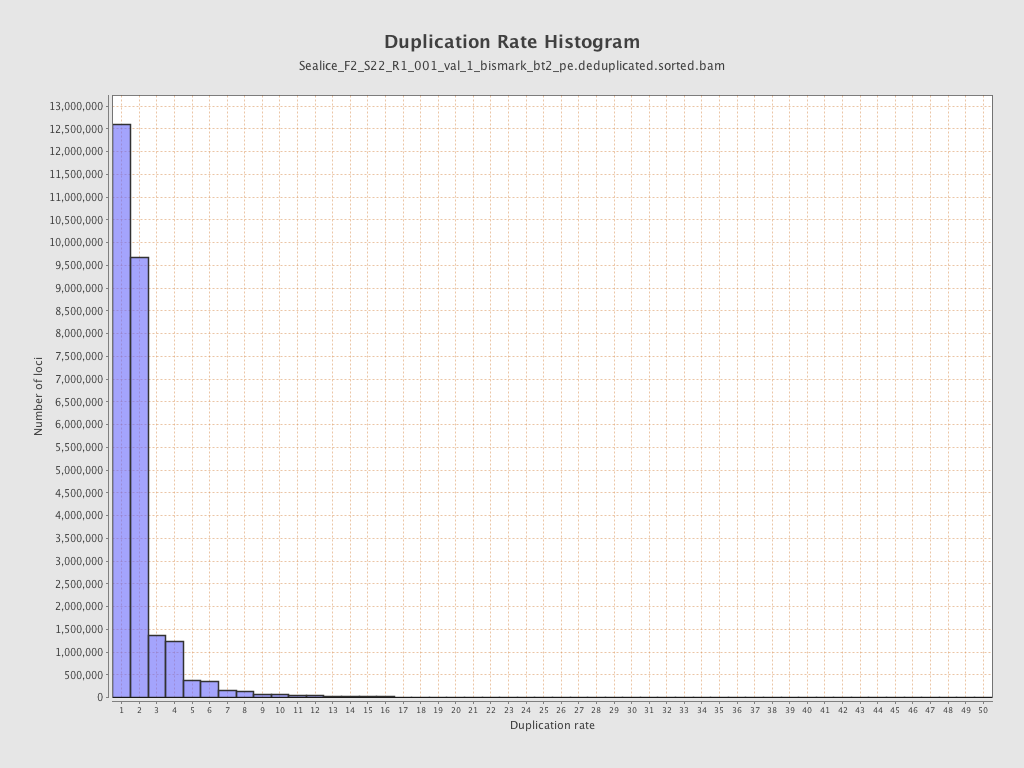
| Duplicated reads (estimated) | 26,598,716 / 50.33% |
| Duplication rate | 51.98% |
| Clipped reads | 0 / 0% |
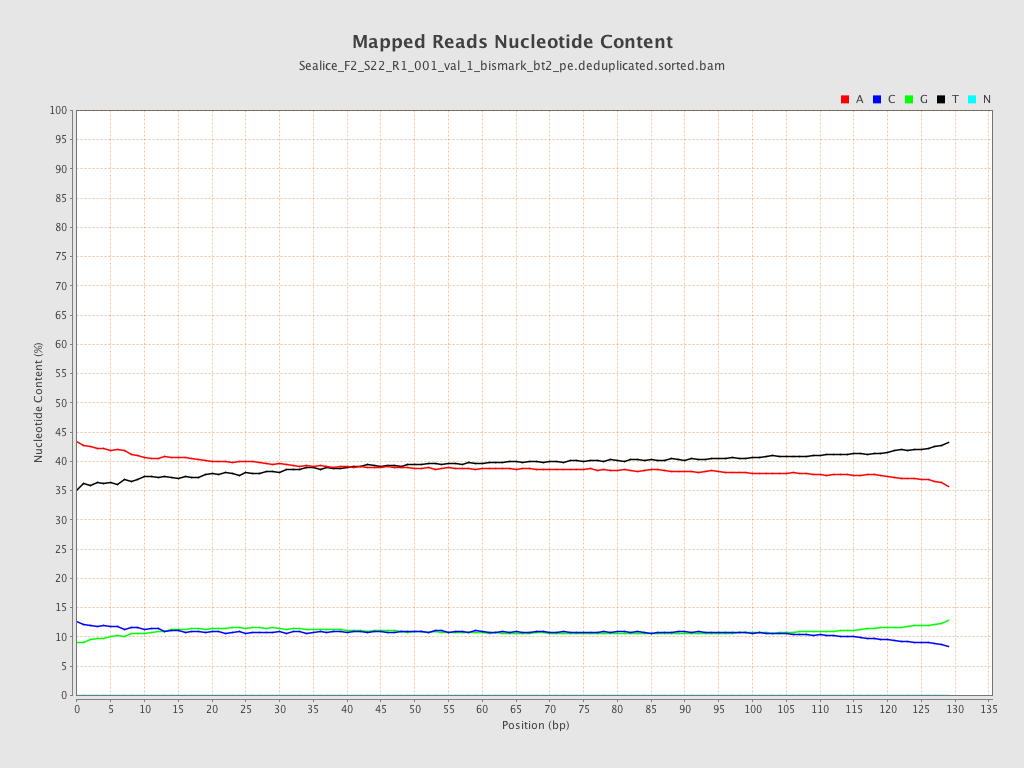
ACGT Content
| Number/percentage of A's | 2,115,706,099 / 39.17% |
| Number/percentage of C's | 583,259,551 / 10.8% |
| Number/percentage of T's | 2,115,926,575 / 39.17% |
| Number/percentage of G's | 586,828,841 / 10.86% |
| Number/percentage of N's | 37,214 / 0% |
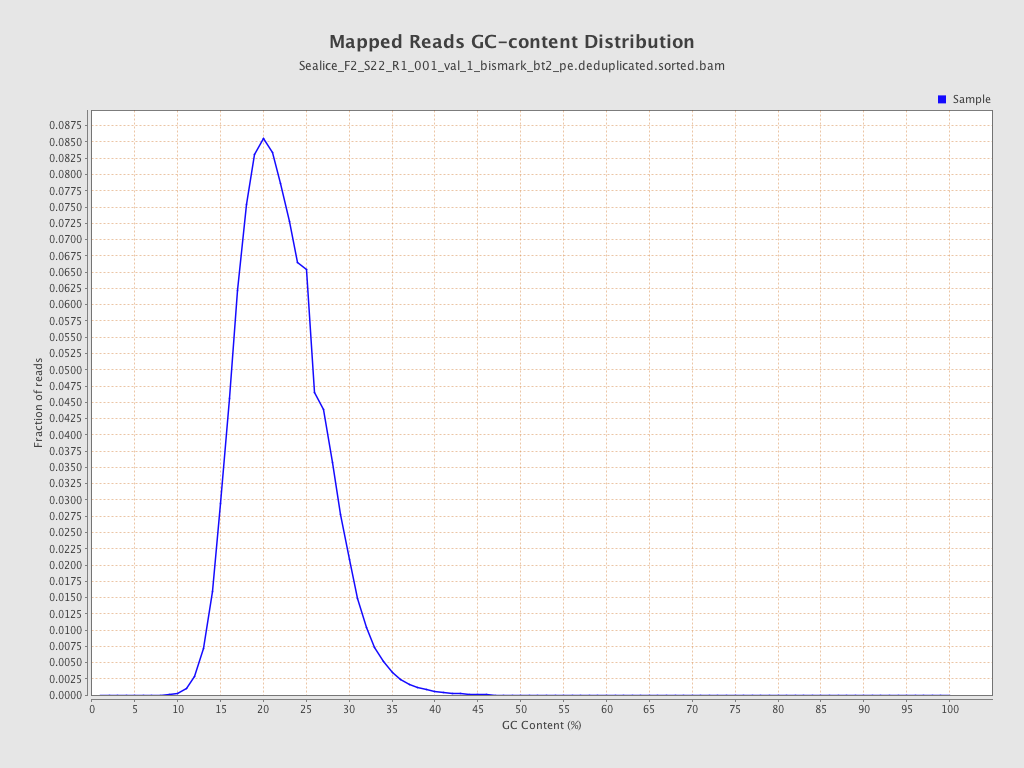
| GC Percentage | 21.66% |
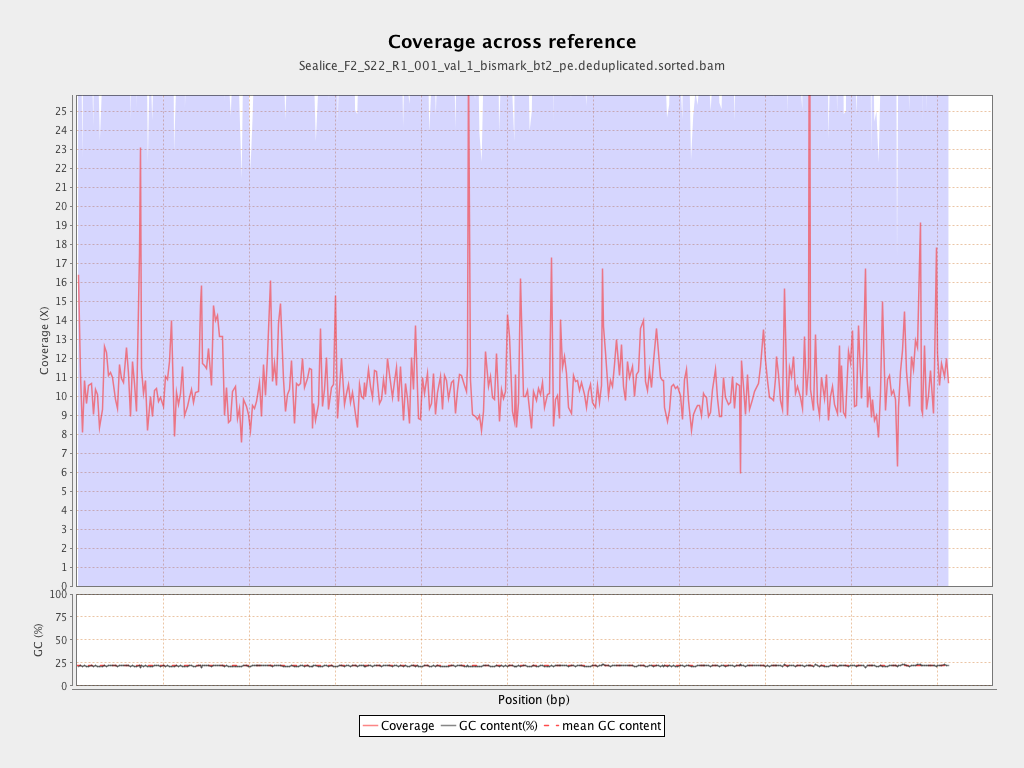
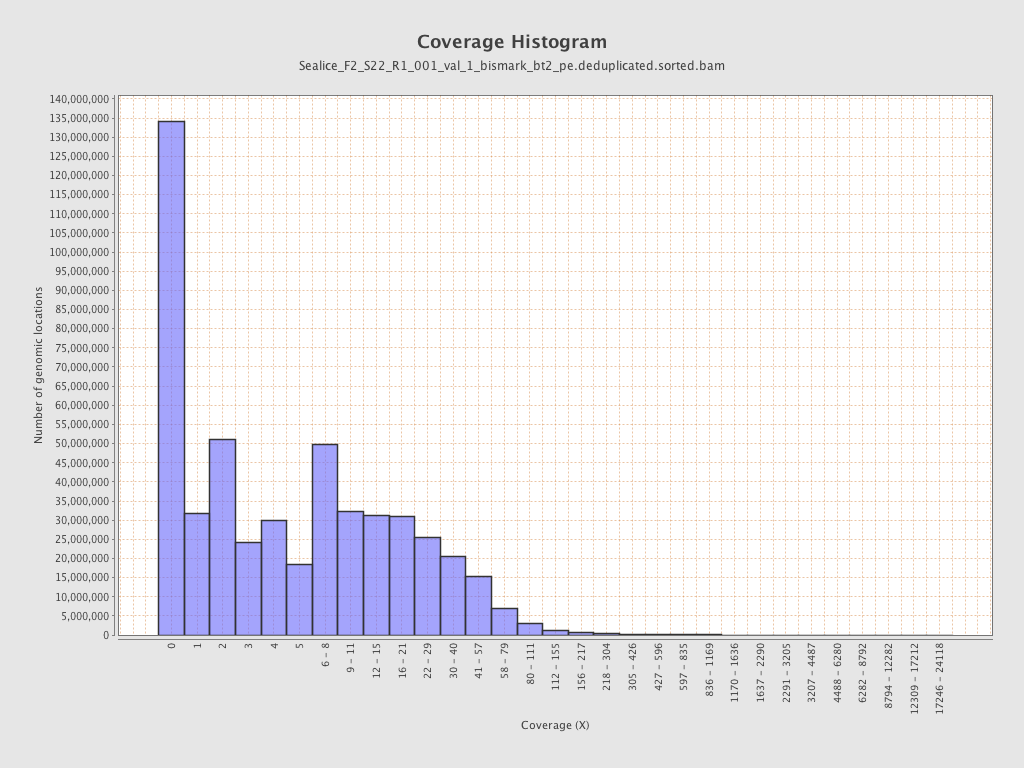
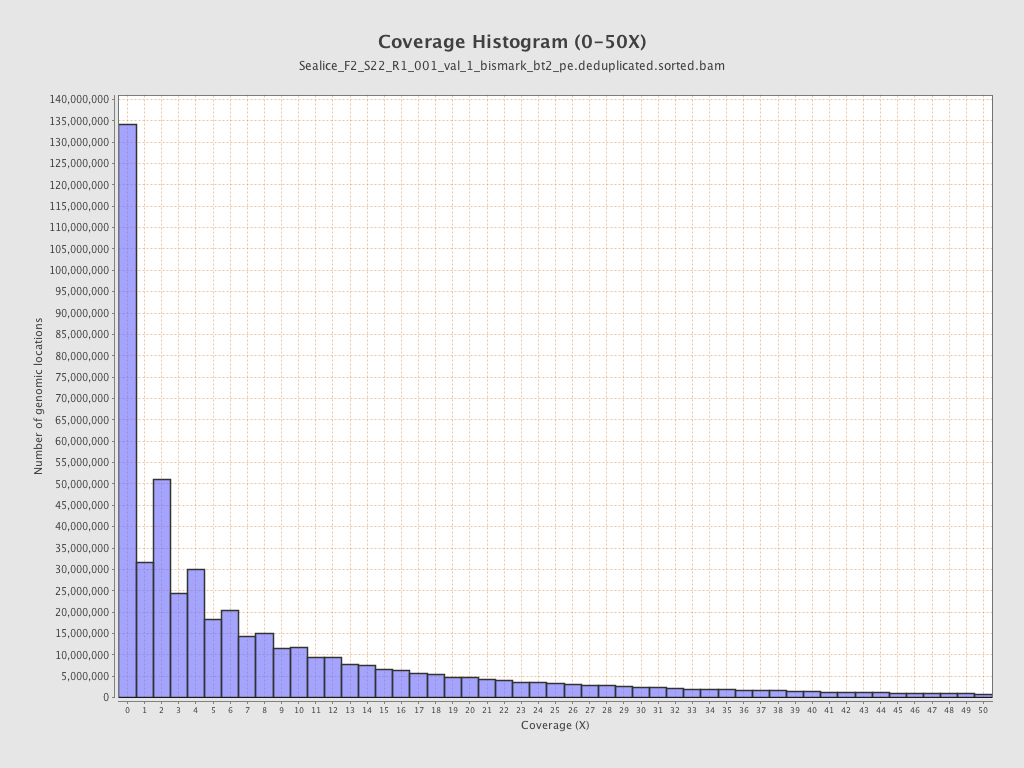
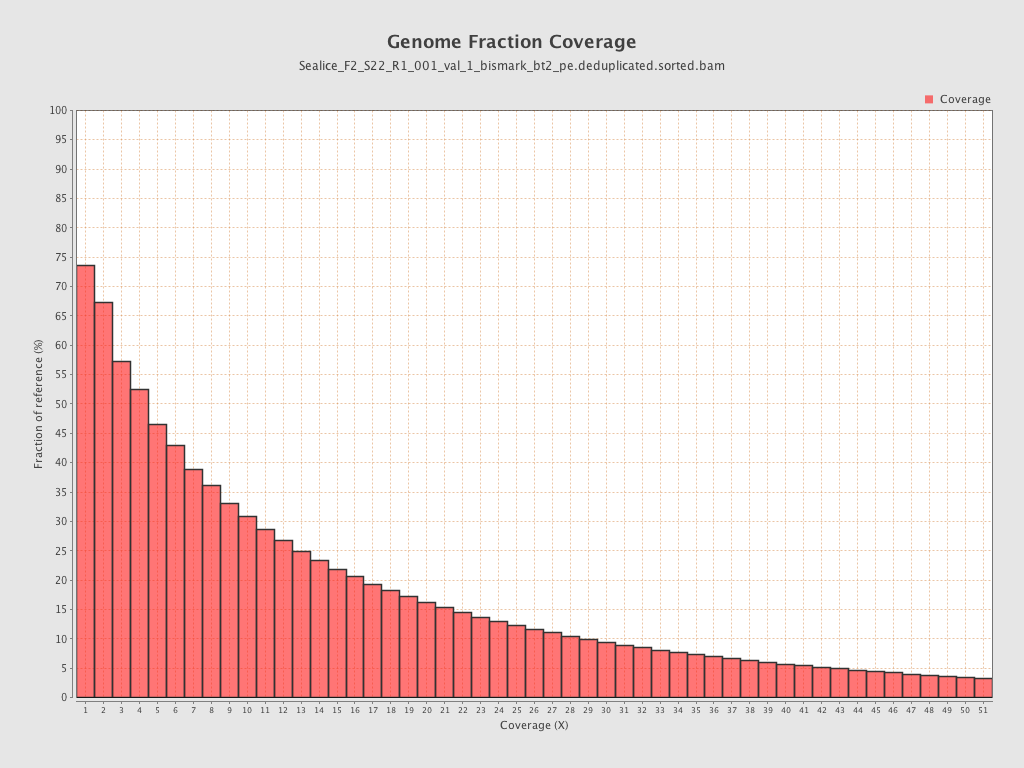
Coverage
| Mean | 10.698 |
| Standard Deviation | 39.3661 |
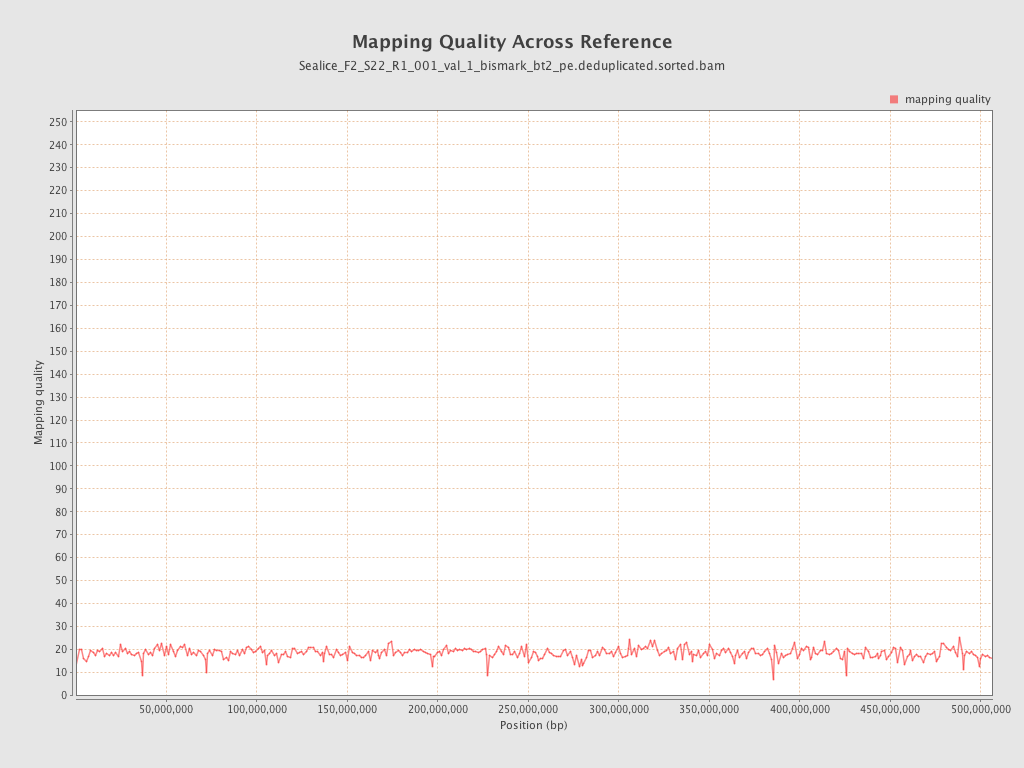
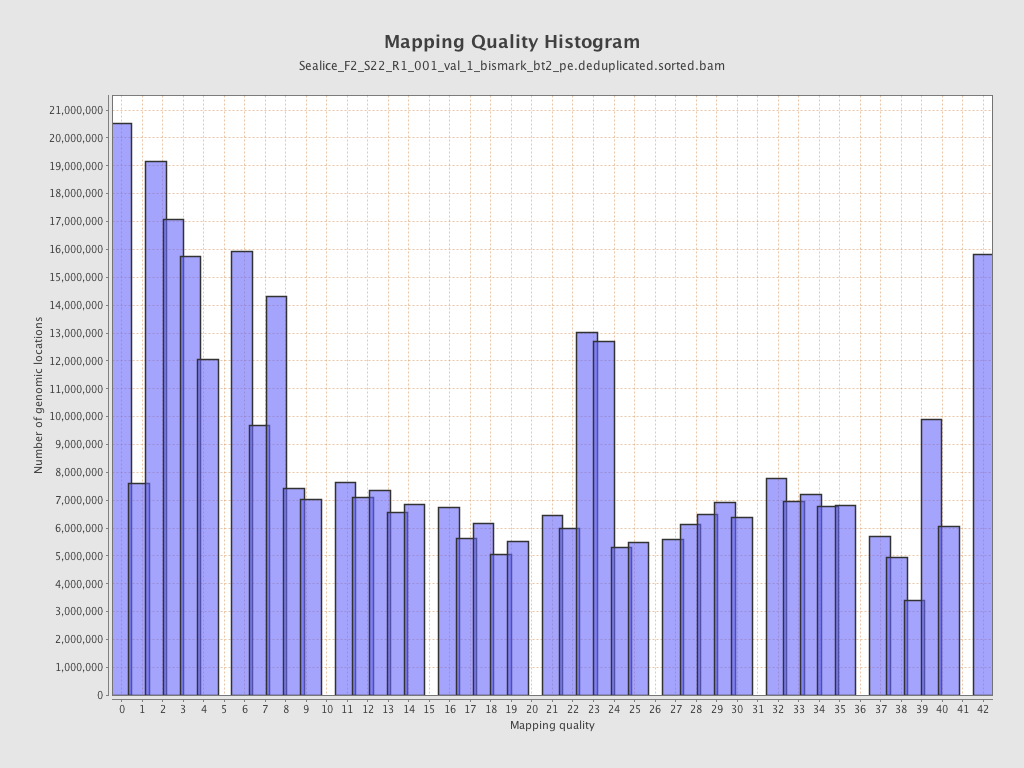
Mapping Quality
| Mean Mapping Quality | 18.31 |
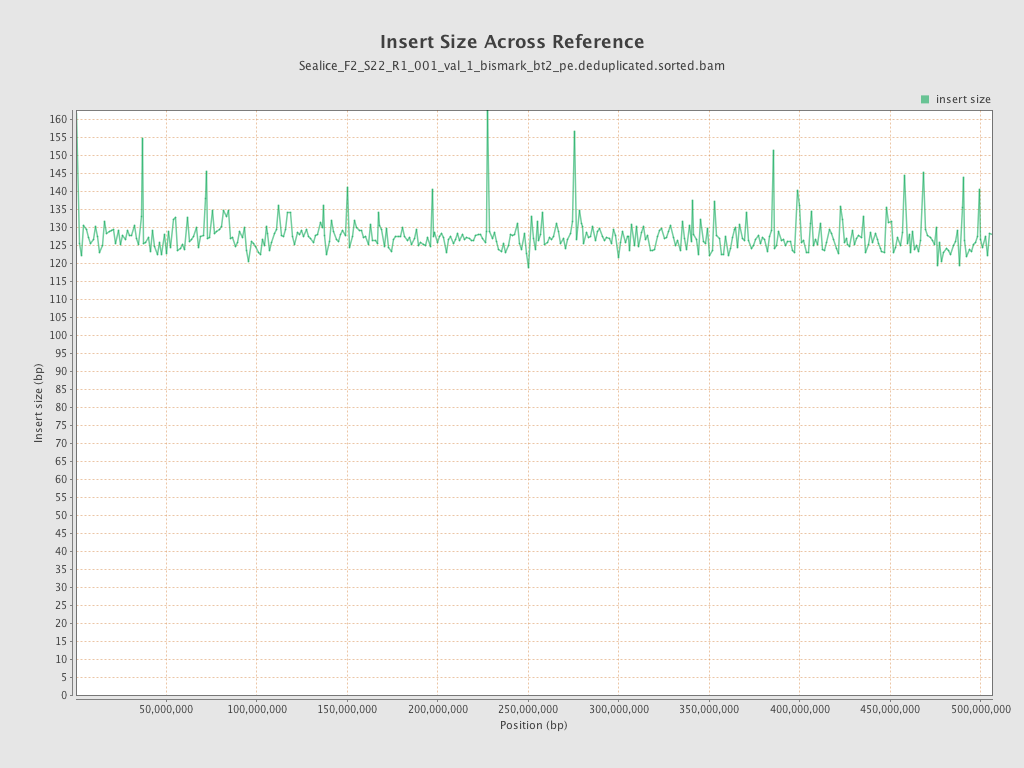
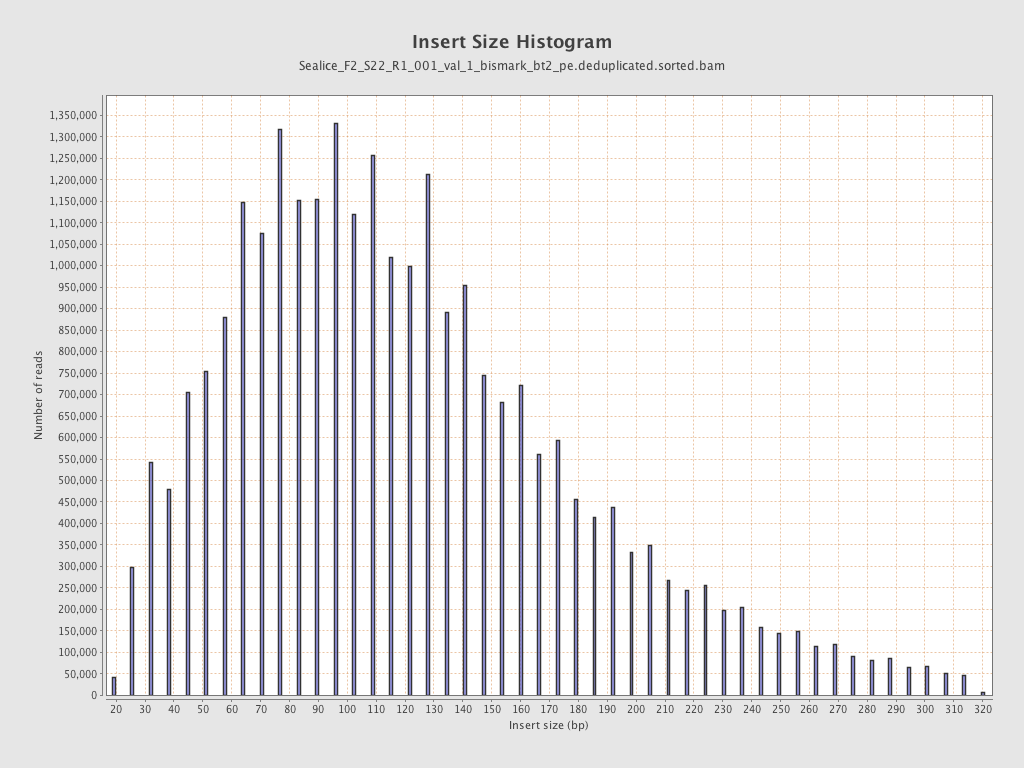
Insert size
| Mean | 128.08 |
| Standard Deviation | 67.81 |
| P25/Median/P75 | 80 / 115 / 160 |
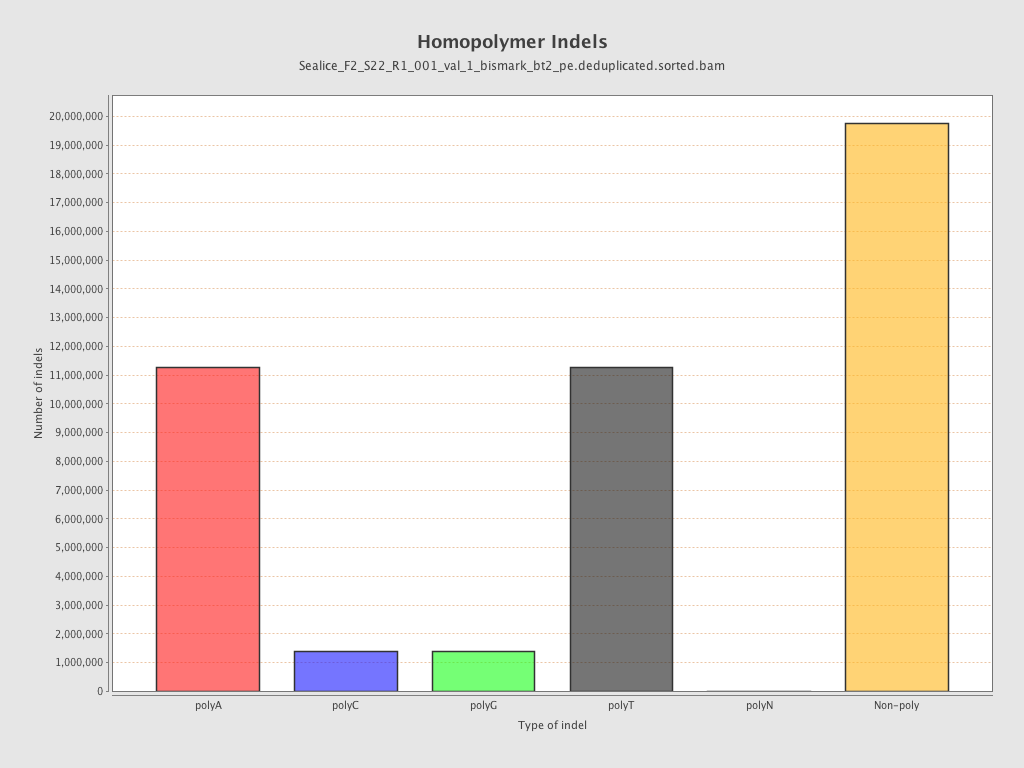
Mismatches and indels
| General error rate | 22.29% |
| Mismatches | 1,150,228,632 |
| Insertions | 31,916,330 |
| Mapped reads with at least one insertion | 39.94% |
| Deletions | 13,183,016 |
| Mapped reads with at least one deletion | 20.88% |
| Homopolymer indels | 56.21% |
Chromosome stats
| Name | Length | Mapped bases | Mean coverage | Standard deviation |
| Cr_scaffold0000001 | 36897007 | 404936863 | 10.9748 | 33.0964 |
| Cr_scaffold0000002 | 35124817 | 362600191 | 10.3232 | 31.3745 |
| Cr_scaffold0000003 | 33138466 | 352323453 | 10.6319 | 30.8397 |
| Cr_scaffold0000004 | 31456035 | 352846366 | 11.2171 | 30.6738 |
| Cr_scaffold0000005 | 30612693 | 315959864 | 10.3212 | 23.5614 |
| Cr_scaffold0000006 | 30259679 | 321335601 | 10.6193 | 23.2171 |
| Cr_scaffold0000007 | 29872177 | 306410488 | 10.2574 | 24.0582 |
| Cr_scaffold0000008 | 27803016 | 297609720 | 10.7042 | 66.7805 |
| Cr_scaffold0000009 | 25126635 | 262593429 | 10.4508 | 27.2482 |
| Cr_scaffold0000010 | 24815513 | 261394168 | 10.5335 | 24.9593 |
| Cr_scaffold0000011 | 35794548 | 414241160 | 11.5727 | 22.8389 |
| Cr_scaffold0000012 | 22957860 | 222970252 | 9.7122 | 17.7137 |
| Cr_scaffold0000013 | 21502856 | 213757476 | 9.9409 | 18.6512 |
| Cr_scaffold0000014 | 21148584 | 225352401 | 10.6557 | 35.4431 |
| Cr_scaffold0000015 | 19091682 | 209103661 | 10.9526 | 54.8611 |
| Cr_scaffold0000016 | 18525937 | 196801680 | 10.623 | 73.4493 |
| Cr_scaffold0000017 | 17562062 | 198184660 | 11.2848 | 92.4514 |
| Cr_scaffold0000018 | 14680182 | 149310118 | 10.1709 | 31.1006 |
| Cr_scaffold0000019 | 14290452 | 175609581 | 12.2886 | 57.1096 |
| Cr_scaffold0000020 | 8286978 | 86196812 | 10.4015 | 30.0225 |
| Cr_scaffold0000021 | 8023048 | 94023759 | 11.7192 | 24.9187 |