Input data and parameters
QualiMap command line
| qualimap bamqc -bam /Users/strigg/Desktop/20200429/Sealice_F1_S20_R1_001_val_1_bismark_bt2_pe.deduplicated.sorted.bam -nw 400 -hm 3 |
Alignment
| Command line: | "bismark --score_min L,0,-0.6 -p 4 --non_directional --genome /gscratch/srlab/strigg/data/Caligus/GENOMES -1 /gscratch/scrubbed/strigg/analyses/20200427/TG_PE_FASTQS/cat_lanes/Sealice_F1_S20_R1_001_val_1.fq.gz -2 /gscratch/scrubbed/strigg/analyses/20200427/TG_PE_FASTQS/cat_lanes/Sealice_F1_S20_R2_001_val_2.fq.gz" |
| Draw chromosome limits: | no |
| Analyze overlapping paired-end reads: | no |
| Program: | Bismark (v0.22.3) |
| Analysis date: | Wed Apr 29 19:00:10 PDT 2020 |
| Size of a homopolymer: | 3 |
| Skip duplicate alignments: | no |
| Number of windows: | 400 |
| BAM file: | /Users/strigg/Desktop/20200429/Sealice_F1_S20_R1_001_val_1_bismark_bt2_pe.deduplicated.sorted.bam |
Summary
Globals
| Reference size | 506,970,227 |
| Number of reads | 78,560,122 |
| Mapped reads | 78,560,122 / 100% |
| Unmapped reads | 0 / 0% |
| Mapped paired reads | 78,560,122 / 100% |
| Mapped reads, first in pair | 39,280,061 / 50% |
| Mapped reads, second in pair | 39,280,061 / 50% |
| Mapped reads, both in pair | 78,560,122 / 100% |
| Mapped reads, singletons | 0 / 0% |
| Read min/max/mean length | 20 / 130 / 106.93 |
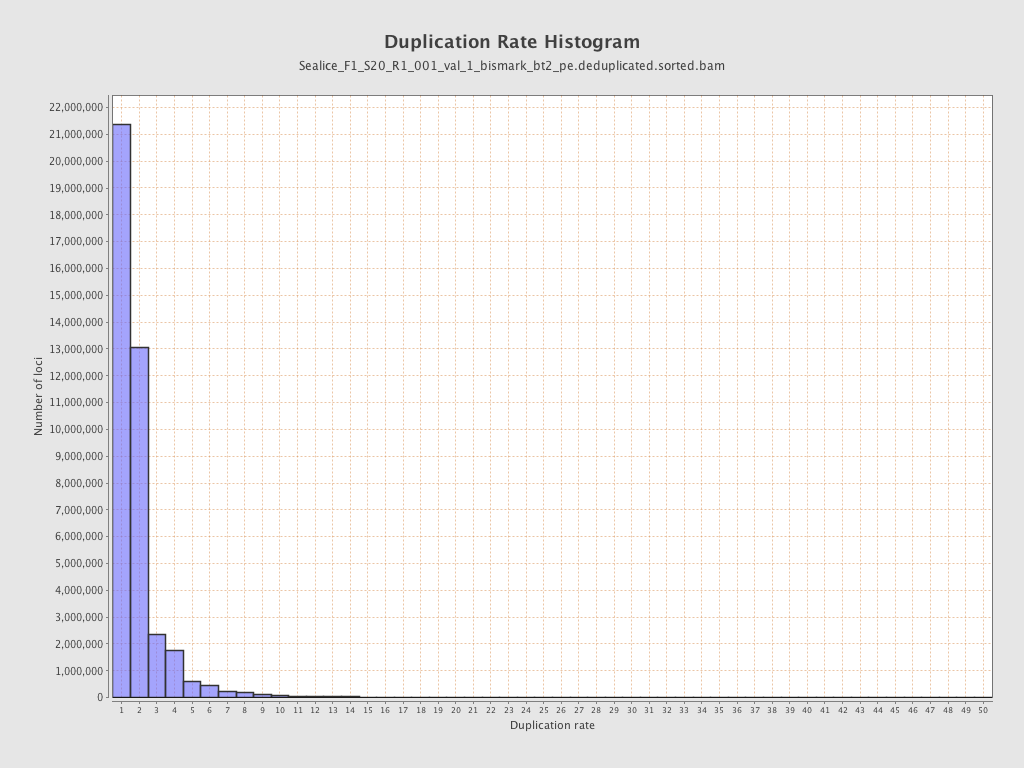
| Duplicated reads (estimated) | 38,027,809 / 48.41% |
| Duplication rate | 47.24% |
| Clipped reads | 0 / 0% |
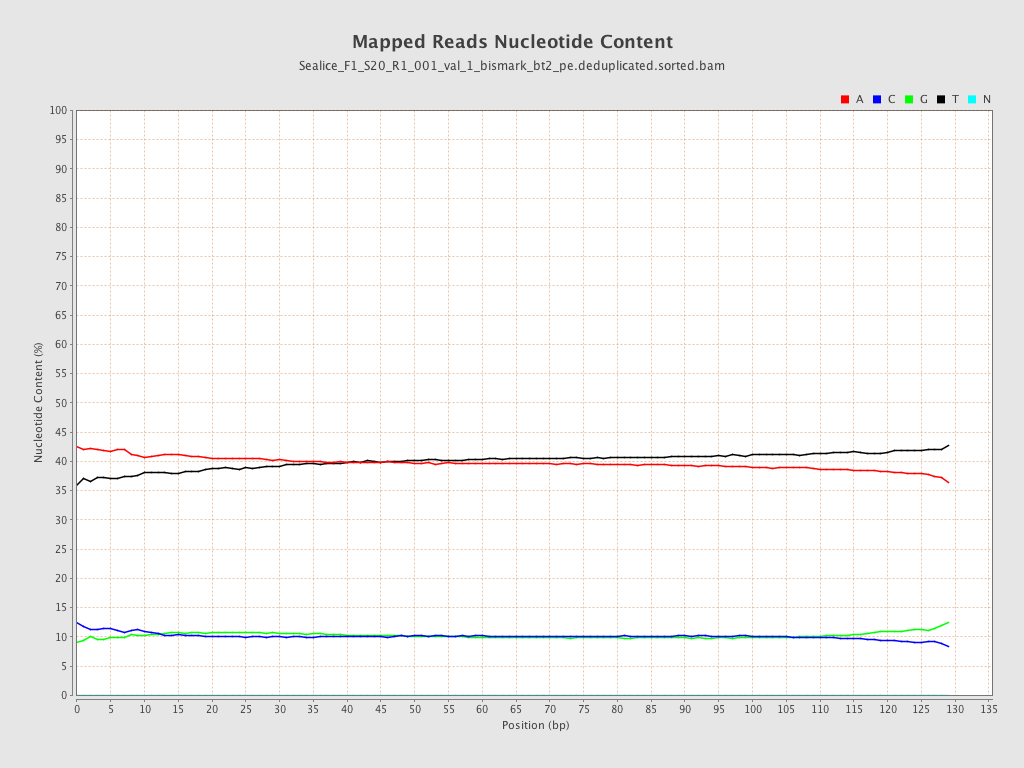
ACGT Content
| Number/percentage of A's | 3,310,635,970 / 39.85% |
| Number/percentage of C's | 842,628,577 / 10.14% |
| Number/percentage of T's | 3,309,294,141 / 39.83% |
| Number/percentage of G's | 845,982,029 / 10.18% |
| Number/percentage of N's | 55,673 / 0% |
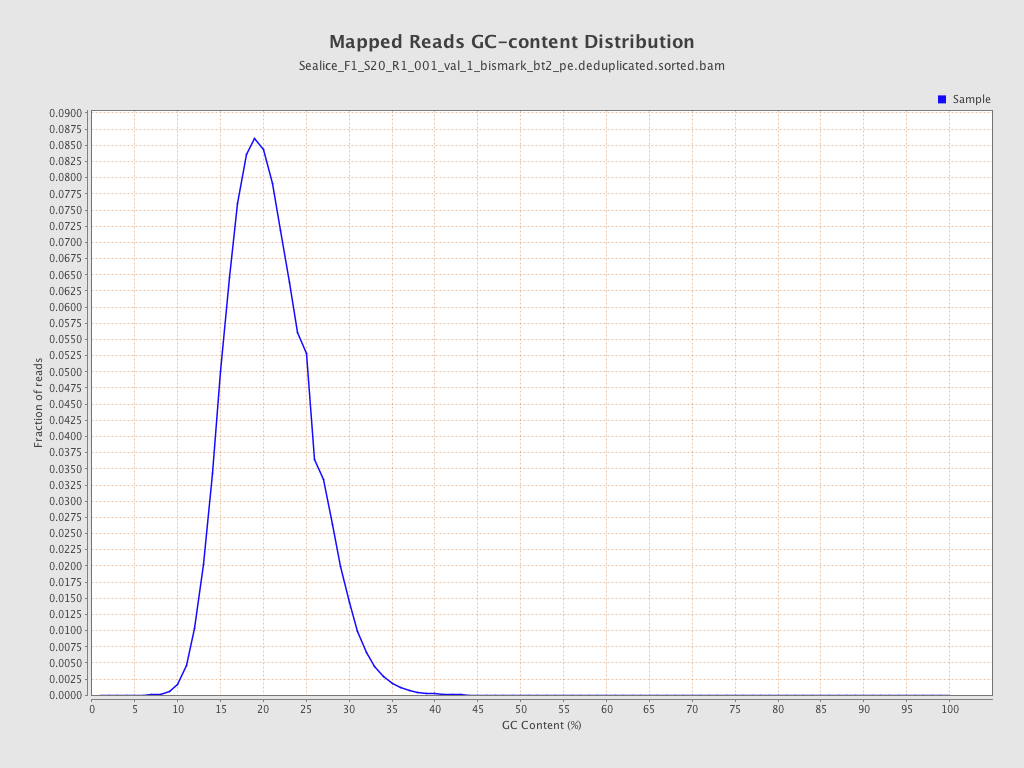
| GC Percentage | 20.32% |
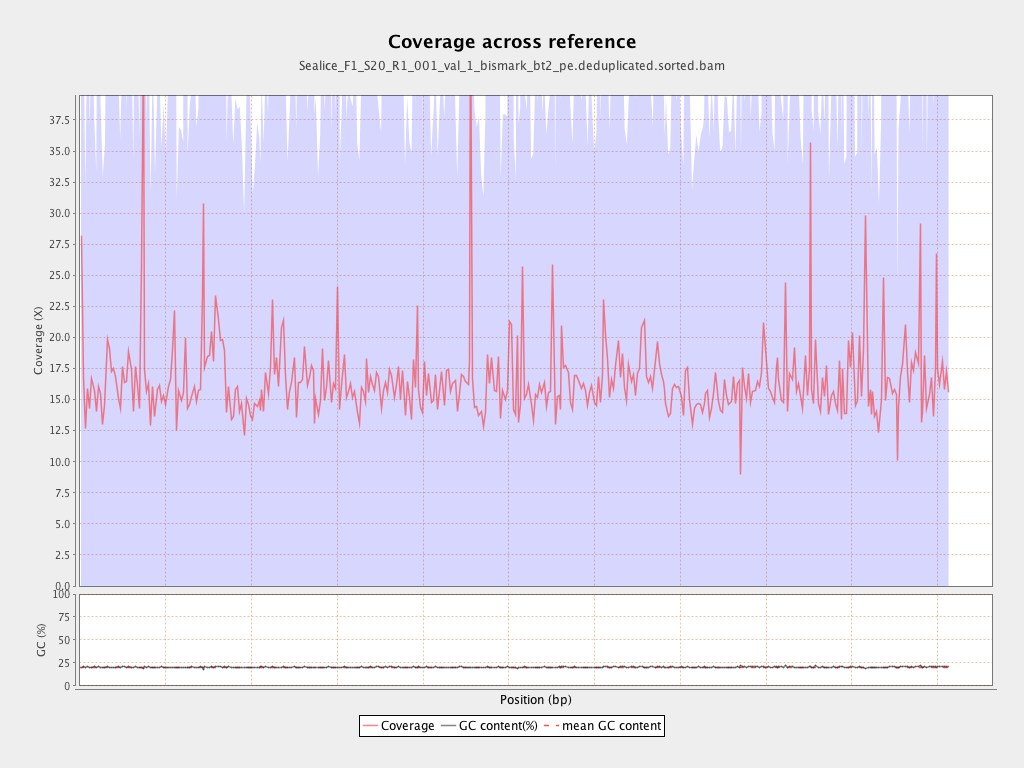
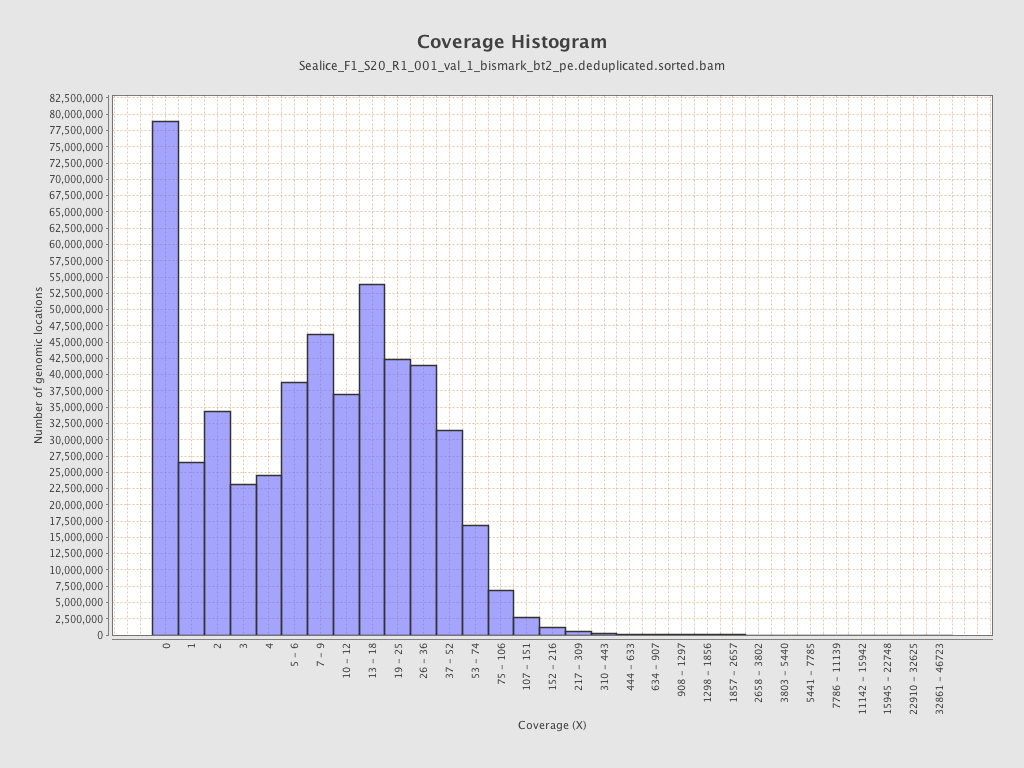
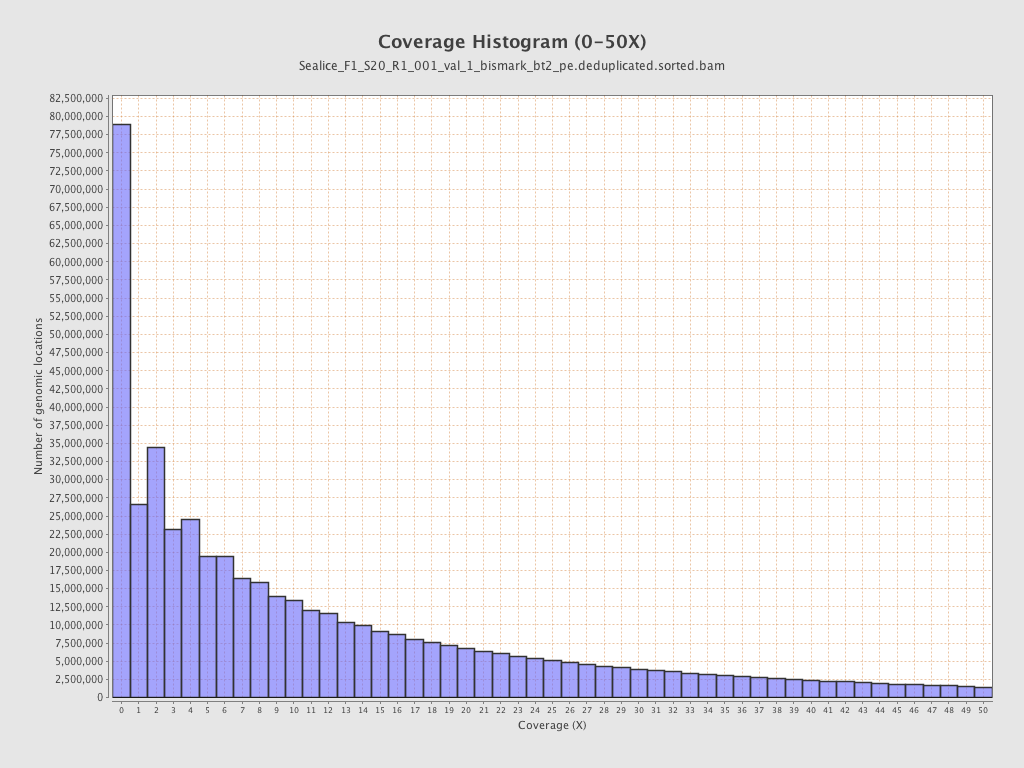
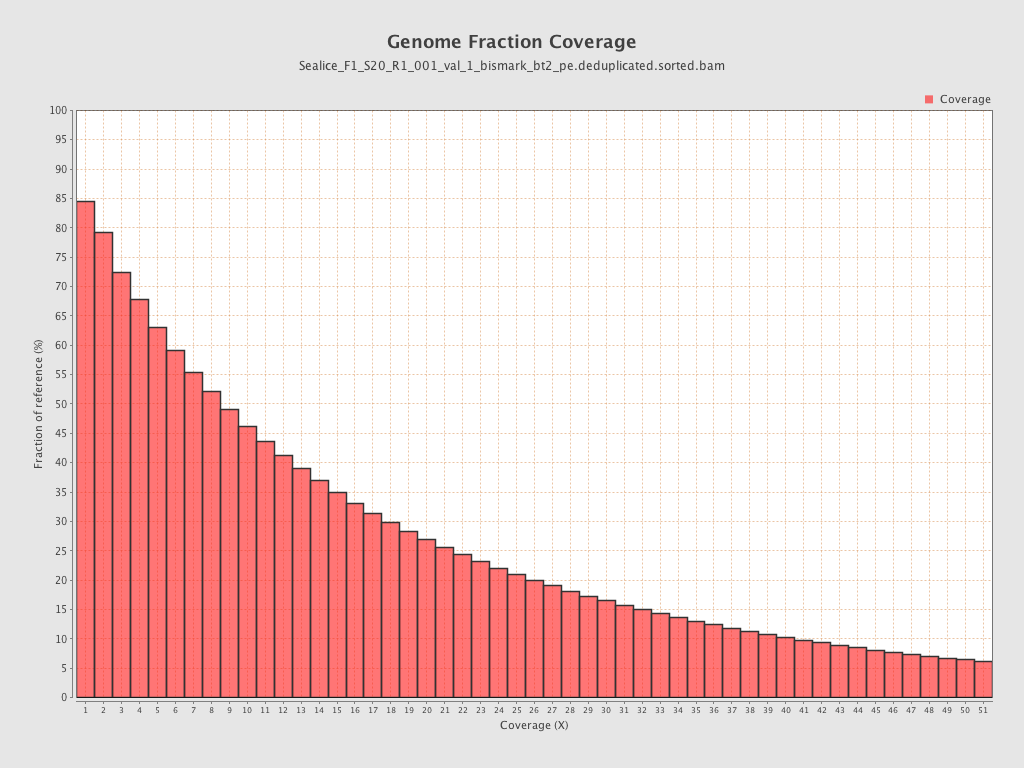
Coverage
| Mean | 16.4619 |
| Standard Deviation | 61.5992 |
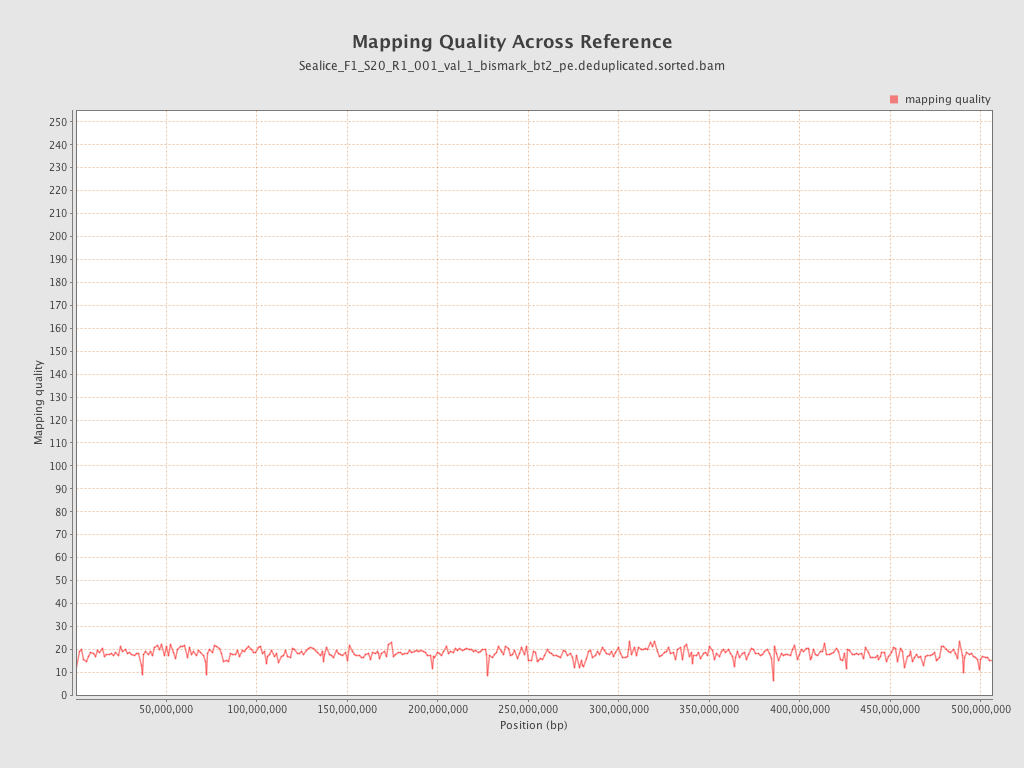
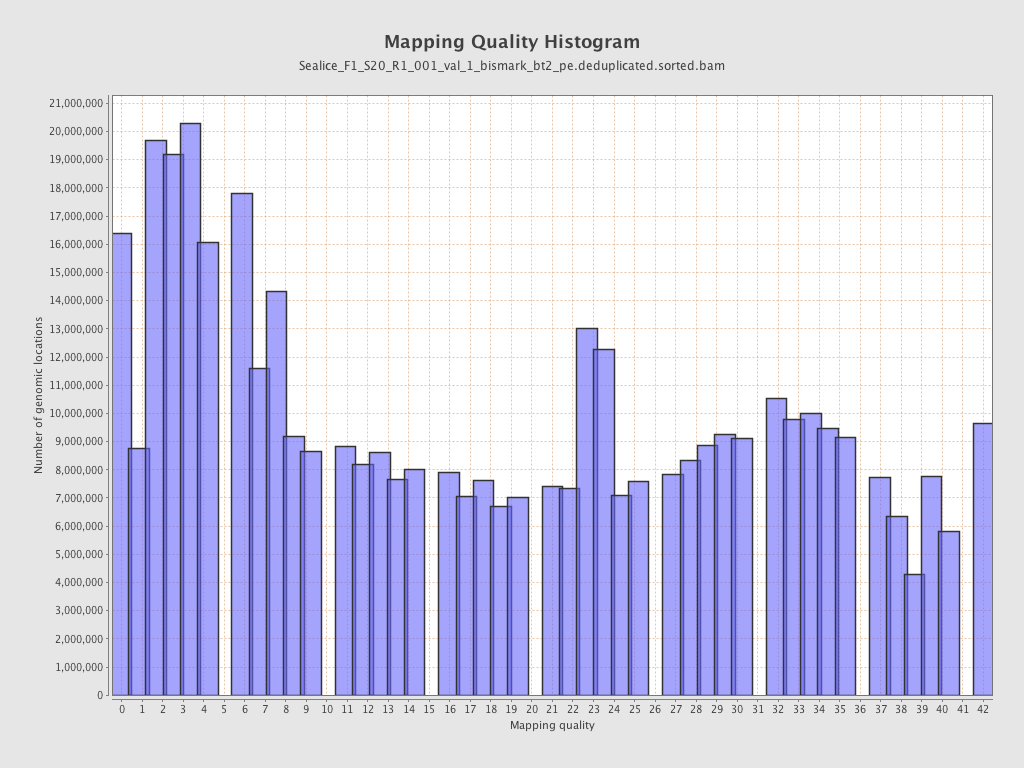
Mapping Quality
| Mean Mapping Quality | 18.05 |
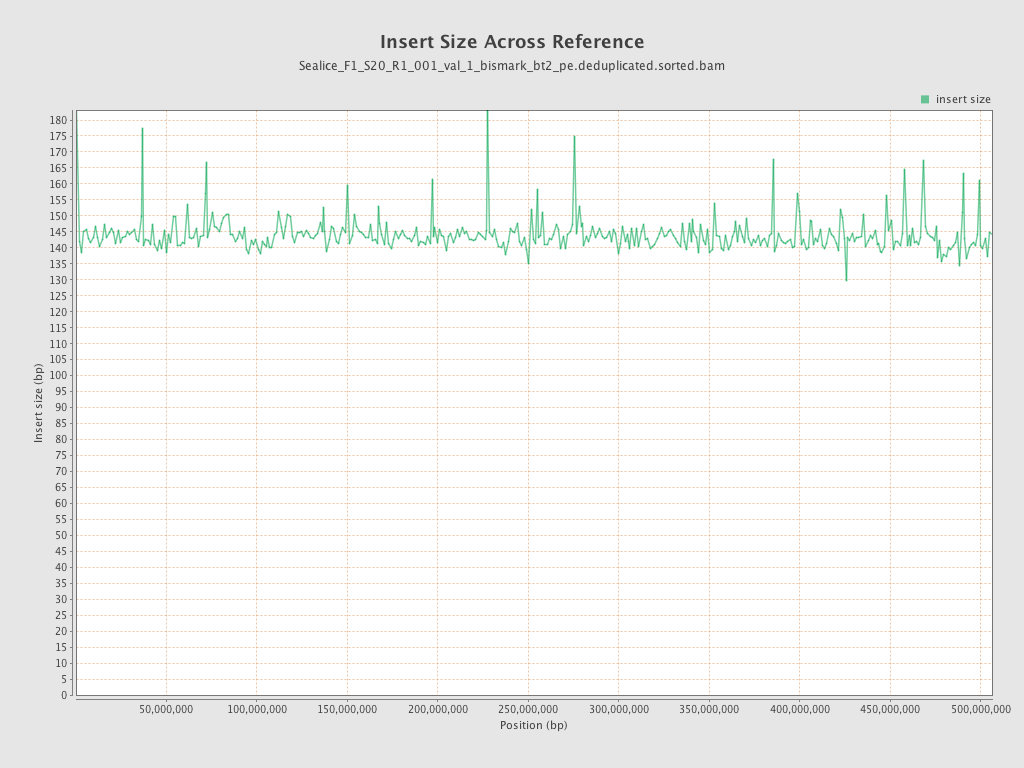
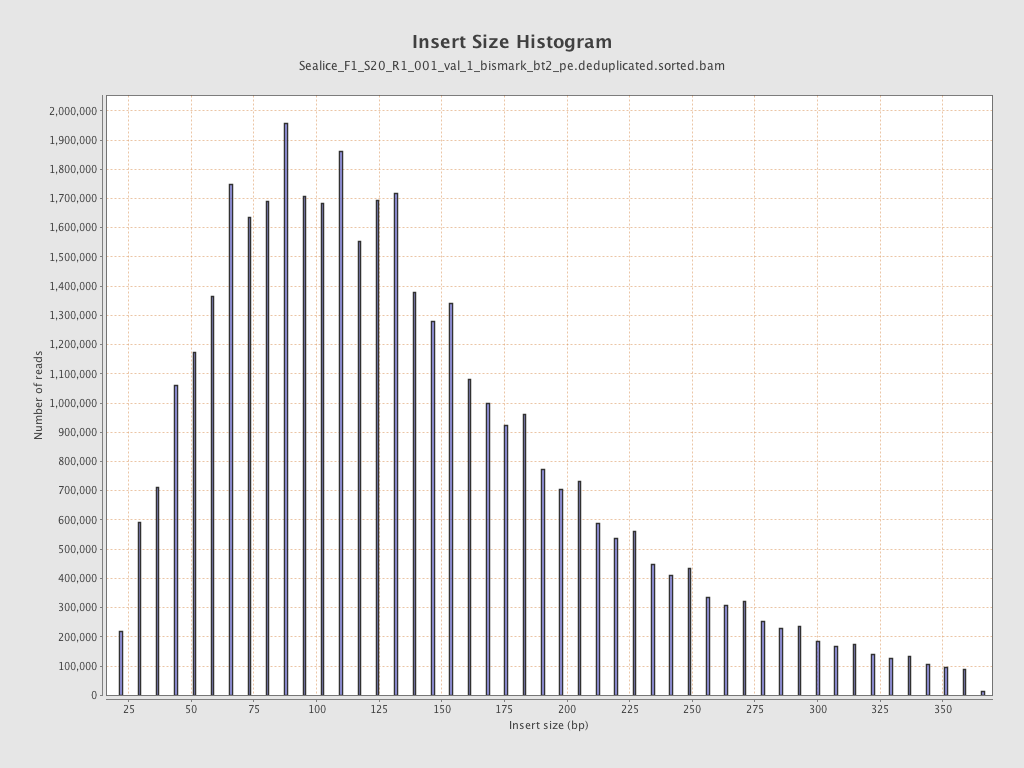
Insert size
| Mean | 144.66 |
| Standard Deviation | 81.22 |
| P25/Median/P75 | 86 / 128 / 183 |
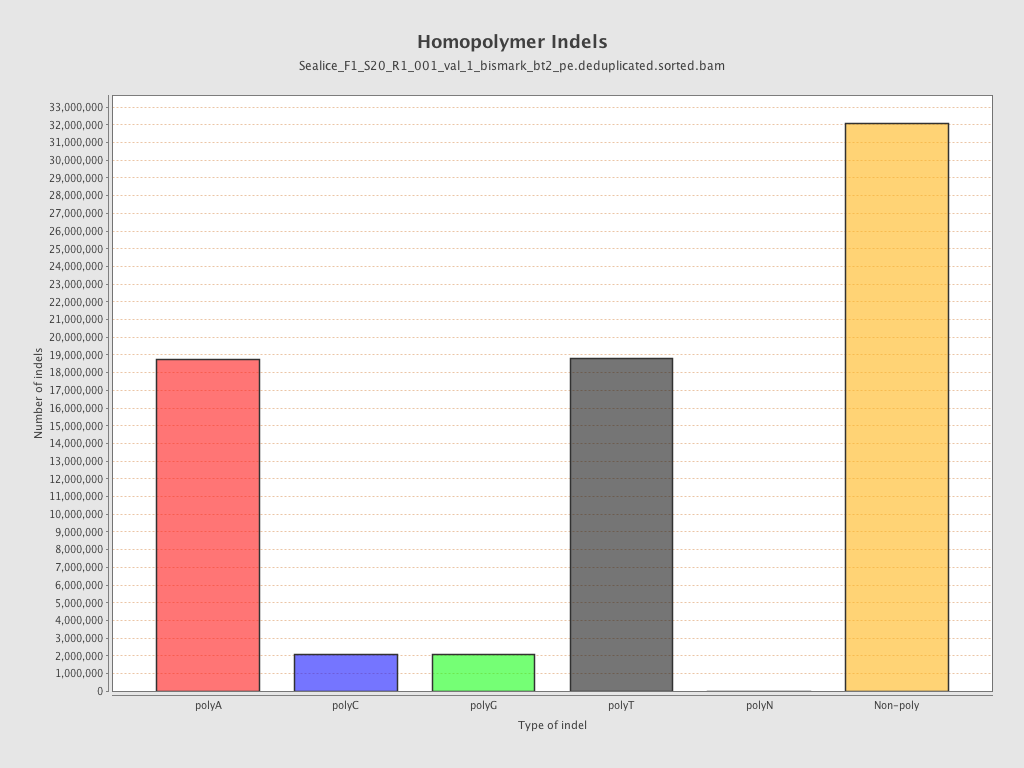
Mismatches and indels
| General error rate | 21.76% |
| Mismatches | 1,723,794,603 |
| Insertions | 51,232,487 |
| Mapped reads with at least one insertion | 42.26% |
| Deletions | 22,505,941 |
| Mapped reads with at least one deletion | 23.69% |
| Homopolymer indels | 56.51% |
Chromosome stats
| Name | Length | Mapped bases | Mean coverage | Standard deviation |
| Cr_scaffold0000001 | 36897007 | 624817582 | 16.9341 | 54.9143 |
| Cr_scaffold0000002 | 35124817 | 564360503 | 16.0673 | 54.5975 |
| Cr_scaffold0000003 | 33138466 | 547480744 | 16.521 | 44.3544 |
| Cr_scaffold0000004 | 31456035 | 539156134 | 17.14 | 42.2715 |
| Cr_scaffold0000005 | 30612693 | 488397980 | 15.9541 | 32.4117 |
| Cr_scaffold0000006 | 30259679 | 492505596 | 16.276 | 32.3946 |
| Cr_scaffold0000007 | 29872177 | 477042754 | 15.9695 | 45.2434 |
| Cr_scaffold0000008 | 27803016 | 467043496 | 16.7983 | 109.7299 |
| Cr_scaffold0000009 | 25126635 | 405353812 | 16.1324 | 40.2466 |
| Cr_scaffold0000010 | 24815513 | 402306836 | 16.2119 | 38.0215 |
| Cr_scaffold0000011 | 35794548 | 626880636 | 17.5133 | 30.1117 |
| Cr_scaffold0000012 | 22957860 | 344899879 | 15.0232 | 23.1358 |
| Cr_scaffold0000013 | 21502856 | 329115322 | 15.3057 | 24.0611 |
| Cr_scaffold0000014 | 21148584 | 349238459 | 16.5136 | 53.7005 |
| Cr_scaffold0000015 | 19091682 | 319360575 | 16.7277 | 83.6603 |
| Cr_scaffold0000016 | 18525937 | 295706625 | 15.9618 | 51.7649 |
| Cr_scaffold0000017 | 17562062 | 308487706 | 17.5656 | 181.6498 |
| Cr_scaffold0000018 | 14680182 | 233233549 | 15.8876 | 53.0525 |
| Cr_scaffold0000019 | 14290452 | 261793449 | 18.3195 | 86.1002 |
| Cr_scaffold0000020 | 8286978 | 129928875 | 15.6787 | 37.7286 |
| Cr_scaffold0000021 | 8023048 | 138595088 | 17.2746 | 34.6983 |