| Name |
Length |
Mapped bases |
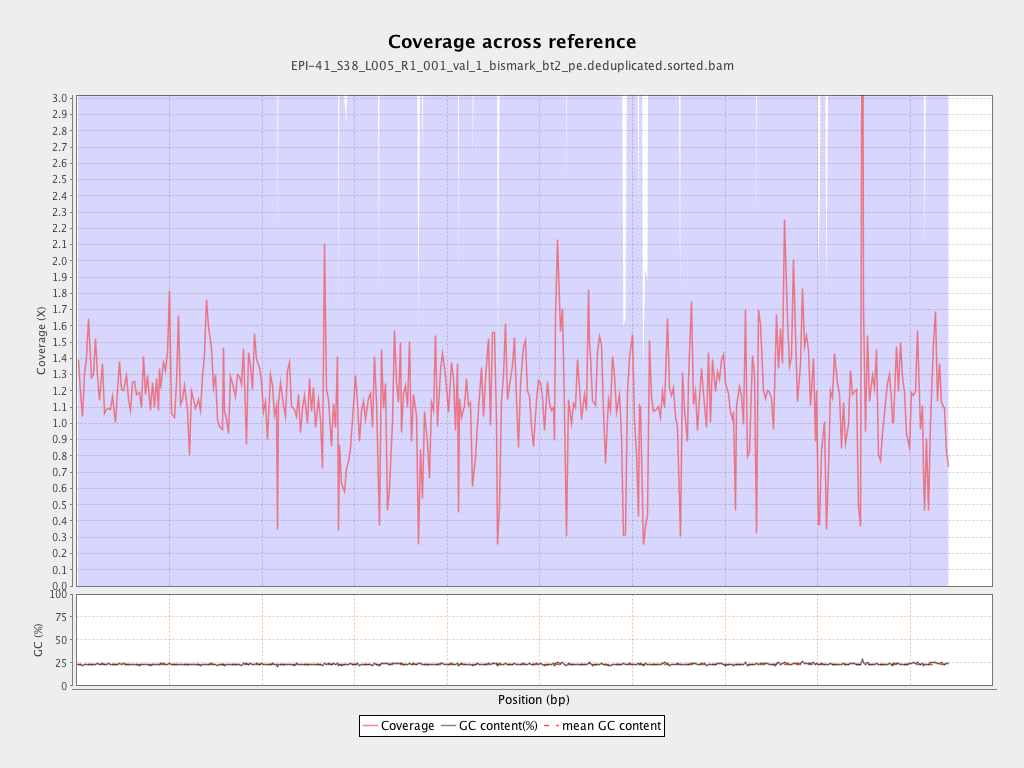
Mean coverage |
Standard deviation |
| PGA_scaffold1__77_contigs__length_89643857 |
89643857 |
109795430 |
1.2248 |
3.7135 |
| PGA_scaffold2__36_contigs__length_69596280 |
69596280 |
87286178 |
1.2542 |
5.2323 |
| PGA_scaffold3__111_contigs__length_57743597 |
57743597 |
69890712 |
1.2104 |
4.0257 |
| PGA_scaffold4__129_contigs__length_65288255 |
65288255 |
74816635 |
1.1459 |
5.733 |
| PGA_scaffold5__109_contigs__length_67248332 |
67248332 |
67449120 |
1.003 |
4.1826 |
| PGA_scaffold6__104_contigs__length_61759565 |
61759565 |
67144589 |
1.0872 |
6.0751 |
| PGA_scaffold7__69_contigs__length_43120122 |
43120122 |
48897568 |
1.134 |
3.7977 |
| PGA_scaffold8__63_contigs__length_61151155 |
61151155 |
71669923 |
1.172 |
4.3332 |
| PGA_scaffold9__45_contigs__length_38581958 |
38581958 |
49451472 |
1.2817 |
10.363 |
| PGA_scaffold10__49_contigs__length_53961475 |
53961475 |
58724856 |
1.0883 |
3.4063 |
| PGA_scaffold11__79_contigs__length_51449921 |
51449921 |
52229921 |
1.0152 |
4.5631 |
| PGA_scaffold12__71_contigs__length_50438331 |
50438331 |
61850700 |
1.2263 |
5.1513 |
| PGA_scaffold13__52_contigs__length_44396874 |
44396874 |
50951329 |
1.1476 |
4.3829 |
| PGA_scaffold14__91_contigs__length_45393038 |
45393038 |
67373170 |
1.4842 |
20.9117 |
| PGA_scaffold15__101_contigs__length_47938513 |
47938513 |
45347308 |
0.9459 |
3.6335 |
| PGA_scaffold16__33_contigs__length_31980953 |
31980953 |
39473059 |
1.2343 |
13.3324 |
| PGA_scaffold17__51_contigs__length_34923512 |
34923512 |
41022670 |
1.1746 |
4.1913 |
| PGA_scaffold18__69_contigs__length_27737463 |
27737463 |
28767302 |
1.0371 |
6.2377 |
