| Name |
Length |
Mapped bases |
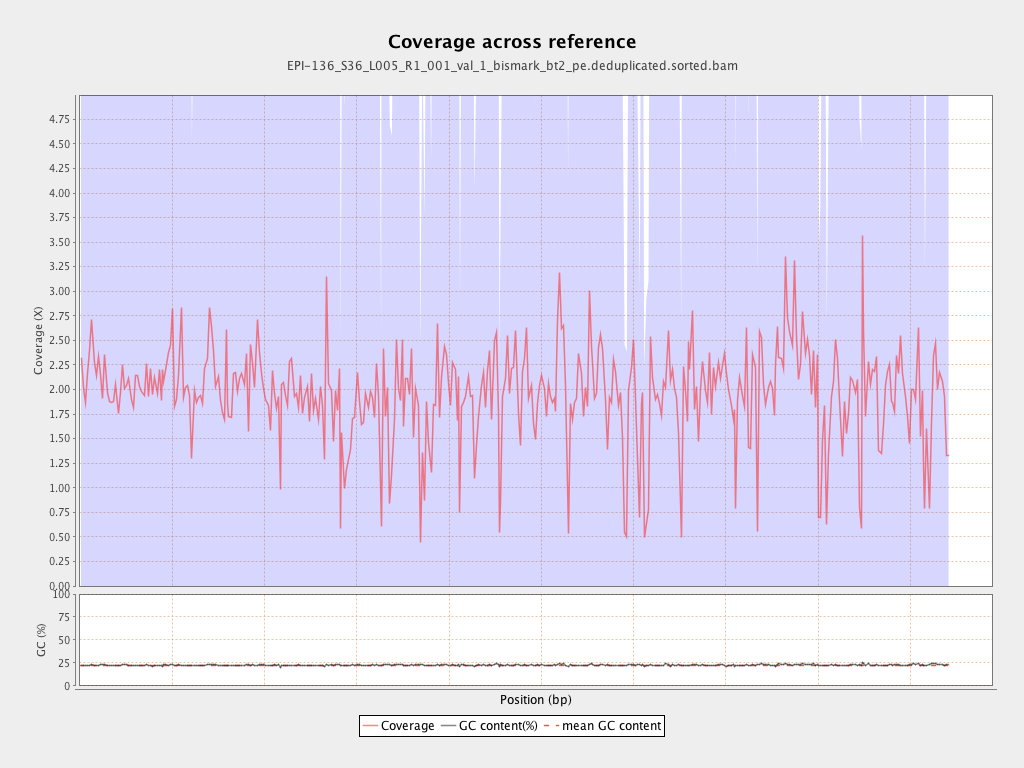
Mean coverage |
Standard deviation |
| PGA_scaffold1__77_contigs__length_89643857 |
89643857 |
186140410 |
2.0764 |
5.2036 |
| PGA_scaffold2__36_contigs__length_69596280 |
69596280 |
147907888 |
2.1252 |
6.5677 |
| PGA_scaffold3__111_contigs__length_57743597 |
57743597 |
118041875 |
2.0442 |
5.837 |
| PGA_scaffold4__129_contigs__length_65288255 |
65288255 |
128333535 |
1.9656 |
7.7264 |
| PGA_scaffold5__109_contigs__length_67248332 |
67248332 |
114525959 |
1.703 |
5.7728 |
| PGA_scaffold6__104_contigs__length_61759565 |
61759565 |
114150574 |
1.8483 |
7.8284 |
| PGA_scaffold7__69_contigs__length_43120122 |
43120122 |
82792397 |
1.92 |
5.41 |
| PGA_scaffold8__63_contigs__length_61151155 |
61151155 |
120507458 |
1.9706 |
6.6611 |
| PGA_scaffold9__45_contigs__length_38581958 |
38581958 |
82429463 |
2.1365 |
13.1165 |
| PGA_scaffold10__49_contigs__length_53961475 |
53961475 |
98519079 |
1.8257 |
4.8088 |
| PGA_scaffold11__79_contigs__length_51449921 |
51449921 |
90836684 |
1.7655 |
6.521 |
| PGA_scaffold12__71_contigs__length_50438331 |
50438331 |
104330743 |
2.0685 |
7.179 |
| PGA_scaffold13__52_contigs__length_44396874 |
44396874 |
85285248 |
1.921 |
6.1301 |
| PGA_scaffold14__91_contigs__length_45393038 |
45393038 |
112135218 |
2.4703 |
22.763 |
| PGA_scaffold15__101_contigs__length_47938513 |
47938513 |
78107599 |
1.6293 |
5.4649 |
| PGA_scaffold16__33_contigs__length_31980953 |
31980953 |
65066050 |
2.0345 |
9.7714 |
| PGA_scaffold17__51_contigs__length_34923512 |
34923512 |
69615968 |
1.9934 |
5.6774 |
| PGA_scaffold18__69_contigs__length_27737463 |
27737463 |
47836976 |
1.7246 |
6.9575 |