| Name |
Length |
Mapped bases |
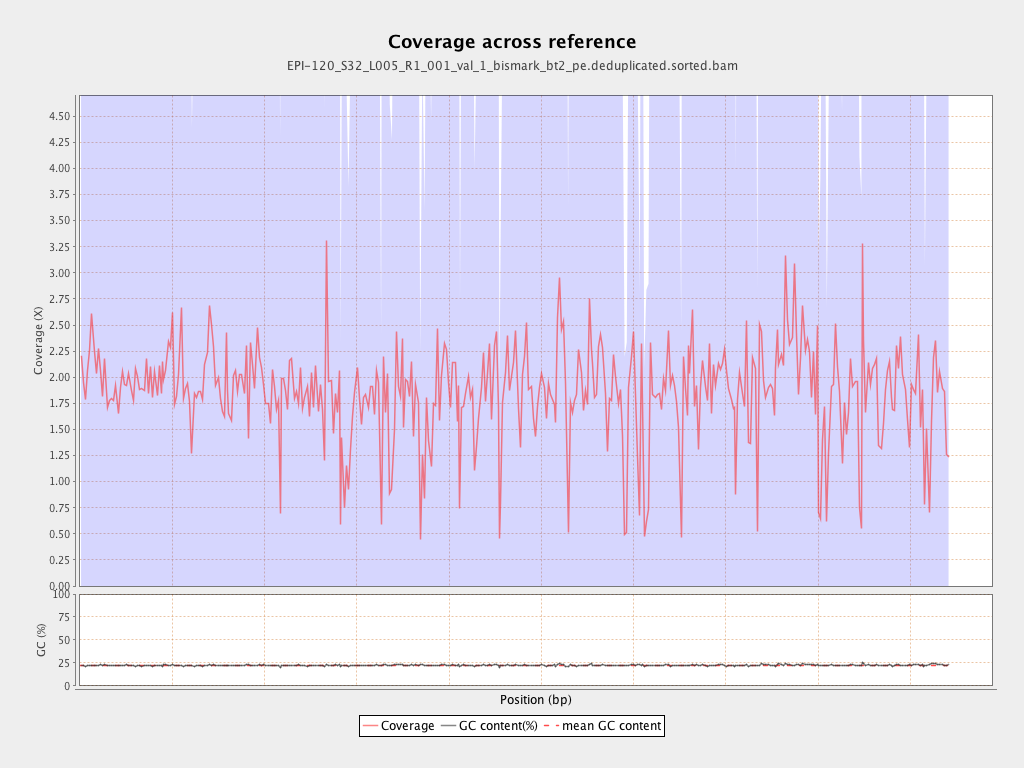
Mean coverage |
Standard deviation |
| PGA_scaffold1__77_contigs__length_89643857 |
89643857 |
177312438 |
1.978 |
4.7169 |
| PGA_scaffold2__36_contigs__length_69596280 |
69596280 |
140341469 |
2.0165 |
5.9844 |
| PGA_scaffold3__111_contigs__length_57743597 |
57743597 |
111142150 |
1.9248 |
5.4298 |
| PGA_scaffold4__129_contigs__length_65288255 |
65288255 |
123580306 |
1.8928 |
7.171 |
| PGA_scaffold5__109_contigs__length_67248332 |
67248332 |
108927820 |
1.6198 |
5.0081 |
| PGA_scaffold6__104_contigs__length_61759565 |
61759565 |
107560646 |
1.7416 |
6.9283 |
| PGA_scaffold7__69_contigs__length_43120122 |
43120122 |
78791702 |
1.8273 |
5.1474 |
| PGA_scaffold8__63_contigs__length_61151155 |
61151155 |
113821693 |
1.8613 |
5.569 |
| PGA_scaffold9__45_contigs__length_38581958 |
38581958 |
77977613 |
2.0211 |
12.0223 |
| PGA_scaffold10__49_contigs__length_53961475 |
53961475 |
93958768 |
1.7412 |
4.4093 |
| PGA_scaffold11__79_contigs__length_51449921 |
51449921 |
85453281 |
1.6609 |
5.6921 |
| PGA_scaffold12__71_contigs__length_50438331 |
50438331 |
99426792 |
1.9713 |
6.6549 |
| PGA_scaffold13__52_contigs__length_44396874 |
44396874 |
81369888 |
1.8328 |
5.6638 |
| PGA_scaffold14__91_contigs__length_45393038 |
45393038 |
105462823 |
2.3233 |
20.6292 |
| PGA_scaffold15__101_contigs__length_47938513 |
47938513 |
74519857 |
1.5545 |
4.9187 |
| PGA_scaffold16__33_contigs__length_31980953 |
31980953 |
61408218 |
1.9201 |
8.8732 |
| PGA_scaffold17__51_contigs__length_34923512 |
34923512 |
66172956 |
1.8948 |
5.1833 |
| PGA_scaffold18__69_contigs__length_27737463 |
27737463 |
45052489 |
1.6242 |
6.2043 |