| Name |
Length |
Mapped bases |
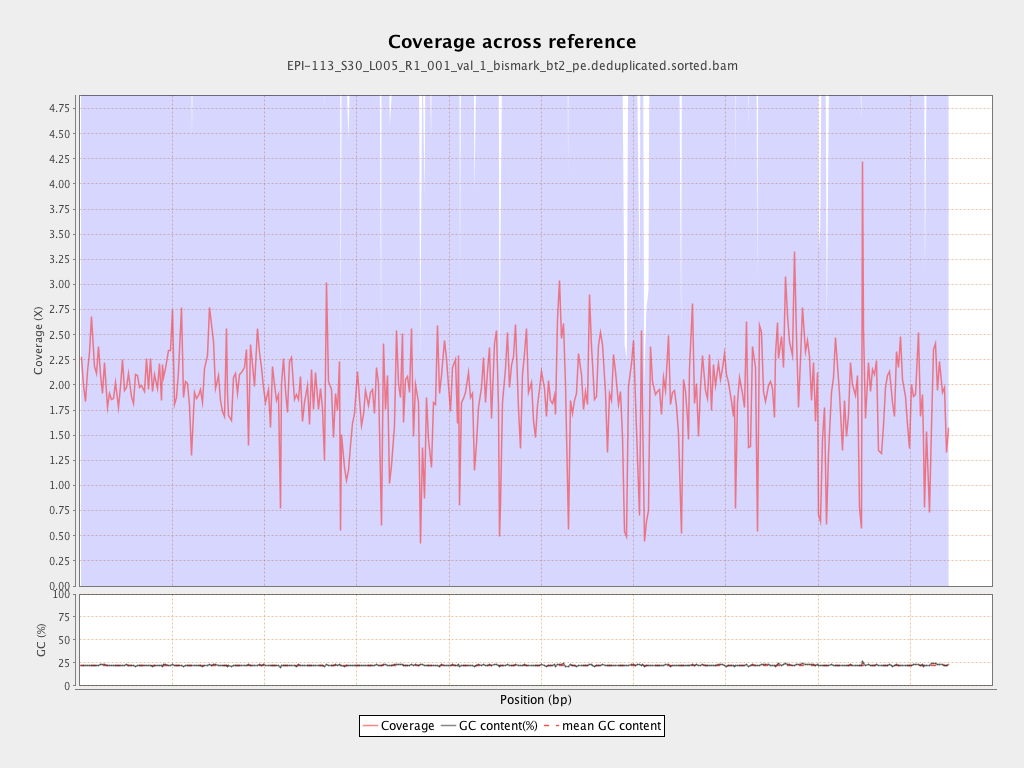
Mean coverage |
Standard deviation |
| PGA_scaffold1__77_contigs__length_89643857 |
89643857 |
184104964 |
2.0537 |
5.175 |
| PGA_scaffold2__36_contigs__length_69596280 |
69596280 |
145467272 |
2.0902 |
6.3286 |
| PGA_scaffold3__111_contigs__length_57743597 |
57743597 |
116327019 |
2.0145 |
5.6123 |
| PGA_scaffold4__129_contigs__length_65288255 |
65288255 |
126593162 |
1.939 |
7.1623 |
| PGA_scaffold5__109_contigs__length_67248332 |
67248332 |
114397657 |
1.7011 |
5.466 |
| PGA_scaffold6__104_contigs__length_61759565 |
61759565 |
113512999 |
1.838 |
8.8208 |
| PGA_scaffold7__69_contigs__length_43120122 |
43120122 |
82454437 |
1.9122 |
5.2141 |
| PGA_scaffold8__63_contigs__length_61151155 |
61151155 |
118842056 |
1.9434 |
6.3442 |
| PGA_scaffold9__45_contigs__length_38581958 |
38581958 |
80713905 |
2.092 |
12.0664 |
| PGA_scaffold10__49_contigs__length_53961475 |
53961475 |
97215133 |
1.8016 |
4.6842 |
| PGA_scaffold11__79_contigs__length_51449921 |
51449921 |
86981335 |
1.6906 |
5.6797 |
| PGA_scaffold12__71_contigs__length_50438331 |
50438331 |
103129598 |
2.0447 |
7.101 |
| PGA_scaffold13__52_contigs__length_44396874 |
44396874 |
83915022 |
1.8901 |
5.9636 |
| PGA_scaffold14__91_contigs__length_45393038 |
45393038 |
108114870 |
2.3818 |
19.9632 |
| PGA_scaffold15__101_contigs__length_47938513 |
47938513 |
76797664 |
1.602 |
5.2869 |
| PGA_scaffold16__33_contigs__length_31980953 |
31980953 |
63264096 |
1.9782 |
10.5011 |
| PGA_scaffold17__51_contigs__length_34923512 |
34923512 |
68159500 |
1.9517 |
5.4052 |
| PGA_scaffold18__69_contigs__length_27737463 |
27737463 |
47626221 |
1.717 |
6.258 |