| Name |
Length |
Mapped bases |
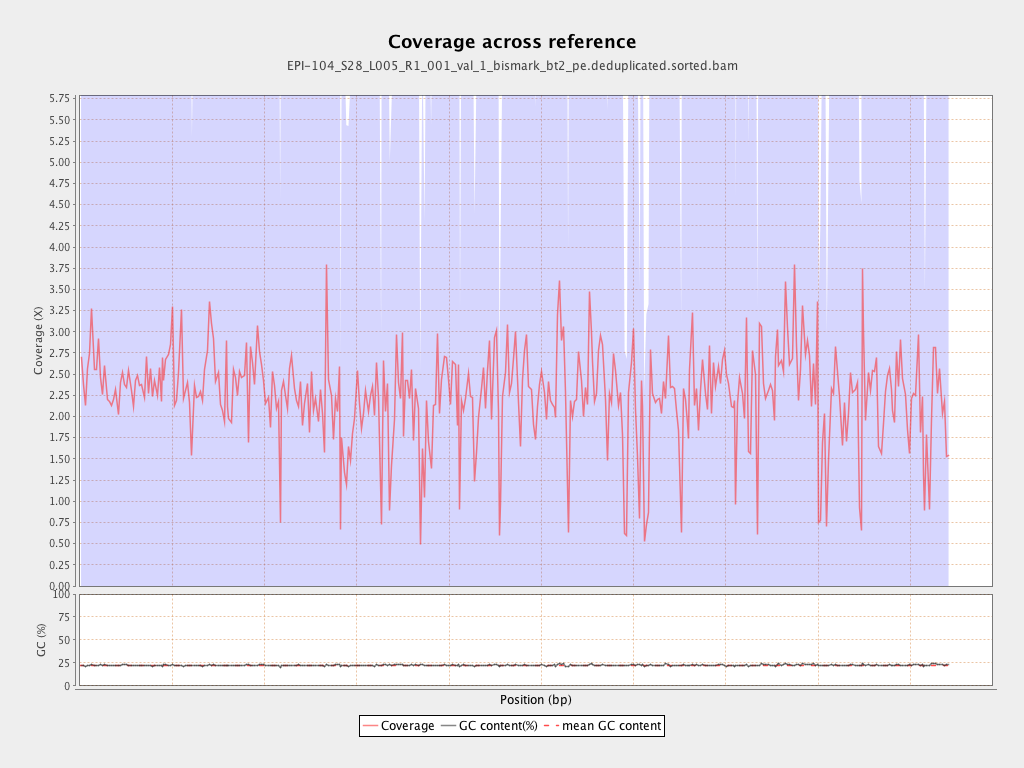
Mean coverage |
Standard deviation |
| PGA_scaffold1__77_contigs__length_89643857 |
89643857 |
216845195 |
2.419 |
5.7279 |
| PGA_scaffold2__36_contigs__length_69596280 |
69596280 |
172945920 |
2.485 |
7.0463 |
| PGA_scaffold3__111_contigs__length_57743597 |
57743597 |
137272775 |
2.3773 |
6.7583 |
| PGA_scaffold4__129_contigs__length_65288255 |
65288255 |
147655249 |
2.2616 |
8.7174 |
| PGA_scaffold5__109_contigs__length_67248332 |
67248332 |
133178555 |
1.9804 |
6.15 |
| PGA_scaffold6__104_contigs__length_61759565 |
61759565 |
131191044 |
2.1242 |
7.7882 |
| PGA_scaffold7__69_contigs__length_43120122 |
43120122 |
96119910 |
2.2291 |
6.2236 |
| PGA_scaffold8__63_contigs__length_61151155 |
61151155 |
139704667 |
2.2846 |
6.7231 |
| PGA_scaffold9__45_contigs__length_38581958 |
38581958 |
95107763 |
2.4651 |
14.4146 |
| PGA_scaffold10__49_contigs__length_53961475 |
53961475 |
114491300 |
2.1217 |
5.4101 |
| PGA_scaffold11__79_contigs__length_51449921 |
51449921 |
101711036 |
1.9769 |
6.2882 |
| PGA_scaffold12__71_contigs__length_50438331 |
50438331 |
121752315 |
2.4139 |
8.0342 |
| PGA_scaffold13__52_contigs__length_44396874 |
44396874 |
98914436 |
2.228 |
7.2355 |
| PGA_scaffold14__91_contigs__length_45393038 |
45393038 |
126338581 |
2.7832 |
22.954 |
| PGA_scaffold15__101_contigs__length_47938513 |
47938513 |
89138309 |
1.8594 |
6.0601 |
| PGA_scaffold16__33_contigs__length_31980953 |
31980953 |
74471271 |
2.3286 |
10.5291 |
| PGA_scaffold17__51_contigs__length_34923512 |
34923512 |
78574277 |
2.2499 |
6.0228 |
| PGA_scaffold18__69_contigs__length_27737463 |
27737463 |
54415024 |
1.9618 |
7.6466 |