| Name |
Length |
Mapped bases |
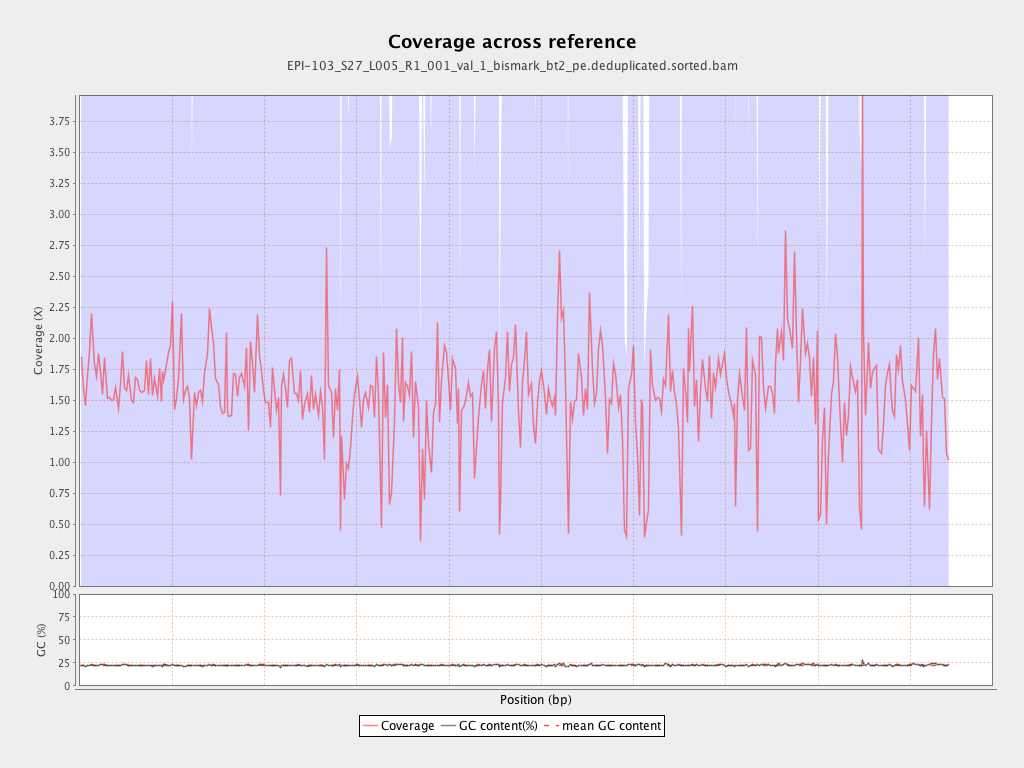
Mean coverage |
Standard deviation |
| PGA_scaffold1__77_contigs__length_89643857 |
89643857 |
148172792 |
1.6529 |
4.3532 |
| PGA_scaffold2__36_contigs__length_69596280 |
69596280 |
117195488 |
1.6839 |
6.1736 |
| PGA_scaffold3__111_contigs__length_57743597 |
57743597 |
93650388 |
1.6218 |
4.8408 |
| PGA_scaffold4__129_contigs__length_65288255 |
65288255 |
102605659 |
1.5716 |
7.1181 |
| PGA_scaffold5__109_contigs__length_67248332 |
67248332 |
91615846 |
1.3624 |
5.0125 |
| PGA_scaffold6__104_contigs__length_61759565 |
61759565 |
90101738 |
1.4589 |
6.6238 |
| PGA_scaffold7__69_contigs__length_43120122 |
43120122 |
65251675 |
1.5133 |
4.5019 |
| PGA_scaffold8__63_contigs__length_61151155 |
61151155 |
95584669 |
1.5631 |
5.4947 |
| PGA_scaffold9__45_contigs__length_38581958 |
38581958 |
66150998 |
1.7146 |
13.0418 |
| PGA_scaffold10__49_contigs__length_53961475 |
53961475 |
77182693 |
1.4303 |
3.8726 |
| PGA_scaffold11__79_contigs__length_51449921 |
51449921 |
71505968 |
1.3898 |
5.4802 |
| PGA_scaffold12__71_contigs__length_50438331 |
50438331 |
82979589 |
1.6452 |
6.1166 |
| PGA_scaffold13__52_contigs__length_44396874 |
44396874 |
66952845 |
1.5081 |
5.1013 |
| PGA_scaffold14__91_contigs__length_45393038 |
45393038 |
89507425 |
1.9718 |
23.9063 |
| PGA_scaffold15__101_contigs__length_47938513 |
47938513 |
62098291 |
1.2954 |
4.5731 |
| PGA_scaffold16__33_contigs__length_31980953 |
31980953 |
52144119 |
1.6305 |
11.0145 |
| PGA_scaffold17__51_contigs__length_34923512 |
34923512 |
54339674 |
1.556 |
4.6953 |
| PGA_scaffold18__69_contigs__length_27737463 |
27737463 |
38335373 |
1.3821 |
7.0043 |