| Name |
Length |
Mapped bases |
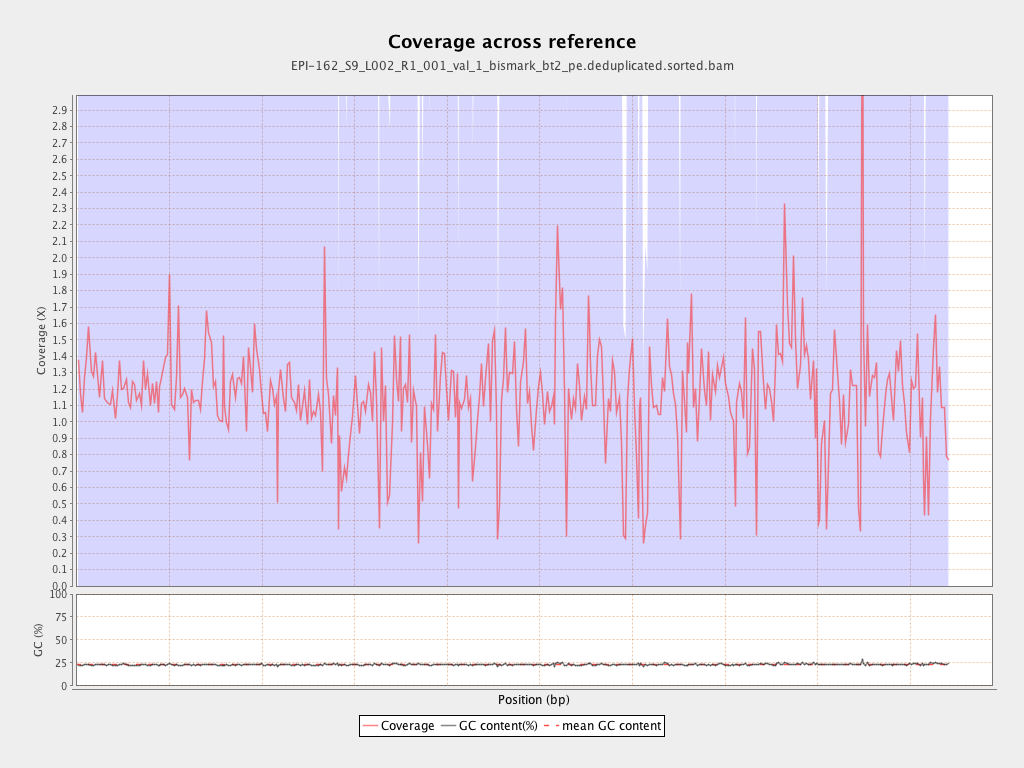
Mean coverage |
Standard deviation |
| PGA_scaffold1__77_contigs__length_89643857 |
89643857 |
109136338 |
1.2174 |
4.1768 |
| PGA_scaffold2__36_contigs__length_69596280 |
69596280 |
87662321 |
1.2596 |
6.4324 |
| PGA_scaffold3__111_contigs__length_57743597 |
57743597 |
69539983 |
1.2043 |
4.2526 |
| PGA_scaffold4__129_contigs__length_65288255 |
65288255 |
75646074 |
1.1586 |
6.3938 |
| PGA_scaffold5__109_contigs__length_67248332 |
67248332 |
67922215 |
1.01 |
4.5923 |
| PGA_scaffold6__104_contigs__length_61759565 |
61759565 |
66958786 |
1.0842 |
6.435 |
| PGA_scaffold7__69_contigs__length_43120122 |
43120122 |
49139449 |
1.1396 |
3.7281 |
| PGA_scaffold8__63_contigs__length_61151155 |
61151155 |
70759284 |
1.1571 |
4.5846 |
| PGA_scaffold9__45_contigs__length_38581958 |
38581958 |
50287050 |
1.3034 |
12.0042 |
| PGA_scaffold10__49_contigs__length_53961475 |
53961475 |
57600431 |
1.0674 |
3.4456 |
| PGA_scaffold11__79_contigs__length_51449921 |
51449921 |
53172451 |
1.0335 |
4.8942 |
| PGA_scaffold12__71_contigs__length_50438331 |
50438331 |
61890717 |
1.2271 |
5.5604 |
| PGA_scaffold13__52_contigs__length_44396874 |
44396874 |
50625491 |
1.1403 |
4.7286 |
| PGA_scaffold14__91_contigs__length_45393038 |
45393038 |
67254854 |
1.4816 |
24.3116 |
| PGA_scaffold15__101_contigs__length_47938513 |
47938513 |
46053394 |
0.9607 |
3.9311 |
| PGA_scaffold16__33_contigs__length_31980953 |
31980953 |
39281077 |
1.2283 |
12.8946 |
| PGA_scaffold17__51_contigs__length_34923512 |
34923512 |
40929983 |
1.172 |
4.4464 |
| PGA_scaffold18__69_contigs__length_27737463 |
27737463 |
28407965 |
1.0242 |
7.0191 |