| Name |
Length |
Mapped bases |
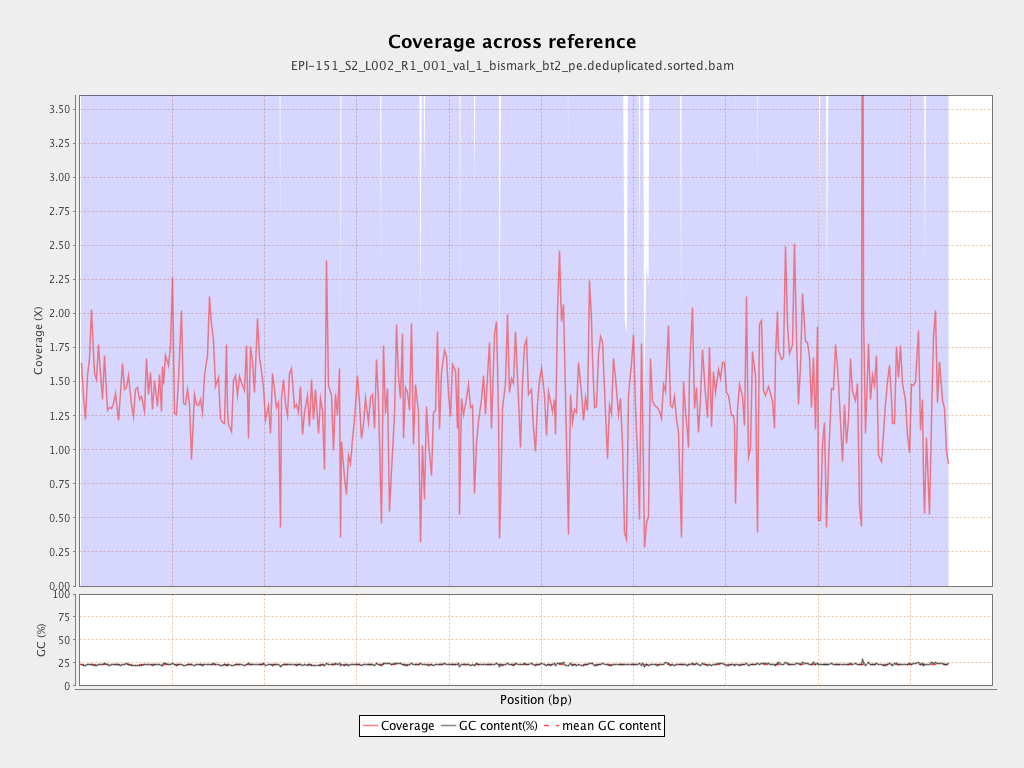
Mean coverage |
Standard deviation |
| PGA_scaffold1__77_contigs__length_89643857 |
89643857 |
130849166 |
1.4597 |
4.6862 |
| PGA_scaffold2__36_contigs__length_69596280 |
69596280 |
105144492 |
1.5108 |
6.7631 |
| PGA_scaffold3__111_contigs__length_57743597 |
57743597 |
83587858 |
1.4476 |
4.9879 |
| PGA_scaffold4__129_contigs__length_65288255 |
65288255 |
89192710 |
1.3661 |
6.5845 |
| PGA_scaffold5__109_contigs__length_67248332 |
67248332 |
81303967 |
1.209 |
5.0996 |
| PGA_scaffold6__104_contigs__length_61759565 |
61759565 |
80684110 |
1.3064 |
8.2385 |
| PGA_scaffold7__69_contigs__length_43120122 |
43120122 |
58443998 |
1.3554 |
4.6287 |
| PGA_scaffold8__63_contigs__length_61151155 |
61151155 |
85557000 |
1.3991 |
5.5046 |
| PGA_scaffold9__45_contigs__length_38581958 |
38581958 |
59455436 |
1.541 |
11.728 |
| PGA_scaffold10__49_contigs__length_53961475 |
53961475 |
69617181 |
1.2901 |
4.1967 |
| PGA_scaffold11__79_contigs__length_51449921 |
51449921 |
61288257 |
1.1912 |
5.5101 |
| PGA_scaffold12__71_contigs__length_50438331 |
50438331 |
73912153 |
1.4654 |
6.0232 |
| PGA_scaffold13__52_contigs__length_44396874 |
44396874 |
61013881 |
1.3743 |
5.6892 |
| PGA_scaffold14__91_contigs__length_45393038 |
45393038 |
80799265 |
1.78 |
21.5538 |
| PGA_scaffold15__101_contigs__length_47938513 |
47938513 |
55015804 |
1.1476 |
4.7316 |
| PGA_scaffold16__33_contigs__length_31980953 |
31980953 |
47474018 |
1.4844 |
19.0069 |
| PGA_scaffold17__51_contigs__length_34923512 |
34923512 |
49327030 |
1.4124 |
5.6708 |
| PGA_scaffold18__69_contigs__length_27737463 |
27737463 |
34528061 |
1.2448 |
7.966 |