| Name |
Length |
Mapped bases |
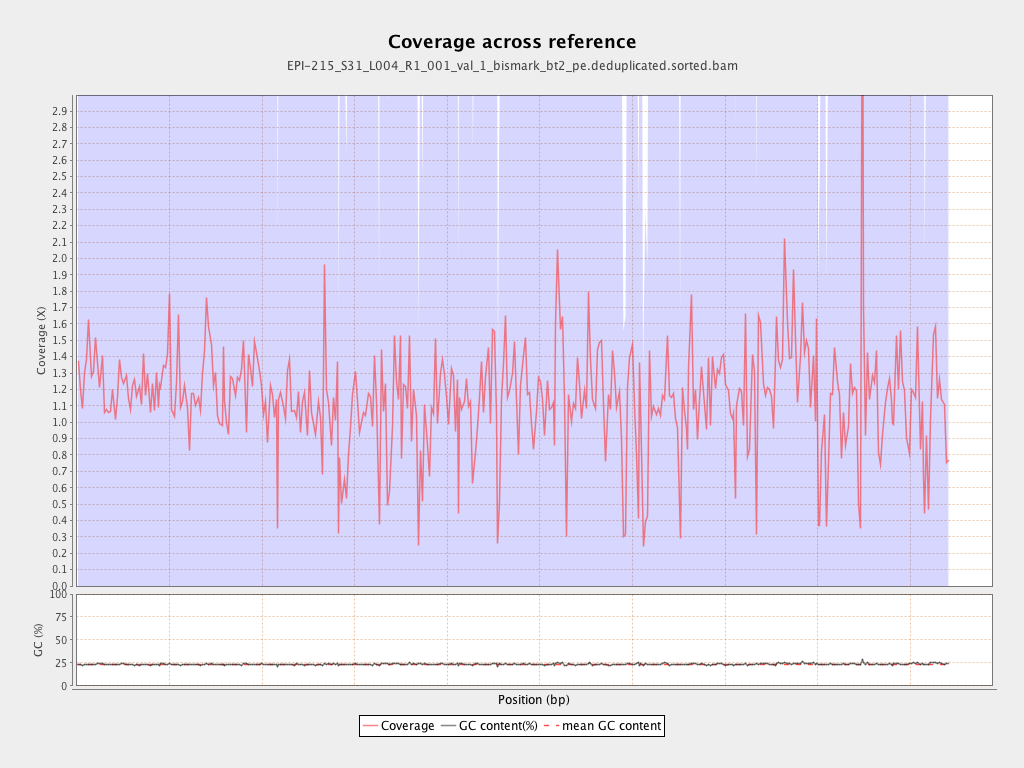
Mean coverage |
Standard deviation |
| PGA_scaffold1__77_contigs__length_89643857 |
89643857 |
110189524 |
1.2292 |
3.8892 |
| PGA_scaffold2__36_contigs__length_69596280 |
69596280 |
87274381 |
1.254 |
5.0913 |
| PGA_scaffold3__111_contigs__length_57743597 |
57743597 |
69335533 |
1.2007 |
4.0137 |
| PGA_scaffold4__129_contigs__length_65288255 |
65288255 |
73212908 |
1.1214 |
5.3698 |
| PGA_scaffold5__109_contigs__length_67248332 |
67248332 |
66999890 |
0.9963 |
4.1335 |
| PGA_scaffold6__104_contigs__length_61759565 |
61759565 |
65855979 |
1.0663 |
6.293 |
| PGA_scaffold7__69_contigs__length_43120122 |
43120122 |
48970777 |
1.1357 |
3.8398 |
| PGA_scaffold8__63_contigs__length_61151155 |
61151155 |
70928376 |
1.1599 |
4.2 |
| PGA_scaffold9__45_contigs__length_38581958 |
38581958 |
49165940 |
1.2743 |
9.7732 |
| PGA_scaffold10__49_contigs__length_53961475 |
53961475 |
58841685 |
1.0904 |
3.47 |
| PGA_scaffold11__79_contigs__length_51449921 |
51449921 |
50844467 |
0.9882 |
4.2077 |
| PGA_scaffold12__71_contigs__length_50438331 |
50438331 |
61597858 |
1.2213 |
5.493 |
| PGA_scaffold13__52_contigs__length_44396874 |
44396874 |
50965082 |
1.1479 |
4.5859 |
| PGA_scaffold14__91_contigs__length_45393038 |
45393038 |
66561509 |
1.4663 |
19.4286 |
| PGA_scaffold15__101_contigs__length_47938513 |
47938513 |
45146715 |
0.9418 |
3.7313 |
| PGA_scaffold16__33_contigs__length_31980953 |
31980953 |
38709582 |
1.2104 |
12.0368 |
| PGA_scaffold17__51_contigs__length_34923512 |
34923512 |
40650300 |
1.164 |
4.5011 |
| PGA_scaffold18__69_contigs__length_27737463 |
27737463 |
28362530 |
1.0225 |
5.9474 |