| Name |
Length |
Mapped bases |
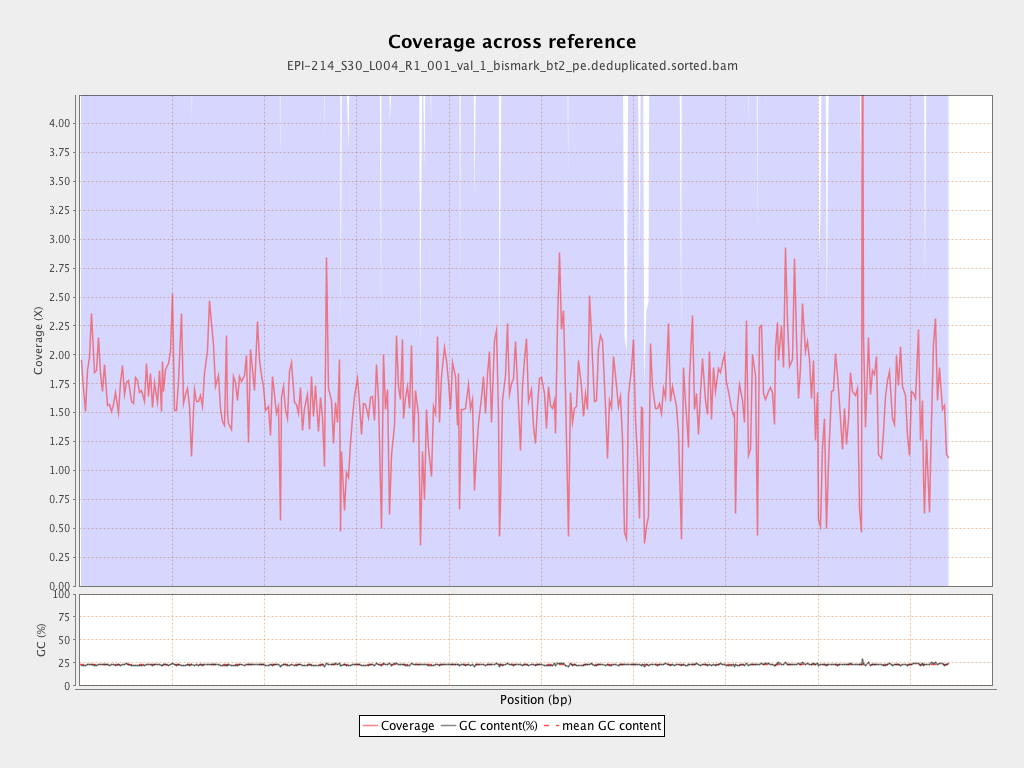
Mean coverage |
Standard deviation |
| PGA_scaffold1__77_contigs__length_89643857 |
89643857 |
156416098 |
1.7449 |
5.1137 |
| PGA_scaffold2__36_contigs__length_69596280 |
69596280 |
124192753 |
1.7845 |
7.255 |
| PGA_scaffold3__111_contigs__length_57743597 |
57743597 |
97875416 |
1.695 |
5.3168 |
| PGA_scaffold4__129_contigs__length_65288255 |
65288255 |
105223238 |
1.6117 |
7.7492 |
| PGA_scaffold5__109_contigs__length_67248332 |
67248332 |
96221590 |
1.4308 |
5.5351 |
| PGA_scaffold6__104_contigs__length_61759565 |
61759565 |
94632337 |
1.5323 |
7.823 |
| PGA_scaffold7__69_contigs__length_43120122 |
43120122 |
68331955 |
1.5847 |
4.8872 |
| PGA_scaffold8__63_contigs__length_61151155 |
61151155 |
100424476 |
1.6422 |
5.618 |
| PGA_scaffold9__45_contigs__length_38581958 |
38581958 |
69639774 |
1.805 |
14.3741 |
| PGA_scaffold10__49_contigs__length_53961475 |
53961475 |
82497740 |
1.5288 |
4.434 |
| PGA_scaffold11__79_contigs__length_51449921 |
51449921 |
74008504 |
1.4385 |
6.0837 |
| PGA_scaffold12__71_contigs__length_50438331 |
50438331 |
87500135 |
1.7348 |
6.5382 |
| PGA_scaffold13__52_contigs__length_44396874 |
44396874 |
71303270 |
1.606 |
6.0061 |
| PGA_scaffold14__91_contigs__length_45393038 |
45393038 |
93341868 |
2.0563 |
24.5216 |
| PGA_scaffold15__101_contigs__length_47938513 |
47938513 |
63894653 |
1.3328 |
4.9163 |
| PGA_scaffold16__33_contigs__length_31980953 |
31980953 |
55344215 |
1.7305 |
15.7533 |
| PGA_scaffold17__51_contigs__length_34923512 |
34923512 |
56873873 |
1.6285 |
5.3762 |
| PGA_scaffold18__69_contigs__length_27737463 |
27737463 |
40195298 |
1.4491 |
8.9462 |