| Name |
Length |
Mapped bases |
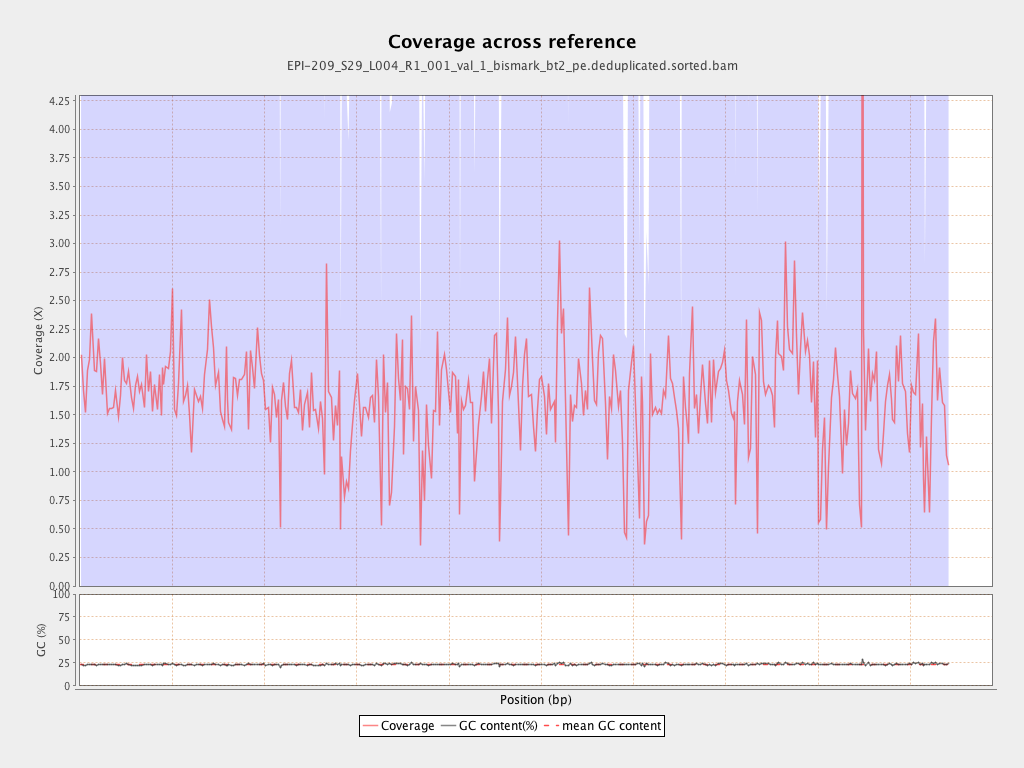
Mean coverage |
Standard deviation |
| PGA_scaffold1__77_contigs__length_89643857 |
89643857 |
158546193 |
1.7686 |
5.5985 |
| PGA_scaffold2__36_contigs__length_69596280 |
69596280 |
125767694 |
1.8071 |
7.4277 |
| PGA_scaffold3__111_contigs__length_57743597 |
57743597 |
99553658 |
1.7241 |
5.4844 |
| PGA_scaffold4__129_contigs__length_65288255 |
65288255 |
105736931 |
1.6195 |
7.8473 |
| PGA_scaffold5__109_contigs__length_67248332 |
67248332 |
96586650 |
1.4363 |
5.7088 |
| PGA_scaffold6__104_contigs__length_61759565 |
61759565 |
95502558 |
1.5464 |
10.1086 |
| PGA_scaffold7__69_contigs__length_43120122 |
43120122 |
69693650 |
1.6163 |
5.0366 |
| PGA_scaffold8__63_contigs__length_61151155 |
61151155 |
101695159 |
1.663 |
5.7376 |
| PGA_scaffold9__45_contigs__length_38581958 |
38581958 |
70936155 |
1.8386 |
14.2083 |
| PGA_scaffold10__49_contigs__length_53961475 |
53961475 |
84313143 |
1.5625 |
4.7521 |
| PGA_scaffold11__79_contigs__length_51449921 |
51449921 |
74163723 |
1.4415 |
6.2564 |
| PGA_scaffold12__71_contigs__length_50438331 |
50438331 |
88389622 |
1.7524 |
6.8537 |
| PGA_scaffold13__52_contigs__length_44396874 |
44396874 |
73294725 |
1.6509 |
6.2459 |
| PGA_scaffold14__91_contigs__length_45393038 |
45393038 |
95233626 |
2.098 |
26.4597 |
| PGA_scaffold15__101_contigs__length_47938513 |
47938513 |
64606599 |
1.3477 |
5.2421 |
| PGA_scaffold16__33_contigs__length_31980953 |
31980953 |
56313646 |
1.7608 |
22.3397 |
| PGA_scaffold17__51_contigs__length_34923512 |
34923512 |
58263635 |
1.6683 |
6.618 |
| PGA_scaffold18__69_contigs__length_27737463 |
27737463 |
40905329 |
1.4747 |
8.8894 |