| Name |
Length |
Mapped bases |
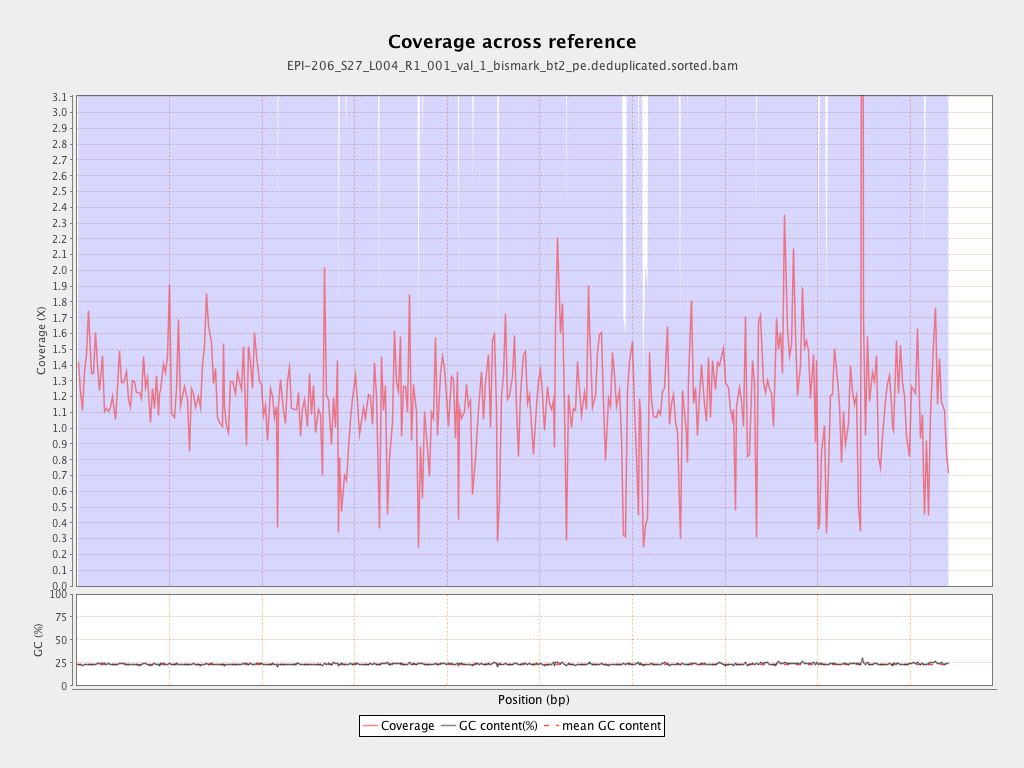
Mean coverage |
Standard deviation |
| PGA_scaffold1__77_contigs__length_89643857 |
89643857 |
114531375 |
1.2776 |
4.6418 |
| PGA_scaffold2__36_contigs__length_69596280 |
69596280 |
90959025 |
1.307 |
6.2049 |
| PGA_scaffold3__111_contigs__length_57743597 |
57743597 |
71245865 |
1.2338 |
4.1694 |
| PGA_scaffold4__129_contigs__length_65288255 |
65288255 |
76022416 |
1.1644 |
6.0129 |
| PGA_scaffold5__109_contigs__length_67248332 |
67248332 |
70193502 |
1.0438 |
4.4788 |
| PGA_scaffold6__104_contigs__length_61759565 |
61759565 |
68732130 |
1.1129 |
8.6483 |
| PGA_scaffold7__69_contigs__length_43120122 |
43120122 |
49383638 |
1.1453 |
3.9831 |
| PGA_scaffold8__63_contigs__length_61151155 |
61151155 |
73072722 |
1.195 |
4.4939 |
| PGA_scaffold9__45_contigs__length_38581958 |
38581958 |
50898026 |
1.3192 |
11.2439 |
| PGA_scaffold10__49_contigs__length_53961475 |
53961475 |
61195826 |
1.1341 |
3.7231 |
| PGA_scaffold11__79_contigs__length_51449921 |
51449921 |
52151115 |
1.0136 |
4.8894 |
| PGA_scaffold12__71_contigs__length_50438331 |
50438331 |
64567815 |
1.2801 |
5.6777 |
| PGA_scaffold13__52_contigs__length_44396874 |
44396874 |
52434558 |
1.181 |
4.9797 |
| PGA_scaffold14__91_contigs__length_45393038 |
45393038 |
70185697 |
1.5462 |
23.1264 |
| PGA_scaffold15__101_contigs__length_47938513 |
47938513 |
45923566 |
0.958 |
4.0465 |
| PGA_scaffold16__33_contigs__length_31980953 |
31980953 |
41224710 |
1.289 |
19.9506 |
| PGA_scaffold17__51_contigs__length_34923512 |
34923512 |
41661560 |
1.1929 |
5.2736 |
| PGA_scaffold18__69_contigs__length_27737463 |
27737463 |
29507553 |
1.0638 |
7.2779 |