| Name |
Length |
Mapped bases |
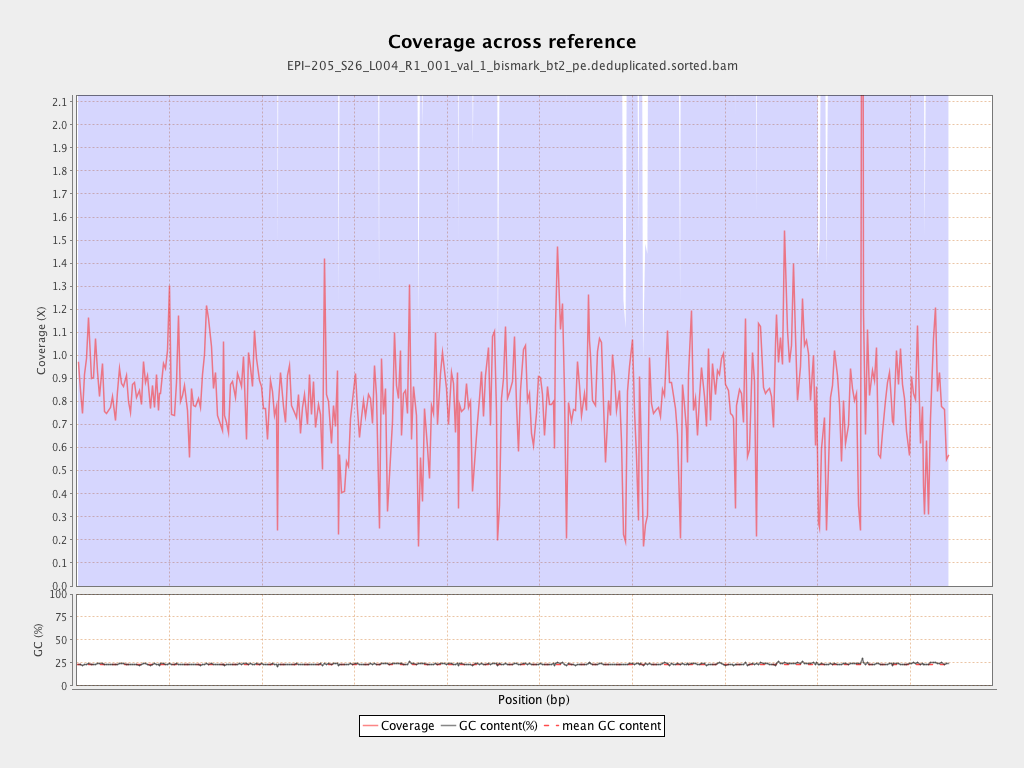
Mean coverage |
Standard deviation |
| PGA_scaffold1__77_contigs__length_89643857 |
89643857 |
77551570 |
0.8651 |
3.5456 |
| PGA_scaffold2__36_contigs__length_69596280 |
69596280 |
61857256 |
0.8888 |
4.4315 |
| PGA_scaffold3__111_contigs__length_57743597 |
57743597 |
48783198 |
0.8448 |
3.0826 |
| PGA_scaffold4__129_contigs__length_65288255 |
65288255 |
52415017 |
0.8028 |
4.3572 |
| PGA_scaffold5__109_contigs__length_67248332 |
67248332 |
47696591 |
0.7093 |
3.1049 |
| PGA_scaffold6__104_contigs__length_61759565 |
61759565 |
47339203 |
0.7665 |
6.4752 |
| PGA_scaffold7__69_contigs__length_43120122 |
43120122 |
34366447 |
0.797 |
2.7915 |
| PGA_scaffold8__63_contigs__length_61151155 |
61151155 |
49885608 |
0.8158 |
3.0548 |
| PGA_scaffold9__45_contigs__length_38581958 |
38581958 |
34845944 |
0.9032 |
7.8696 |
| PGA_scaffold10__49_contigs__length_53961475 |
53961475 |
41342929 |
0.7662 |
2.6524 |
| PGA_scaffold11__79_contigs__length_51449921 |
51449921 |
36574690 |
0.7109 |
3.4717 |
| PGA_scaffold12__71_contigs__length_50438331 |
50438331 |
43616489 |
0.8647 |
3.919 |
| PGA_scaffold13__52_contigs__length_44396874 |
44396874 |
35833002 |
0.8071 |
3.495 |
| PGA_scaffold14__91_contigs__length_45393038 |
45393038 |
47185670 |
1.0395 |
14.9784 |
| PGA_scaffold15__101_contigs__length_47938513 |
47938513 |
31865837 |
0.6647 |
2.8656 |
| PGA_scaffold16__33_contigs__length_31980953 |
31980953 |
28546182 |
0.8926 |
12.6819 |
| PGA_scaffold17__51_contigs__length_34923512 |
34923512 |
28635401 |
0.8199 |
3.8121 |
| PGA_scaffold18__69_contigs__length_27737463 |
27737463 |
20298417 |
0.7318 |
5.1192 |