| Name |
Length |
Mapped bases |
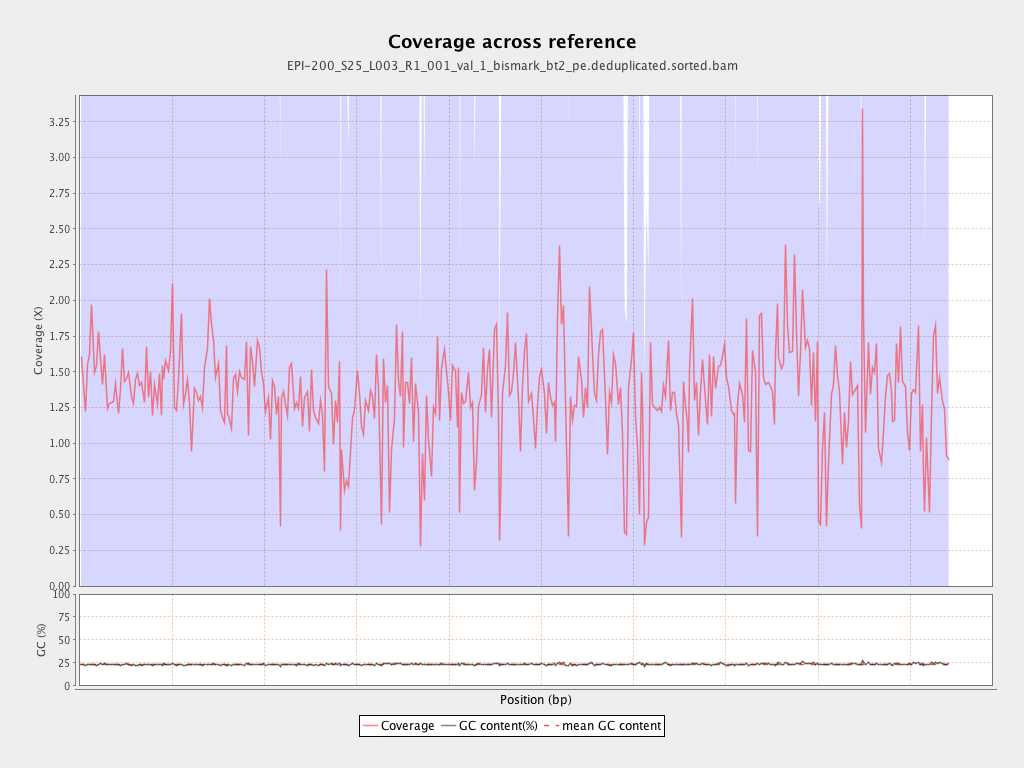
Mean coverage |
Standard deviation |
| PGA_scaffold1__77_contigs__length_89643857 |
89643857 |
128949325 |
1.4385 |
4.3703 |
| PGA_scaffold2__36_contigs__length_69596280 |
69596280 |
101964813 |
1.4651 |
5.8132 |
| PGA_scaffold3__111_contigs__length_57743597 |
57743597 |
80559553 |
1.3951 |
4.6311 |
| PGA_scaffold4__129_contigs__length_65288255 |
65288255 |
85414167 |
1.3083 |
6.2976 |
| PGA_scaffold5__109_contigs__length_67248332 |
67248332 |
78912341 |
1.1734 |
4.7548 |
| PGA_scaffold6__104_contigs__length_61759565 |
61759565 |
76623389 |
1.2407 |
6.0803 |
| PGA_scaffold7__69_contigs__length_43120122 |
43120122 |
57095504 |
1.3241 |
4.4571 |
| PGA_scaffold8__63_contigs__length_61151155 |
61151155 |
82168642 |
1.3437 |
4.6467 |
| PGA_scaffold9__45_contigs__length_38581958 |
38581958 |
57066876 |
1.4791 |
12.0156 |
| PGA_scaffold10__49_contigs__length_53961475 |
53961475 |
68854273 |
1.276 |
4.1144 |
| PGA_scaffold11__79_contigs__length_51449921 |
51449921 |
59092658 |
1.1485 |
4.7155 |
| PGA_scaffold12__71_contigs__length_50438331 |
50438331 |
72147634 |
1.4304 |
6.0971 |
| PGA_scaffold13__52_contigs__length_44396874 |
44396874 |
59160509 |
1.3325 |
5.3916 |
| PGA_scaffold14__91_contigs__length_45393038 |
45393038 |
77233867 |
1.7014 |
21.1208 |
| PGA_scaffold15__101_contigs__length_47938513 |
47938513 |
52196617 |
1.0888 |
4.3586 |
| PGA_scaffold16__33_contigs__length_31980953 |
31980953 |
44880987 |
1.4034 |
10.0102 |
| PGA_scaffold17__51_contigs__length_34923512 |
34923512 |
46937466 |
1.344 |
4.8052 |
| PGA_scaffold18__69_contigs__length_27737463 |
27737463 |
32688643 |
1.1785 |
6.2126 |