| Name |
Length |
Mapped bases |
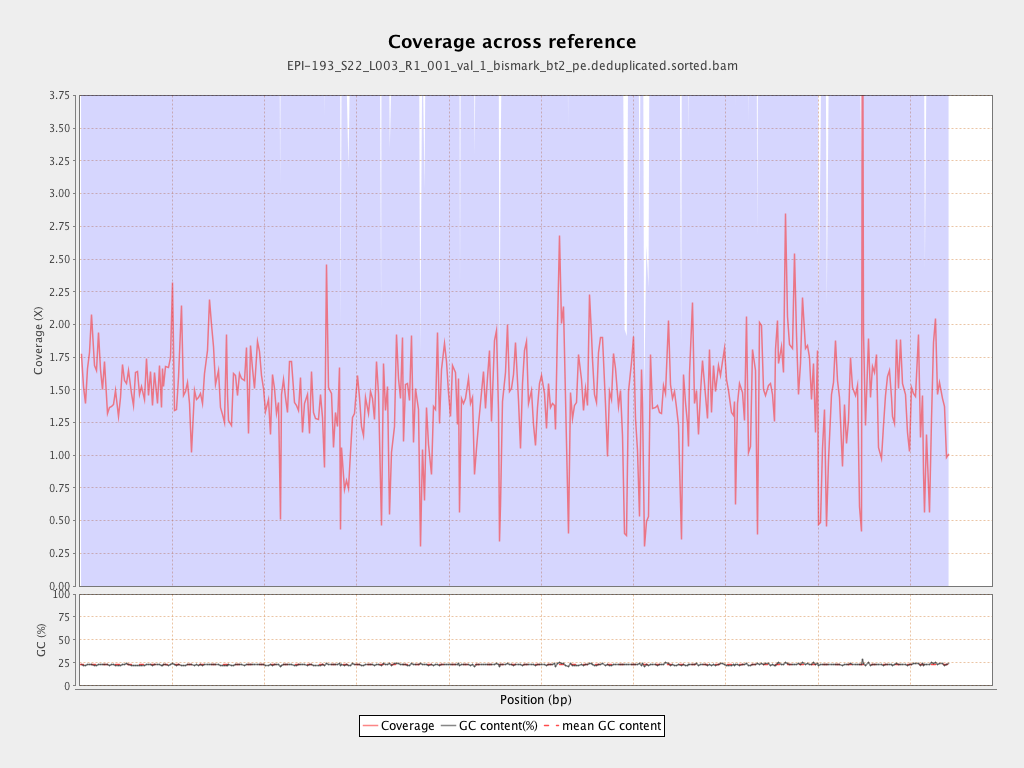
Mean coverage |
Standard deviation |
| PGA_scaffold1__77_contigs__length_89643857 |
89643857 |
139918490 |
1.5608 |
4.5817 |
| PGA_scaffold2__36_contigs__length_69596280 |
69596280 |
111118803 |
1.5966 |
7.0946 |
| PGA_scaffold3__111_contigs__length_57743597 |
57743597 |
87581042 |
1.5167 |
4.719 |
| PGA_scaffold4__129_contigs__length_65288255 |
65288255 |
93319455 |
1.4293 |
6.7865 |
| PGA_scaffold5__109_contigs__length_67248332 |
67248332 |
84976575 |
1.2636 |
4.8768 |
| PGA_scaffold6__104_contigs__length_61759565 |
61759565 |
84232708 |
1.3639 |
6.9731 |
| PGA_scaffold7__69_contigs__length_43120122 |
43120122 |
61728119 |
1.4315 |
4.5276 |
| PGA_scaffold8__63_contigs__length_61151155 |
61151155 |
88873584 |
1.4533 |
4.69 |
| PGA_scaffold9__45_contigs__length_38581958 |
38581958 |
62664420 |
1.6242 |
12.9958 |
| PGA_scaffold10__49_contigs__length_53961475 |
53961475 |
74249813 |
1.376 |
4.1593 |
| PGA_scaffold11__79_contigs__length_51449921 |
51449921 |
65281467 |
1.2688 |
5.4436 |
| PGA_scaffold12__71_contigs__length_50438331 |
50438331 |
78177826 |
1.55 |
6.107 |
| PGA_scaffold13__52_contigs__length_44396874 |
44396874 |
64172449 |
1.4454 |
5.2644 |
| PGA_scaffold14__91_contigs__length_45393038 |
45393038 |
84183489 |
1.8545 |
26.7636 |
| PGA_scaffold15__101_contigs__length_47938513 |
47938513 |
57309313 |
1.1955 |
4.4502 |
| PGA_scaffold16__33_contigs__length_31980953 |
31980953 |
49556176 |
1.5496 |
14.9345 |
| PGA_scaffold17__51_contigs__length_34923512 |
34923512 |
51057930 |
1.462 |
5.1334 |
| PGA_scaffold18__69_contigs__length_27737463 |
27737463 |
35693016 |
1.2868 |
8.1262 |