| Name |
Length |
Mapped bases |
Mean coverage |
Standard deviation |
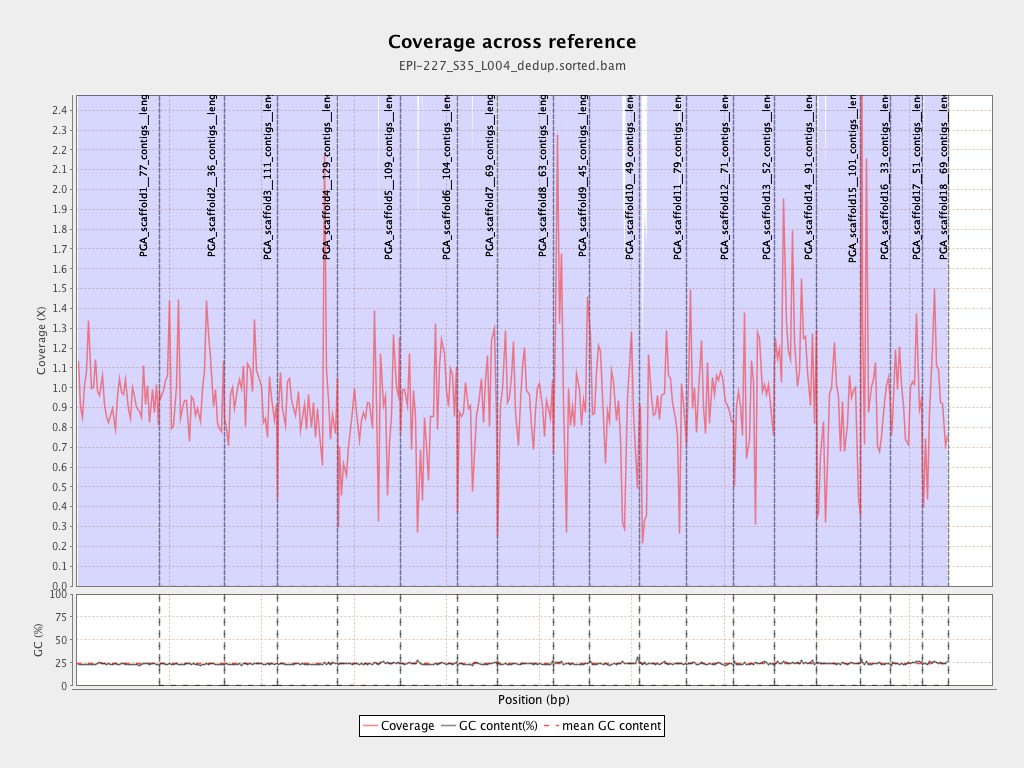
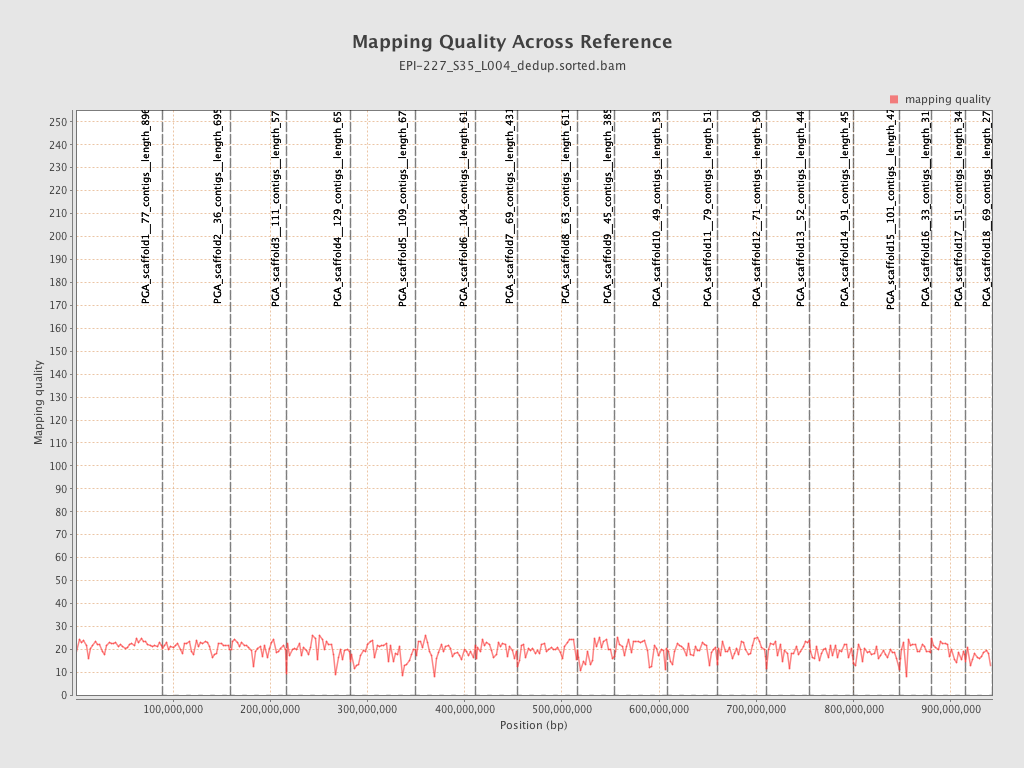
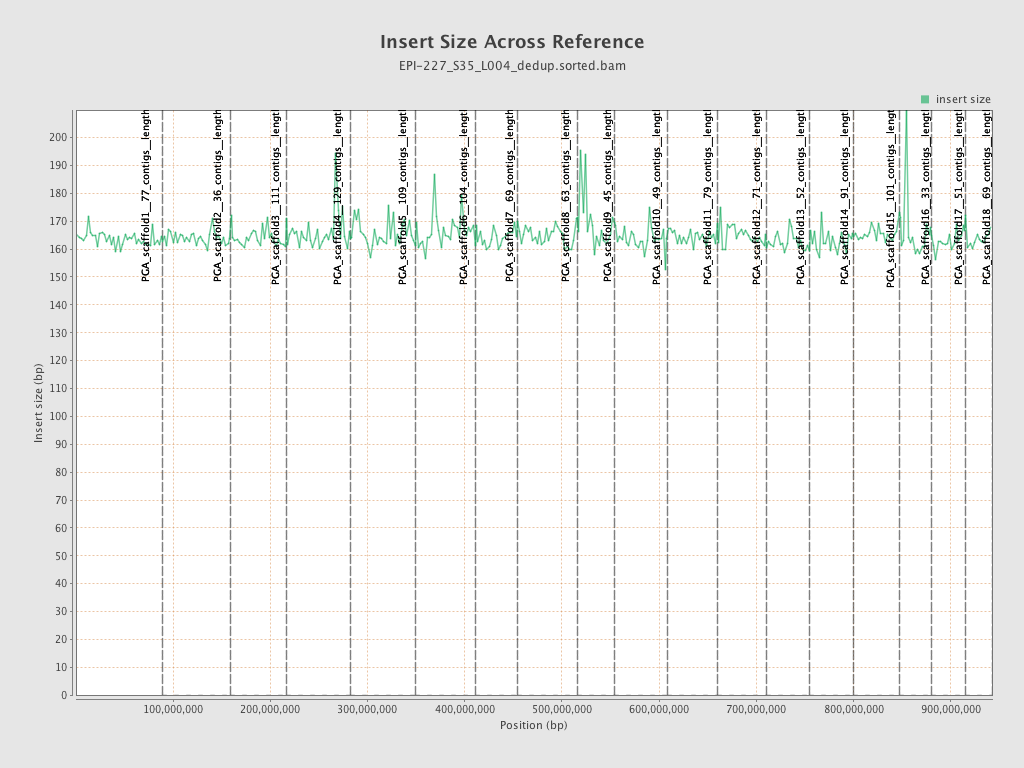
| PGA_scaffold1__77_contigs__length_89643857 |
89643857 |
86033098 |
0.9597 |
3.5455 |
| PGA_scaffold2__36_contigs__length_69596280 |
69596280 |
68817947 |
0.9888 |
4.8319 |
| PGA_scaffold3__111_contigs__length_57743597 |
57743597 |
55537882 |
0.9618 |
3.8969 |
| PGA_scaffold4__129_contigs__length_65288255 |
65288255 |
60838646 |
0.9318 |
9.1474 |
| PGA_scaffold5__109_contigs__length_67248332 |
67248332 |
56414939 |
0.8389 |
4.7682 |
| PGA_scaffold6__104_contigs__length_61759565 |
61759565 |
55268557 |
0.8949 |
5.4133 |
| PGA_scaffold7__69_contigs__length_43120122 |
43120122 |
39251520 |
0.9103 |
3.5109 |
| PGA_scaffold8__63_contigs__length_61151155 |
61151155 |
56950326 |
0.9313 |
3.756 |
| PGA_scaffold9__45_contigs__length_38581958 |
38581958 |
42058465 |
1.0901 |
12.6924 |
| PGA_scaffold10__49_contigs__length_53961475 |
53961475 |
47407646 |
0.8785 |
4.352 |
| PGA_scaffold11__79_contigs__length_51449921 |
51449921 |
42771854 |
0.8313 |
4.2309 |
| PGA_scaffold12__71_contigs__length_50438331 |
50438331 |
49853959 |
0.9884 |
5.4954 |
| PGA_scaffold13__52_contigs__length_44396874 |
44396874 |
41310330 |
0.9305 |
4.5082 |
| PGA_scaffold14__91_contigs__length_45393038 |
45393038 |
56147495 |
1.2369 |
21.4745 |
| PGA_scaffold15__101_contigs__length_47938513 |
47938513 |
37634218 |
0.7851 |
3.5301 |
| PGA_scaffold16__33_contigs__length_31980953 |
31980953 |
33872063 |
1.0591 |
14.2368 |
| PGA_scaffold17__51_contigs__length_34923512 |
34923512 |
34013608 |
0.9739 |
5.1432 |
| PGA_scaffold18__69_contigs__length_27737463 |
27737463 |
24899607 |
0.8977 |
7.425 |
