| Name |
Length |
Mapped bases |
Mean coverage |
Standard deviation |
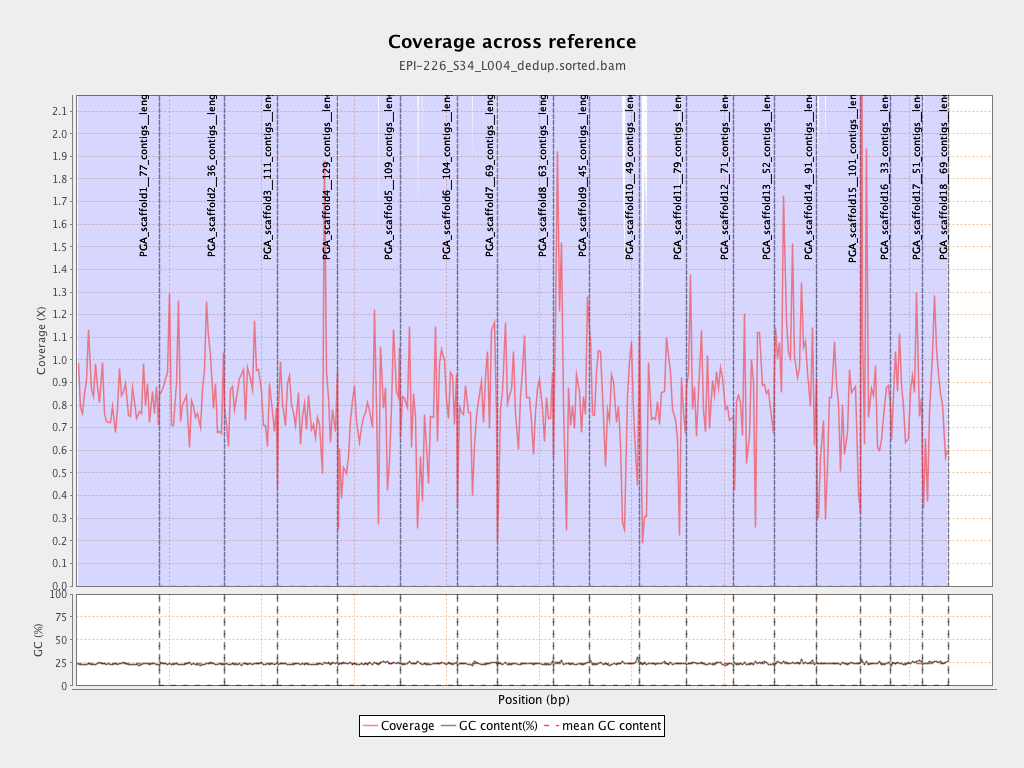
| PGA_scaffold1__77_contigs__length_89643857 |
89643857 |
74664821 |
0.8329 |
3.694 |
| PGA_scaffold2__36_contigs__length_69596280 |
69596280 |
60306670 |
0.8665 |
4.4456 |
| PGA_scaffold3__111_contigs__length_57743597 |
57743597 |
48393443 |
0.8381 |
3.7493 |
| PGA_scaffold4__129_contigs__length_65288255 |
65288255 |
52915919 |
0.8105 |
8.4715 |
| PGA_scaffold5__109_contigs__length_67248332 |
67248332 |
49286780 |
0.7329 |
4.4074 |
| PGA_scaffold6__104_contigs__length_61759565 |
61759565 |
47737952 |
0.773 |
5.869 |
| PGA_scaffold7__69_contigs__length_43120122 |
43120122 |
34707417 |
0.8049 |
3.5123 |
| PGA_scaffold8__63_contigs__length_61151155 |
61151155 |
49638539 |
0.8117 |
3.7619 |
| PGA_scaffold9__45_contigs__length_38581958 |
38581958 |
36881659 |
0.9559 |
11.4117 |
| PGA_scaffold10__49_contigs__length_53961475 |
53961475 |
41352382 |
0.7663 |
4.2361 |
| PGA_scaffold11__79_contigs__length_51449921 |
51449921 |
37032811 |
0.7198 |
4.176 |
| PGA_scaffold12__71_contigs__length_50438331 |
50438331 |
43883503 |
0.87 |
5.4282 |
| PGA_scaffold13__52_contigs__length_44396874 |
44396874 |
36231303 |
0.8161 |
4.3951 |
| PGA_scaffold14__91_contigs__length_45393038 |
45393038 |
48540667 |
1.0693 |
19.8348 |
| PGA_scaffold15__101_contigs__length_47938513 |
47938513 |
32620375 |
0.6805 |
3.4162 |
| PGA_scaffold16__33_contigs__length_31980953 |
31980953 |
29275423 |
0.9154 |
12.9596 |
| PGA_scaffold17__51_contigs__length_34923512 |
34923512 |
30056320 |
0.8606 |
5.0125 |
| PGA_scaffold18__69_contigs__length_27737463 |
27737463 |
21630851 |
0.7798 |
6.6224 |


