| Name |
Length |
Mapped bases |
Mean coverage |
Standard deviation |
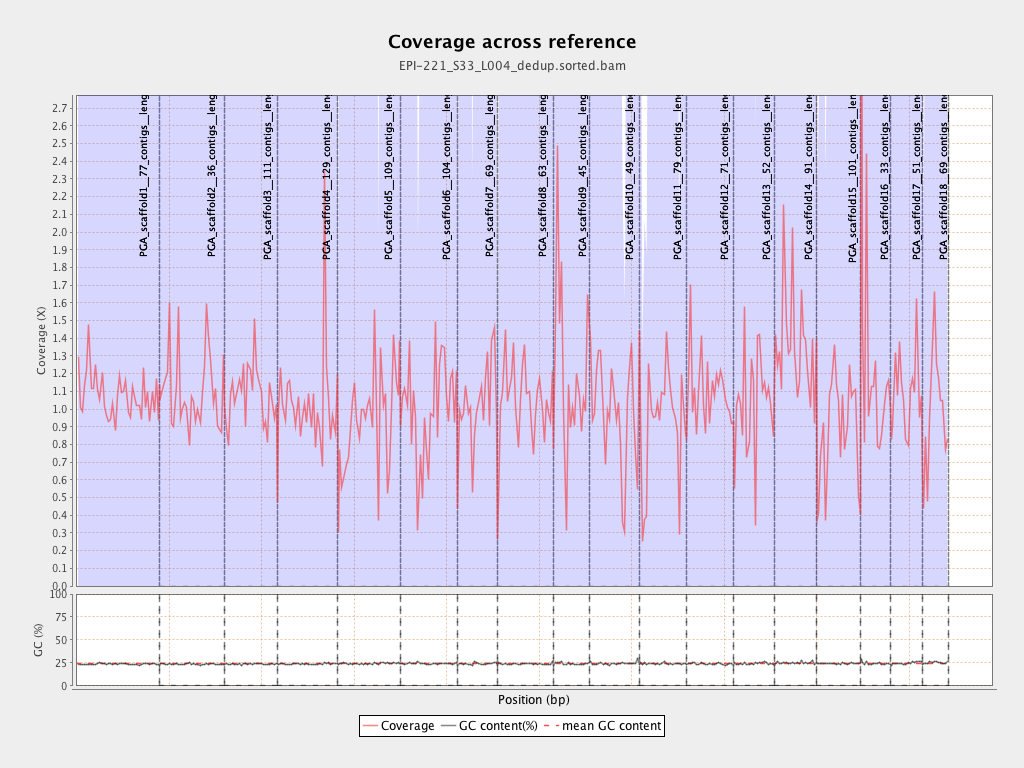
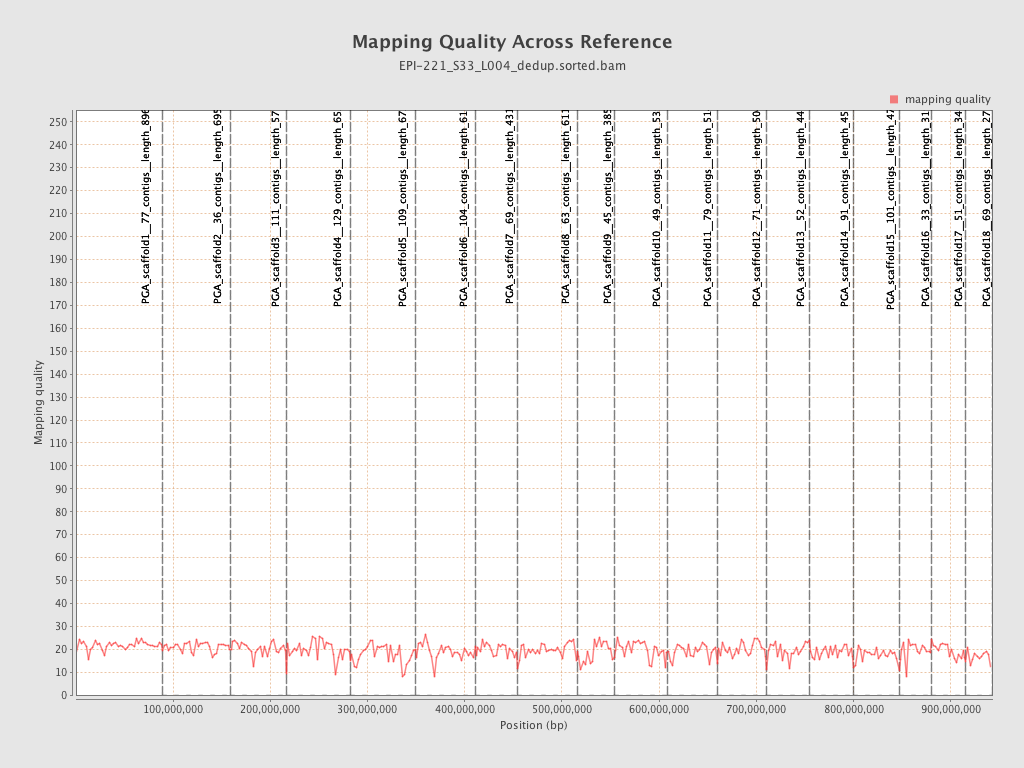
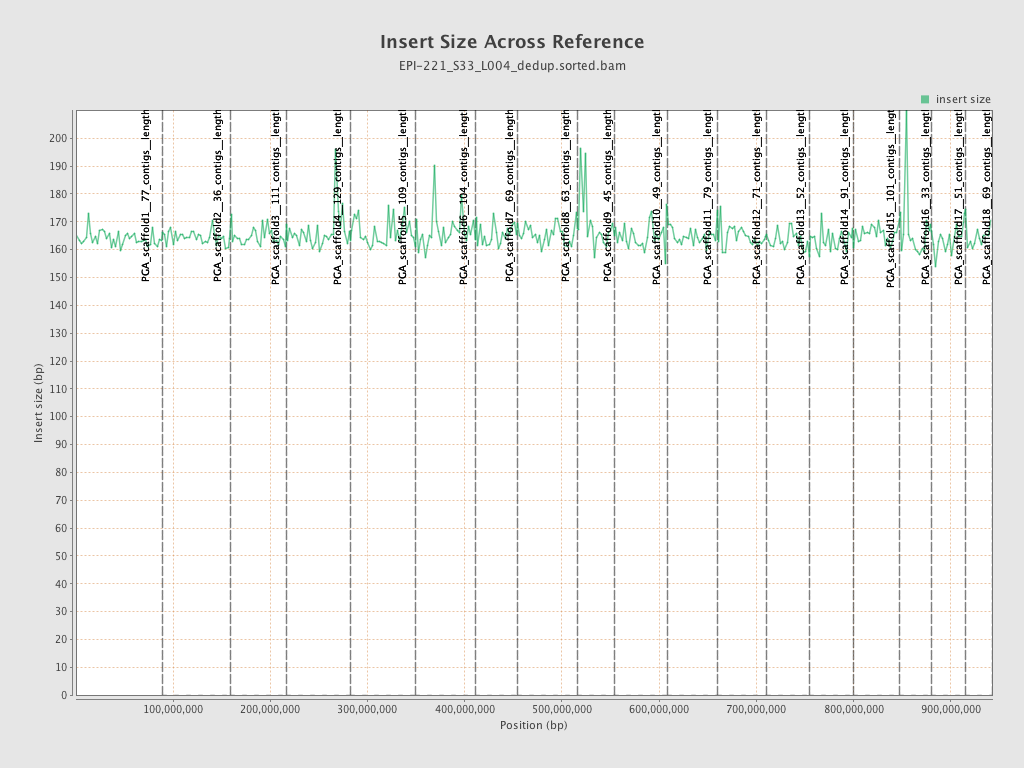
| PGA_scaffold1__77_contigs__length_89643857 |
89643857 |
96544125 |
1.077 |
4.0881 |
| PGA_scaffold2__36_contigs__length_69596280 |
69596280 |
76894399 |
1.1049 |
5.4218 |
| PGA_scaffold3__111_contigs__length_57743597 |
57743597 |
62114573 |
1.0757 |
4.3399 |
| PGA_scaffold4__129_contigs__length_65288255 |
65288255 |
68029624 |
1.042 |
9.8616 |
| PGA_scaffold5__109_contigs__length_67248332 |
67248332 |
63355511 |
0.9421 |
5.2912 |
| PGA_scaffold6__104_contigs__length_61759565 |
61759565 |
61598874 |
0.9974 |
6.6519 |
| PGA_scaffold7__69_contigs__length_43120122 |
43120122 |
44253683 |
1.0263 |
3.9277 |
| PGA_scaffold8__63_contigs__length_61151155 |
61151155 |
63914461 |
1.0452 |
4.4263 |
| PGA_scaffold9__45_contigs__length_38581958 |
38581958 |
46719419 |
1.2109 |
13.7091 |
| PGA_scaffold10__49_contigs__length_53961475 |
53961475 |
52763677 |
0.9778 |
4.6433 |
| PGA_scaffold11__79_contigs__length_51449921 |
51449921 |
47417071 |
0.9216 |
4.852 |
| PGA_scaffold12__71_contigs__length_50438331 |
50438331 |
55825534 |
1.1068 |
6.1407 |
| PGA_scaffold13__52_contigs__length_44396874 |
44396874 |
46284855 |
1.0425 |
5.2577 |
| PGA_scaffold14__91_contigs__length_45393038 |
45393038 |
62133432 |
1.3688 |
22.7115 |
| PGA_scaffold15__101_contigs__length_47938513 |
47938513 |
42323323 |
0.8829 |
3.9098 |
| PGA_scaffold16__33_contigs__length_31980953 |
31980953 |
37966267 |
1.1872 |
16.6996 |
| PGA_scaffold17__51_contigs__length_34923512 |
34923512 |
38141711 |
1.0921 |
5.5564 |
| PGA_scaffold18__69_contigs__length_27737463 |
27737463 |
27715846 |
0.9992 |
7.9116 |
