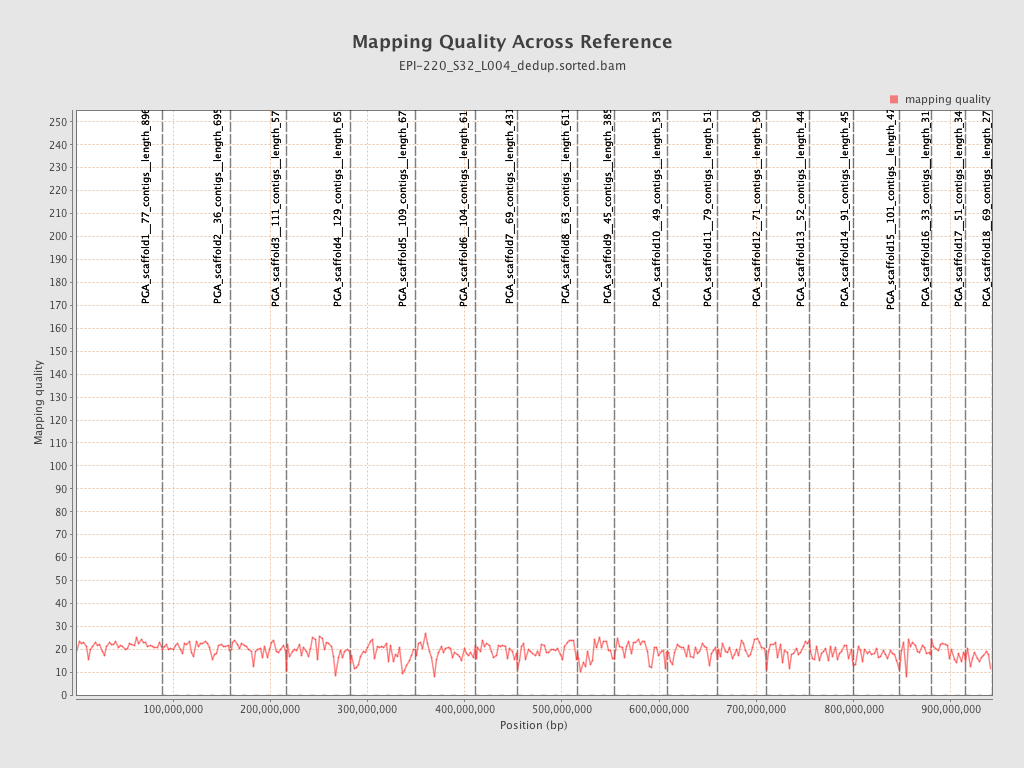
| Name |
Length |
Mapped bases |
Mean coverage |
Standard deviation |
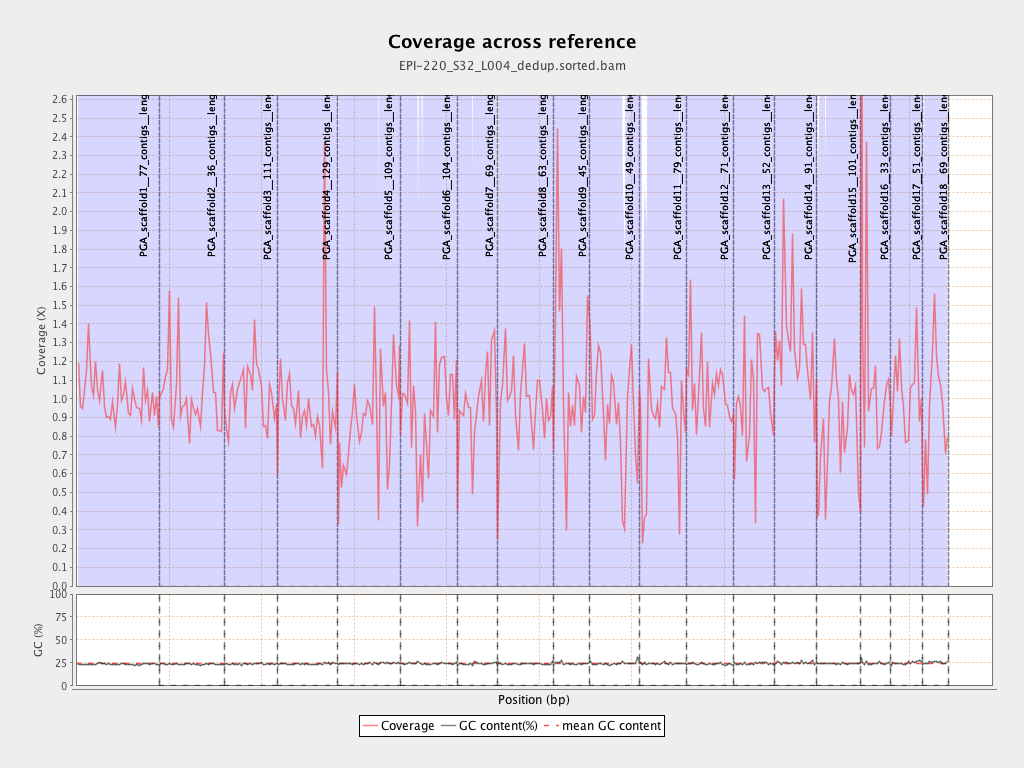
| PGA_scaffold1__77_contigs__length_89643857 |
89643857 |
90772537 |
1.0126 |
4.221 |
| PGA_scaffold2__36_contigs__length_69596280 |
69596280 |
73247137 |
1.0525 |
5.2593 |
| PGA_scaffold3__111_contigs__length_57743597 |
57743597 |
58929030 |
1.0205 |
4.2377 |
| PGA_scaffold4__129_contigs__length_65288255 |
65288255 |
64656159 |
0.9903 |
10.2783 |
| PGA_scaffold5__109_contigs__length_67248332 |
67248332 |
59906055 |
0.8908 |
5.2413 |
| PGA_scaffold6__104_contigs__length_61759565 |
61759565 |
58670631 |
0.95 |
6.9604 |
| PGA_scaffold7__69_contigs__length_43120122 |
43120122 |
41984159 |
0.9737 |
4.0442 |
| PGA_scaffold8__63_contigs__length_61151155 |
61151155 |
60033092 |
0.9817 |
4.1734 |
| PGA_scaffold9__45_contigs__length_38581958 |
38581958 |
45012577 |
1.1667 |
13.8521 |
| PGA_scaffold10__49_contigs__length_53961475 |
53961475 |
50014896 |
0.9269 |
4.7249 |
| PGA_scaffold11__79_contigs__length_51449921 |
51449921 |
45015247 |
0.8749 |
4.8824 |
| PGA_scaffold12__71_contigs__length_50438331 |
50438331 |
53047475 |
1.0517 |
6.1566 |
| PGA_scaffold13__52_contigs__length_44396874 |
44396874 |
43700117 |
0.9843 |
5.0133 |
| PGA_scaffold14__91_contigs__length_45393038 |
45393038 |
59044733 |
1.3007 |
22.9321 |
| PGA_scaffold15__101_contigs__length_47938513 |
47938513 |
39807183 |
0.8304 |
3.9466 |
| PGA_scaffold16__33_contigs__length_31980953 |
31980953 |
36208232 |
1.1322 |
16.9796 |
| PGA_scaffold17__51_contigs__length_34923512 |
34923512 |
35978612 |
1.0302 |
5.7434 |
| PGA_scaffold18__69_contigs__length_27737463 |
27737463 |
26601562 |
0.959 |
7.7606 |

