| Name |
Length |
Mapped bases |
Mean coverage |
Standard deviation |
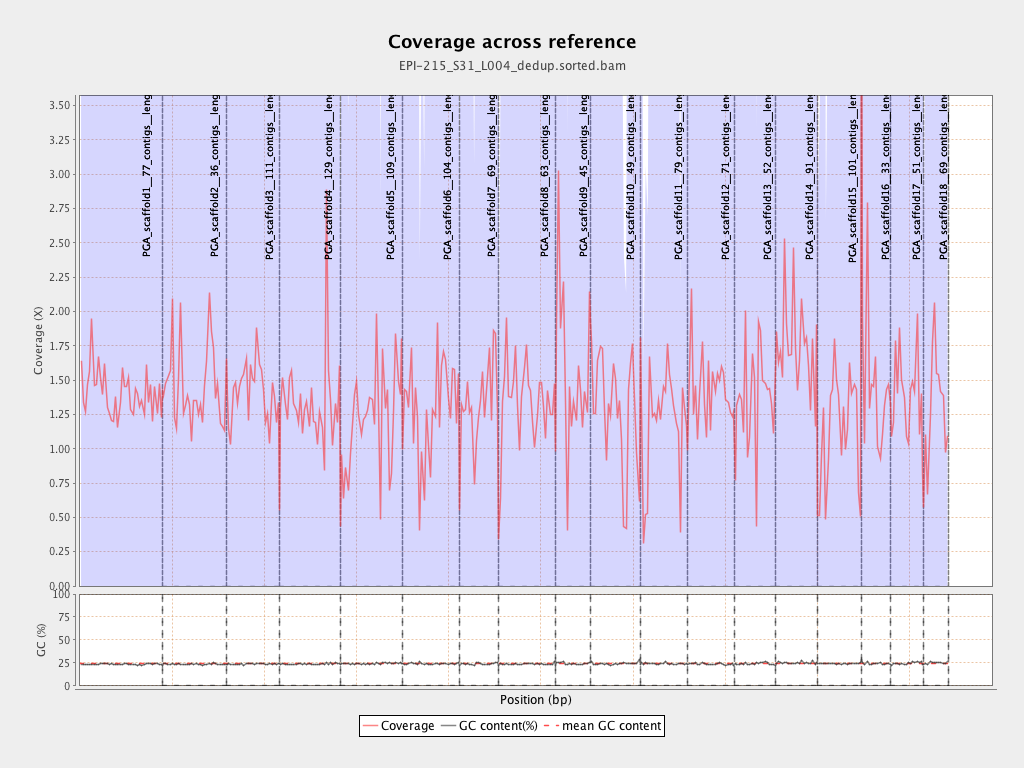
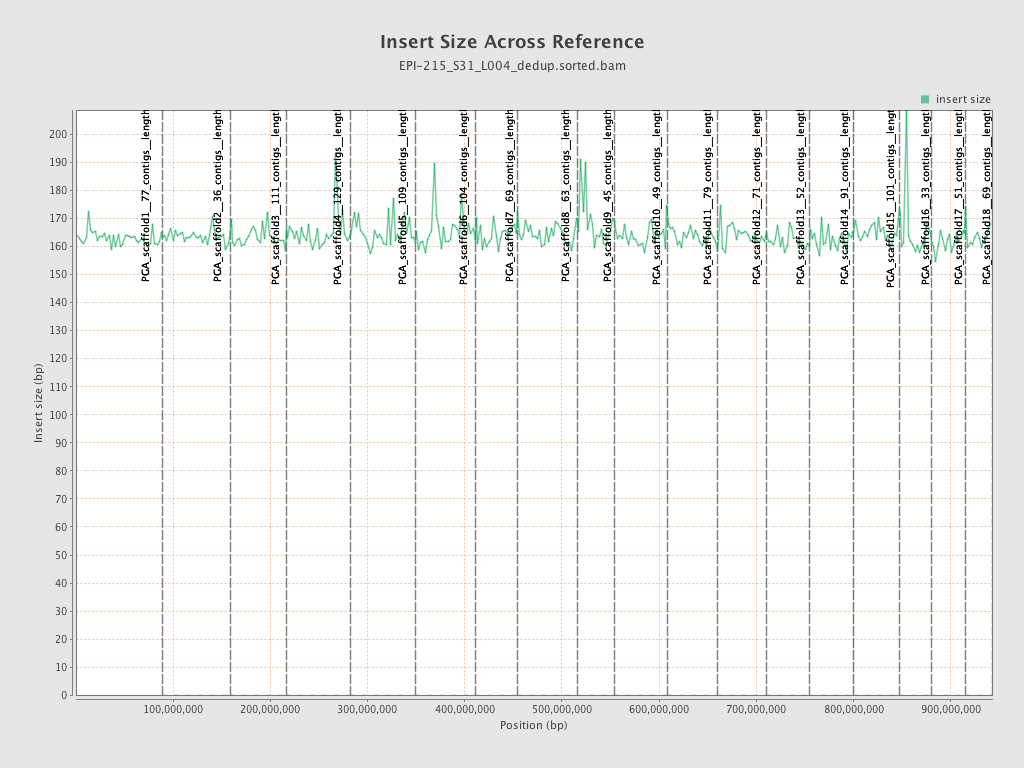
| PGA_scaffold1__77_contigs__length_89643857 |
89643857 |
126253204 |
1.4084 |
5.037 |
| PGA_scaffold2__36_contigs__length_69596280 |
69596280 |
100957133 |
1.4506 |
6.4118 |
| PGA_scaffold3__111_contigs__length_57743597 |
57743597 |
81097432 |
1.4044 |
5.3185 |
| PGA_scaffold4__129_contigs__length_65288255 |
65288255 |
87705726 |
1.3434 |
10.7837 |
| PGA_scaffold5__109_contigs__length_67248332 |
67248332 |
81602547 |
1.2135 |
6.3993 |
| PGA_scaffold6__104_contigs__length_61759565 |
61759565 |
79466626 |
1.2867 |
7.7352 |
| PGA_scaffold7__69_contigs__length_43120122 |
43120122 |
58049178 |
1.3462 |
4.9537 |
| PGA_scaffold8__63_contigs__length_61151155 |
61151155 |
83350288 |
1.363 |
5.2557 |
| PGA_scaffold9__45_contigs__length_38581958 |
38581958 |
60192393 |
1.5601 |
15.1298 |
| PGA_scaffold10__49_contigs__length_53961475 |
53961475 |
69329468 |
1.2848 |
5.2448 |
| PGA_scaffold11__79_contigs__length_51449921 |
51449921 |
61086227 |
1.1873 |
5.7138 |
| PGA_scaffold12__71_contigs__length_50438331 |
50438331 |
72440256 |
1.4362 |
7.5944 |
| PGA_scaffold13__52_contigs__length_44396874 |
44396874 |
60650462 |
1.3661 |
6.5723 |
| PGA_scaffold14__91_contigs__length_45393038 |
45393038 |
79737267 |
1.7566 |
24.4397 |
| PGA_scaffold15__101_contigs__length_47938513 |
47938513 |
55103718 |
1.1495 |
5.0456 |
| PGA_scaffold16__33_contigs__length_31980953 |
31980953 |
47826600 |
1.4955 |
17.8039 |
| PGA_scaffold17__51_contigs__length_34923512 |
34923512 |
49335579 |
1.4127 |
6.4467 |
| PGA_scaffold18__69_contigs__length_27737463 |
27737463 |
35951330 |
1.2961 |
9.1203 |


