| Name |
Length |
Mapped bases |
Mean coverage |
Standard deviation |
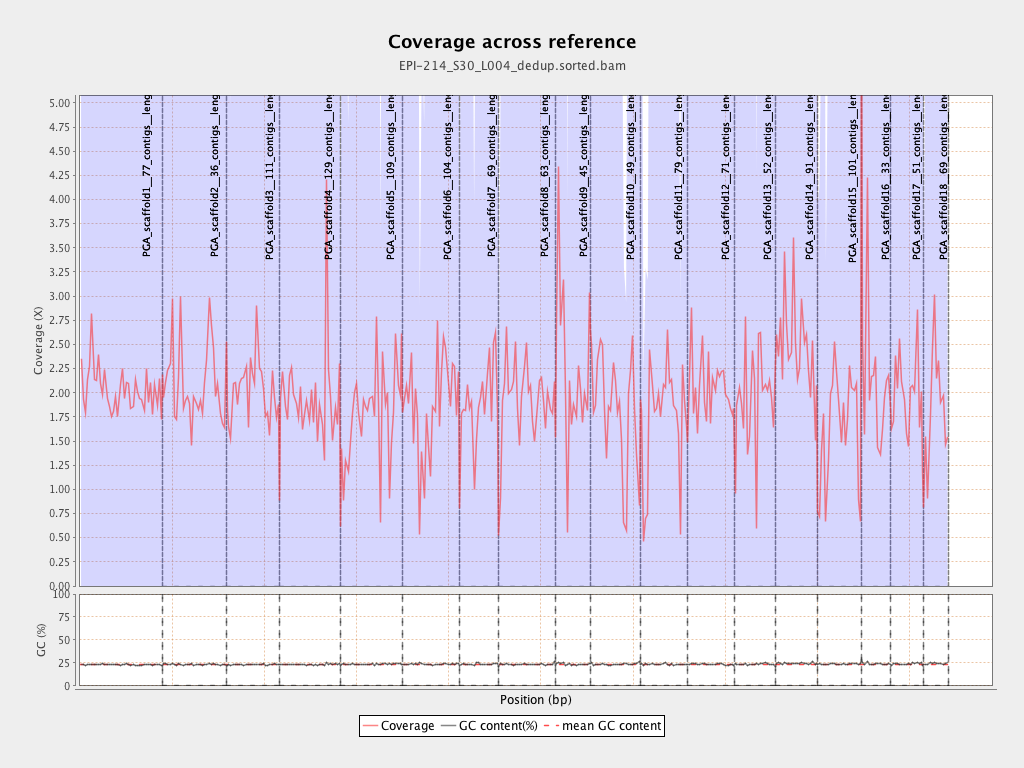
| PGA_scaffold1__77_contigs__length_89643857 |
89643857 |
182203632 |
2.0325 |
6.5568 |
| PGA_scaffold2__36_contigs__length_69596280 |
69596280 |
145591381 |
2.0919 |
8.9685 |
| PGA_scaffold3__111_contigs__length_57743597 |
57743597 |
116373590 |
2.0154 |
7.0527 |
| PGA_scaffold4__129_contigs__length_65288255 |
65288255 |
127624568 |
1.9548 |
14.9751 |
| PGA_scaffold5__109_contigs__length_67248332 |
67248332 |
118566986 |
1.7631 |
8.6247 |
| PGA_scaffold6__104_contigs__length_61759565 |
61759565 |
115084490 |
1.8634 |
9.6946 |
| PGA_scaffold7__69_contigs__length_43120122 |
43120122 |
82297733 |
1.9086 |
6.4329 |
| PGA_scaffold8__63_contigs__length_61151155 |
61151155 |
119594411 |
1.9557 |
7.0644 |
| PGA_scaffold9__45_contigs__length_38581958 |
38581958 |
86253260 |
2.2356 |
21.7843 |
| PGA_scaffold10__49_contigs__length_53961475 |
53961475 |
98520656 |
1.8258 |
6.5753 |
| PGA_scaffold11__79_contigs__length_51449921 |
51449921 |
89589318 |
1.7413 |
7.7523 |
| PGA_scaffold12__71_contigs__length_50438331 |
50438331 |
103945633 |
2.0608 |
9.1878 |
| PGA_scaffold13__52_contigs__length_44396874 |
44396874 |
85974094 |
1.9365 |
8.5446 |
| PGA_scaffold14__91_contigs__length_45393038 |
45393038 |
113334050 |
2.4967 |
30.1134 |
| PGA_scaffold15__101_contigs__length_47938513 |
47938513 |
78895161 |
1.6458 |
6.447 |
| PGA_scaffold16__33_contigs__length_31980953 |
31980953 |
69567532 |
2.1753 |
24.3066 |
| PGA_scaffold17__51_contigs__length_34923512 |
34923512 |
69876705 |
2.0008 |
7.808 |
| PGA_scaffold18__69_contigs__length_27737463 |
27737463 |
51125809 |
1.8432 |
13.0972 |


