| Name |
Length |
Mapped bases |
Mean coverage |
Standard deviation |
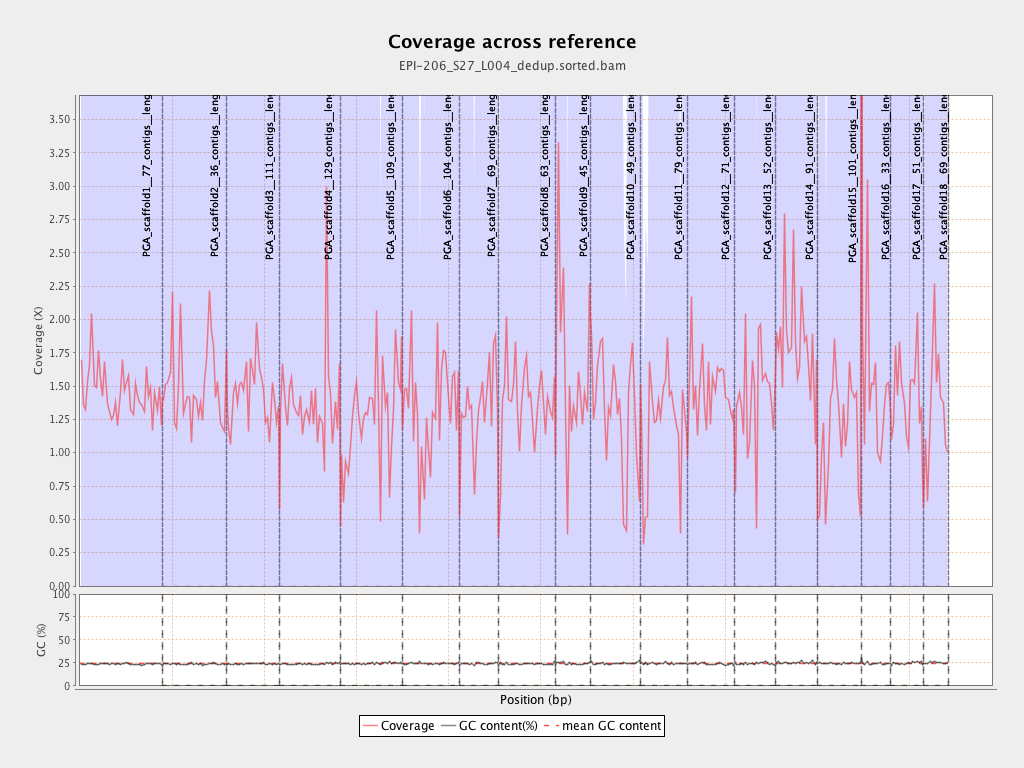
| PGA_scaffold1__77_contigs__length_89643857 |
89643857 |
130649928 |
1.4574 |
6.0002 |
| PGA_scaffold2__36_contigs__length_69596280 |
69596280 |
104227843 |
1.4976 |
7.566 |
| PGA_scaffold3__111_contigs__length_57743597 |
57743597 |
82616076 |
1.4307 |
5.4391 |
| PGA_scaffold4__129_contigs__length_65288255 |
65288255 |
90371380 |
1.3842 |
11.8247 |
| PGA_scaffold5__109_contigs__length_67248332 |
67248332 |
85093262 |
1.2654 |
6.9888 |
| PGA_scaffold6__104_contigs__length_61759565 |
61759565 |
82144727 |
1.3301 |
9.9136 |
| PGA_scaffold7__69_contigs__length_43120122 |
43120122 |
58457371 |
1.3557 |
5.2681 |
| PGA_scaffold8__63_contigs__length_61151155 |
61151155 |
85285701 |
1.3947 |
5.6097 |
| PGA_scaffold9__45_contigs__length_38581958 |
38581958 |
62235356 |
1.6131 |
17.4162 |
| PGA_scaffold10__49_contigs__length_53961475 |
53961475 |
71545786 |
1.3259 |
5.7105 |
| PGA_scaffold11__79_contigs__length_51449921 |
51449921 |
62274416 |
1.2104 |
6.5893 |
| PGA_scaffold12__71_contigs__length_50438331 |
50438331 |
74982490 |
1.4866 |
7.7309 |
| PGA_scaffold13__52_contigs__length_44396874 |
44396874 |
62143497 |
1.3997 |
7.223 |
| PGA_scaffold14__91_contigs__length_45393038 |
45393038 |
83489939 |
1.8393 |
28.5482 |
| PGA_scaffold15__101_contigs__length_47938513 |
47938513 |
55976578 |
1.1677 |
5.4587 |
| PGA_scaffold16__33_contigs__length_31980953 |
31980953 |
50508862 |
1.5793 |
25.9256 |
| PGA_scaffold17__51_contigs__length_34923512 |
34923512 |
50481645 |
1.4455 |
7.3498 |
| PGA_scaffold18__69_contigs__length_27737463 |
27737463 |
36920896 |
1.3311 |
10.9002 |


